Tax-Motivated Expense Shifting by Not-for-profit Hospitals Jenn-Shyong Kuo, Ph.D.
Professor,
Department of Accounting, National Taipei University Email: jennkuo@mail.ntpu.edu.tw
Yi-Cheng Ho, Ph.D.
Professor,
Department of Public Finance, National Cheng-Chi University E-mail: yho@nccu.edu.tw
The total net income of not-for-profit hospitals contain medical and non-medical part. The non-medical net income is taxable income and the non-non-medical net income is tax exemption. The community benefit service expenditure are included in the medical expense. Taiwan’s Medical Care Act statutory the minimum standards for non-profit hospitals in providing community benefit services is the net medical income to 20% of medical revenue balance (i.e. quasi social contribution). Not-for-profit hospitals have the motivation to allocate the expense on taxable medical part in order to reduce income tax and the minimum standards amount for non-profit hospitals in providing community benefit services.
This project will collect panel data from Taiwan’s non-profit hospitals to
investigate the expense reallocation from tax exemption part to taxable part since the Article 46 of the Medical Care Act provides that non-profit hospitals should
contribute at least “10% of medical revenue balances” to both two categories of activities: education research and development and community benefit services. Does the tax motivated expense shifting to reduce the quasi social contribution cause the not-for-profit hospitals subject to the bad financial performance on medical income?
There are three goals of this project. Firstly, understand the expense shifting behavior of not-for-profit hospitals. Secondly, examine the expense shifting level of not-for-profit hospitals. Thirdly, these results can be the reference interest party decision and government regulation amendment.
Keywords: Not-for-Profit Hospitals, Expense Shifting, Unrelated Business Income
Introduction
In order to encourage nonprofit organizations (NPOs) to engage in charity care, governments often adopted measures like tax exemptions, direct subsidies, and entrusted schemes to reduce the cost of charity care. Nonprofit hospitals supplemented the resources with the operating surplus of paid medical services. To ensure the effectiveness of tax exemption policy, governments stipulated the standards for nonprofit hospitals to engage in community benefit services like minimum charity care as the basis for the latter to be entitled to tax exemptions. The tax-exempt qualification of those nonprofit hospitals which failed to meet the standards would be revoked (Nicholson et al., 2000).1 The reason why organization get the tax-exempt status is because they provide community benefit service. In other words, nonprofit hospitals offer the community benefit service expense is similar to indirectly paying tax.
In terms of the design of tax exemption policy, governments granted a number of tax relief and exemptions for nonprofit hospitals. In other words, the latter would use tax expenditure to complement community benefit services like charity care.
Correspondingly, governments established the items and limits of community benefit services which should be engaged by nonprofit hospitals. Taiwan had similar
measures. As of tax exemption measures, nonprofit hospitals were exempted from business income tax and land tax. The natural persons and legal persons donated to legal persons could enjoy tax sparing credit. In the aspect of community benefit services like charity care, Medical Care Act Article 46 clearly states the minimum amount of community benefit services that nonprofit hospitals shall reach.
Before the amendment of the Medical Care Act in 2004, the amount of community benefit services for nonprofit hospitals had to be “at least 5% of the annual medical revenue.” The amending the law in 2005, the minimum amount was changed to “20% of profit from medical operation.” The amendment has considerably reduced the minimum amount of the community benefit services that nonprofit hospitals should provide. However, Medical Care Act Article 46 stipulates that legal persons shall allocate funds for community benefit services according to the profit of medical activities rather than non-medical activities. The differences among allocation rates of different activities serve as the basis to verify the expense shifting of nonprofit
hospitals.
Past studies on expense shifting of nonprofit organization mainly discuss on the allocation of joint cost from tax-exempt activities to taxable activities, the costs of
1 For example, Utah supreme court cancel the tax-exempt status of “Intermountain Health Care” (Maiure et al., 2004). The Tax authority (IRS) of Illinois cancel the tax-exempt qualification of Provena Covenant Medical Center. (Maiure et al., 2004; Barniv et al., 2005)
3
taxable activities could be reduced so as to encourage the NPOs to engage more in such activities. In consideration of tax, through the shift of the expense from tax-exempt activities to taxable activities, they could minimize their taxable income. In addition, when NPOs engaged in taxable business activities unrelated to the purpose of establishment, they had the inducement to control cost apportionment and
minimize tax liabilities (Yetman, 2001; Jegers, 2010; Sansing, 1998; Yoder, Addy, and McAllister, 2011).
When NPOs used the profits gained through commercial activities for public welfare or idle capacity for business activities, they could not only activate idle capacity to enhance efficiency, but also the cost appointment shouldered by tax-exempt activities was avoided by business activities.
Sansing (1998) pointed out based on an analytical model that, as the common
expenses of medical activities and non-medical activities were non-separable without economic allocation, one of the purposes of cost accounting was to allocate the non-separable expenses, In the face of the selection of allocation basis, managers would consider the inducement of tax. The amending the law in 2005, create two different base on calculation the minimum amount community benefit services that nonprofit hospitals should provide. Thus, the manager have incentive to shifting expense from medical to non-medical activity.
This paper based on that of the empirical research on Yetman (2001) to estimate the degree of nonprofit hospitals to shift expenditure to reduce the net profits of medical activities so as to avoid community benefit services. After the law amendment, due to the difference of allocation rates of the two types of activities, when nonprofit
hospitals wanted to reduce the minimum expenditure of community benefit services, they had the motivation to shift the expenditure of non-medical activities to medical activities and reduce the legal minimum funds allocated for community benefit services through the reduction of the profit of medical activities.
Literature Review
The motivation and method of NPOs to manipulate financial statements were similar to those of profit organizations. The main purpose was to change the organization's report financial performance. For instance, the real manipulations to re-arrange recognition dates might belong to purely administrative manipulations without accounting
manipulations of substantial impact. Both manipulations had costs. For instance, the time spent in manipulations and the change of organizational activities due to the re-arrangement of recognition dates would become less efficient. In the past, the studies on the range of this topic of NPOs mainly allocated costs of different types of activities, belong to a topic of cost accounting manipulations.
The past studies on the strategies of levy duty and tax avoidance and evasion of NPOs emphasized unrelated business income tax (UBIT). To assure that NPOs could reach their goals and avoid them from abusing their tax-exempt qualification, the tax laws of each country generally levy UBIT of UBI. However, NPOs engaged in commercial activities with idle capacity, which could not only enhance production efficiency, but also allocate the fixed cost completely distributed to tax-exempt activities previously to commercial activities for cross-subsidization. In consideration of taxation, when NPOs engaged in both taxable and tax-exempt activities, managers might choose cost allocation method with low tax (Sansing 1998). Sansing (1998) examine nonprofit tax avoidance via cost allocations and demonstrate that nonprofits have a greater ability to shift expenses from their tax-exempt to their taxable activities when these activities are linked via common expenses. Much past literature pointed out that NPOs would excessively allocate costs to unrelated businesses. Even though the overall operation of the organizations was profitable, taxable activities had loss to reduce tax, indicating their traces of cost shifting (Hofmann 2007).
Yetman (2001) adopted regression analysis to establish the estimation model of variable expenses of NPOs in the first chapter to estimate their expense shifting and degree of business income tax avoidance. Yetman (2001) studied the data on 703 educational institutions, health agencies, and public charities in America between 1995 and 1997 to estimate the expense-shifted and found that the expenses shifted by educational institutions accounted for 23% of the expense reported, while health agencies accounted for 62%. There were no significant expenses shifting in public charities. The model established by Yetman (2001) was often adopted by subsequent studies. Both Cordes and Weisbrod (1998) and Yetman (2001) pointed out that NPOs shifted costs to taxable activities and did not show reverse patterns in the aspect of revenue.
Yetman (2003) considered 1,400 NPOs 481 educational institutions, 714 health agencies, and 205 public charities) in America between 1995 and 1997 as his subjects. He combined the model of Yetman (2001) and joint cost allocation to explore the difference between the estimated total expense and reported total expense of taxable
5
activities. His empirical results showed that the taxable and tax-exempt activities of NPOs were complementary. Through the allocation of joint cost from tax-exempt activities to taxable activities, the costs of taxable activities could be reduced so as to encourage the NPOs to engage more in such activities.
Hofmann (2007) probed into 399 observed values of 126 associations in America between 1994 and 1997. He adopted Yetman (2001) to estimate the costs to engage in both taxable activities and tax-exempt activities by the associations. His empirical findings demonstrated that, based on the shifting of expense, the associations shifted about 20-36% expense to unrelated businesses. Hofmann (2007) doubted that the fixed expense in Yetman (2001) occurred as average revenue was not reasonable and there were underestimation of the expense shifted to unrelated businesses. Supposing that the fixed expense occurred based on the average variable expense, the fixed expense was allocated by the estimated variable expense of each activity.
Omer and Yetman (2003) studied the Tables 990 T and 990 of 1,367 sectional observed values of the NPOs in America between 1995 and 1997 to analyze if the NPOs managed their taxable income. They analyzed the abnormalities of the counts of profits (net profit of taxable activities/income of taxable activities) of the NPOs approaching zero ([-0.01, 0.01]) to see the administration of taxable income by the NPOs. They believed that the reports of the proximity of taxable income to zero were the results of their tax avoidance. Omer and Yetman (2003) further adopted Logit to analyze which frictions and restrictions reduced the occurrence of proximity of the reported taxable income to zero of the NPOs. Their empirical results showed that when there were relative (similar) tax-exempt activities or accumulated net loss of operation for the scale of NPOs (total assets) and taxable activities, the rate to report the proximity of taxable income to zero by the NPOs reduced. In addition, when the NPOs were hospitals (rather than educational institutions or public charities) or employed accounts as their tax agents (no matter of TOP 5 accounting firms or not), the rate to report the proximity of taxable income to zero by the NPOs increased.
To sum up the afore-mentioned literature, Taiwan Medical Care Act Article 46 stipulated the minimum amount of community benefit services that nonprofit hospitals should engage in. It is a natural experiment of nonprofit hospitals expense shifting. The profit of medical revenue should be considered as the benchmark to allocate community benefit service expense. Based on the patterns with specified use (community benefit services) and charge benchmark (the profit of medical activities), it was similar to the business income tax levied from medical activities, which was used specifically for community benefit services. This regulation classified the activities of nonprofit hospitals into taxable activities and tax-exempt activities and
formed the space for managers to manipulate account figures via cost allocation. This paper had two parts to analyze the expense shifting of nonprofit hospitals and the factors influencing expense shifting.
研究設計
Empirical Strategy
SHIFEXP
According to the principles of management accounting, costs should be allocated to different activities based on causal relationship. But there was lack of the actual resource usage data of each activity. Besides, it was difficult to quantify the outcomes of these activities. There was lack of economic allocation methods. Such situations occurred for nonprofit hospitals as well. The norm on the preparation of financial statements by medical legal persons did not stipulate the method to allocate common costs. Based on generally acknowledged principles, it was necessary for the legal persons to allocate common cost in a consistent and reasonable manner. And the legal persons had high discretionary power.
Yetman (2001) first proposed the method to partition the common costs of NPOs into taxable activities and tax-exempt activities and established the indicators to assess the tax avoidance of NPOs through expense shifting. Later, Hofmann (2007) and Omer and Yetman (2007) revised Yetman (2001) based on the drawback. With the approach in the three articles, this plan partitioned the total expense of nonprofit hospitals in medical activities (activities which should allocate community benefit service expense) and medical activities (activities which should not allocate
community benefit service expense, such as investment, planning, fundraising, and so on). We fellow the idea of Yetman(2001) to construct the index of expense shifting for nonprofit hospital in Taiwan. The assumption and step of estimation are described as follows:
Step 1: Estimating the relationship between the total expense and the revenue of various
activities. The total cost was divided into the activities requiring community benefit service expense and without such allocation. In other words, the total cost was to conduct regression of medical activity revenue, investment revenue, fundraising, and the revenues of other activities. It was supposed that the relationship between activity expense and revenue of the organizations was fixed. Cross section was used to estimate expense-to-revenue relationship, first difference model, and deflation of total assets. The function is shown below:
7
∆TOTEXP is the difference between the total expense in Years t and t-1 of Nonprofit Hospital i。2
∆MED_REV s the annual change of medical activity revenue,
∆ - _ s the annual change of non-medical activity revenue.
Eq. (1) adopted first difference of controllable nonprofit hospital-specific effects and the scale difference that the deflation of the total assets could control nonprofit hospitals (nonprofit hospital-specific effects). β , β could be understood as the expense increased following the increase of each NTD 1 revenue, or, the variable expense ratio of medical and nonmedical revenue. β meant that the variable fixed cost expectation was 0.
Step 2: Estimating the variable expense of nonprofit hospitals. Based on the supposed
variable expense and the occurrence of marginal patter estimated in calculated as follows:
estimated medical variable expense = ∗ _ (2)
estimated non-medical variable expense = ∗ - _ (3)
The total fixed expense was the difference between total reported expense and total predicted variable expense:
_ ∗ _ ∗ - _ ) (4)
Step 3: Allocating the fixed cost to each activity. The norm on financial statement
preparation of nonprofit hospitals allowed them to allocate the common cost of the equipment or staffs commonly used by both medical and non-medical activities to other activities. Based on the assumed fixed expense and the occurrence in the pattern of average revenue, the fixed expense was allocated by the relative revenue rate of each activity. The amount of allocation of fixed cost is: 3
2 Past study (Yetman 2001; Hofsmann 2007; Yoder, Addy, and McAllister 2011) used total expense
expect tax expense, Therefore, we have similar regression result with total expense data exclude community benefit service.
3 Hofmann (2007) doubted that the fixed expense in Yetman (2001) occurred as average revenue was
not reasonable and there were underestimation of the expense shifted to unrelated businesses. Supposing that the fixed expense occurred based on the average variable expense, the fixed expense was allocated by the estimated variable expense of each activity. We adopt Hofmann (2007) model and have consistent result.
estimated medical fixed expense = ∗ _
_ - _ (5) Step 4: Healthcare benefits-motivated expense shifting. The difference among the actual reported expense, estimated variable expense, and allocated fixed expense of nonprofit hospitals was calculated.
estimated medical expense = estimated medical variable expense + estimated medical fixed expense
contribution-motived expense shifting (SHIFEXP)= reported medical expense – estimated medical expense.
Empirical Result
Currently, there are 57 nonprofit hospitals in Taiwan, wherein, 9 are in preparation 1 stop operation and 1 was converted into a public hospital in 2009. This study analyzed the data of 46 medical institutions in operation between 2001 and 2013, the total observation is 554. The data source was the annual financial reports of the nonprofit hospitals reviewed by accountants.
Descriptive Statistics:
Summary statistics for the analysis variables are reported in Table 1. We label our expense shifting measure as SHIFEXP1 indicated the data from 2001 to 2013 and SHIFRXP2 were respectively estimate 2001-2004 and 2005-2013.
The mean are both negative for SHIFEXP1 and SHIFEXP2 which are contrary to expectation, indicated that on the average nonprofit hospital allocated expense to non-medical activity. The standard deviation are both larger than mean and median
indicates there are large degree of variation of expense shifting in different ownership hospitals.
We further test SHIFEXP1-2 divided into two period. For SHIFEXP1, we found after 2005 nonprofit hospitals significantly allocation expense from medical activity to non-medical activity. But, for SHIFEXP2, we found after 2005 nonprofit hospitals significantly allocation expense from non-medical activity to medical activity. Initial revealed that there were different expense shifting behavior for nonprofit hospitals before and after 2005.
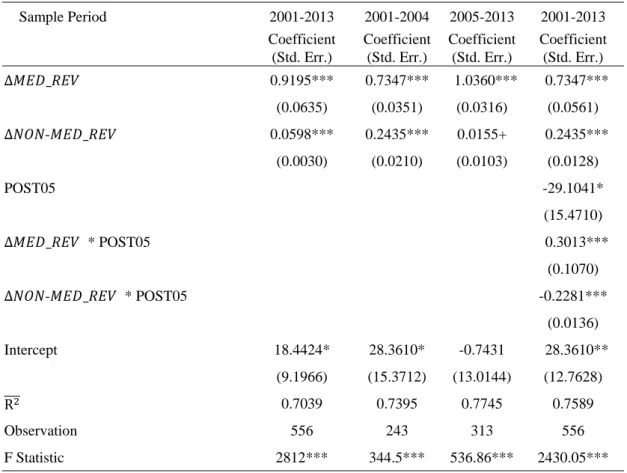
The result of step 1 estimation list on Table 2. Table 3 is the correlation
coefficients of all independent variables are below 0.1595 and VIF(variance inflation factor) are below 1.5, indicating that the colinearity level between key variables and
9
other independent variables is not high. The first column of Table 2 indicates that 0.9195 medical cost increase will cause one dollar medical revenue increase. The expense of one dollar nonmedical revenue is 0.0589. The meaning of intercept is when revenue remain unchanged, the average fixed expense were change 17,442 thousand NT dollars with 10% significant level. We used this estimation and fellow step 1 to 4 to calculation the amount of expense shifting.
After medical law amendment at 2005, the community benefit service providing by nonprofit hospitals are significantly change. We can rationally predict the level of expense shifting would be change as well. We use two method to test this prediction, firstly, we divide the data into 2 period, 2001-2004 and 2005-2013, separately regression for both 2 period. The result list on 2nd and 3rd column of Table 2. We test the null hypothesis of two regression model coefficients are equal. The chi-square statistics is 28.21, reject null hypothesis at significance level 1%. The Wald test also rejects the null hypothesis at significance level 1% that the medical revenue and non-medical revenue are equal.
Secondly, Extent the regression model with adding the interaction term between dummy variable (POST05) (i.e. if year >2005 equal to 1, 0 otherwise) and both change in medical revenues and change in non-medical revenues. Result is list on the 4th column of Table 2 which indicated both regression coefficients are significantly different from 0.
We can find the marginal cost of one dollar medical revenue increase was
significant difference between before and after 2005. Therefore, we use the regression result of 2nd and 3rd column of Table 2 to calculate the amount of amount of the excess expense as estimated in Yetman (2001) for period 2001-2004 and 2005-2013.
From Table 1 Panel B SHIFEXP2, we can find the mean and median are both negative in 2001-2004, but both turn positive in 2005-2013. Based on the results of t test and Wilcoxon test shows that after 2005 the medical expense shifting significantly increase.
結論
This study examines nonprofit hospitals expense shifting behavior and the determination. Before the amendment of the Medical Care Act in 2004, the amount of community benefit services for nonprofit hospitals had to be “at least 5% of the annual medical revenue.” The amending the law in 2005, the minimum amount was changed to “20% of profit from medical operation.” The amendment has considerably reduced the minimum amount of the community benefit services that nonprofit
hospitals should provide.
The amending the law in 2005, create two different base on calculation the minimum amount community benefit services that nonprofit hospitals should provide. Thus, the manager have incentive to shifting expense from medical to non-medical activity.
We fellow the idea of Yetman(2001) to construct the index of expense shifting for nonprofit hospital in Taiwan. This study analyzed the data of 46 medical
institutions in operation between 2001 and 2013. Empirical result indicated that after the law amendment, the nonprofit hospitals expense shifting level increase from non-medical activity to non-medical activity. In other word, the nonprofit hospitals
significantly allocated cost to medical activity.
Reference
Ho, Y. C. and J. S. Kuo (2016). Do nonprofit hospital change the community benefit service provided when faced with law amendment. Taiwan Economic Forecast
and Policy. 46(2): 119-158. (In Chinese with English abstract)
Kuo, J. S. and Y. C. Ho (2008). Do religious and secular not-for-profit hospitals respond differently to community benefit service expenditures. Third-Sector
Review 9: 71-94. (In Chinese with English abstract)
Becken, C., M. DeFound, J. Jiambalvo, and R. Subramanyam (1998). The effects of audit quality on earnings management. Contemporary Accounting Research, 15: 1-24.
Block, S. R., S. Rosenberg (2002). Toward a understanding of founder’s syndrome: an assessment of power and privilege among founders of nonprofit organizations.
Nonprofit Management & Leadership, 12(4): 353-368.
Cordes, J.J. & B. A. Weisbrod (1998). Differential taxation of nonprofits and the commercialization of nonprofit revenues. Journal of Policy Analysis and
Management, 17(2): 195–214.
Glaeser, E. L. (2003). The governance of not-for-profit organization. Chicago: University of Chicago Press.
Hofmann, M. (2007). Tax-motivated expense shifting by tax-exempt associations.
Journal of the American Taxation Association, 29(1), 43–60.
Jegers, M. (2010). The effect of board-manager agency conflicts on nonprofit organisations’ earnings and cost allocation manipulations. Accounting and
Business Research, 40(5), 407–419.
Maiure, L. S., J. Schneider, and N. Bellows (2004). Endangered Species? Not-For-Profit Hospitals Face Tax-Exemption Challenge. Healthcare Financial
Management, 58, 74–84.
11
Measuring Community Benefits Provided by For-Profit And Nonprofit Hospitals.
Health Affairs, 19(6), 168–177.
Omer, T.C. & R. J. Yetman (2003). Near zero taxable income reporting by nonprofit organizations. Journal of the American Taxation Association, 25(2): 19–34. Omer, T., & R. Yetman (2007). Tax misreporting and avoidance by nonprofit
organizations. Journal of the American Taxation Association, 29(1), 61–86. Sansing, R. (1998). The unrelated business income tax, cost allocation, and
productive efficiency. National Tax Journal, 51(2): 281–302.
Schmidt, A. (2007). Discussion of tax misreporting and avoidance by nonprofit organizations. Journal of the American Taxation Association, 29(1), 87–92. Scholes, M, M. Wolfson, M. Erickson, M. Hanlon, E. Maydew, and T. Shevlin (2015).
Taxes and business strategy: A planning approach. Boston: Pearson.
Stevens, R. A. (1989). In sickness and in wealth: American hospitals in the twentieth
century. New York: Basic Books.
Yetman, R. (2001). Tax-motivated expense shiftings by nonprofit organization.
Accounting Review, 76 (3): 297-311.
Yetman, R. (2003). Nonprofit taxable activities, production complementarities and joint cost allocation. National Tax Journal LVI(4): 789-799.
Yetman, M.H., T. J. Yetman and B. Badertscher (2009). Calibrating the reliability of publicly available nonprofit taxable activity disclosures: comparing IRS900 and IRS900-T data. Nonprofit and Voluntary Sector Quarterly, 38(1): 95–116.
Yoder, T., Addy, N., & B. McAllister (2011). Tax-motivated increases in qualifying distributions by private foundations. Journal of the American Taxation
Table 1 summary Statistics
Panel A N Mean Median Std. Dev.
Dependent variables
SHIFTEXP1 (in NT$ millions) 554 -168.337 -28.899 600.271
SHIFTEXP2 (in NT$ millions) 554 -138.493 2.212 752.086
Independent Varables
DONATION (in NT$ millions) 554 66.208 10.061 222.619
ASSETS (in NT$ millions) 554 8348.698 2037.312 32488.790
AGE 554 33.45307 33 18.13069 CHARITYCARE 554 35.065 5.659 84.076 BIG4CPA 554 0.314 0.000 0.465 POST05 554 0.563 1.000 0.496 RELIGIOUS 554 0.444 0.000 0.497 BUSSINESS 554 0.182 0.000 0.386 Other variables
TOTEXP (in NT$ millions) 554 3360.858 1411.513 6638.747
MEDREV (in NT$ millions) 554 3361.505 1411.763 6637.509
MEDEXP (in NT$ millions) 554 3144.356 1347.214 5957.056
NMEDREV (in NT$ millions) 554 403.346 48.557 1876.990
NMEDEXP (in NT$ millions) 554 107.087 17.703 414.845
Panel B Mean Median Std.Dev. Mean Median Std.Dev. t test Wilcoxon test
Period 2001-2004 (N =243) 2005-2013 (N=313) t statistics Z score SHIFTEXP
1 -81.641 -15.476 339.540 -235.648 -55.963 735.251 3.013*** 4.864*** SHIFTEXP
2 -504.001 -216.652 970.660 145.010 81.290 301.777 -11.195 *** -18.896*** *** Significant at the 1 percent level.
SHIFTEXP1: amount of the excess expense as estimated in Yetman (2001) for period 2001-2013; SHIFTEXP2: amount of the excess expense as estimated in Yetman (2001) for period 2001-2004 and 2005-2013;; DONATION: amount of revenue from donation in NT$ million; ASSETS: total assets in NT$ million; AGE: number of years since established; CHARITYCARE: amount of charity care in NT$ millions; BIG4CPA: indicator variable equal to 1 if financial statement was audited by a Big 4 CPA firm and 0 otherwise; POST05: indicator variables equal to 1 after 2005 year and 0 otherwise (medical law amendment at 2005); RELIGIOUS: indicator variables equal to 1 if the founder was religious institution and 0 otherwise; BUSSINESS: indicator variables equal to 1 if the founder was for-profit institution and 0 otherwise; TOTEXP: total expense in $ NT million; MEDREV: medical activities revenues in NT$ million; MEDEXP: medical activities expenses in
13
NT$ million; NMEDREV: medical activities revenues in NT$ million; NMEDEXP: non-medical activities expenses in NT$ million.
Table 2 Regression Estimates Used to Partition Nonprofit Medical Institutions Variables Expense between Medical and Nonmedical Activities
∆ _ ∆ _ ∆ - _ Sample Period 2001-2013 2001-2004 2005-2013 2001-2013 Coefficient (Std. Err.) Coefficient (Std. Err.) Coefficient (Std. Err.) Coefficient (Std. Err.) ∆ _ 0.9195*** 0.7347*** 1.0360*** 0.7347*** (0.0635) (0.0351) (0.0316) (0.0561) ∆ - _ 0.0598*** 0.2435*** 0.0155+ 0.2435*** (0.0030) (0.0210) (0.0103) (0.0128) POST05 -29.1041* (15.4710) ∆ _ * POST05 0.3013*** (0.1070) ∆ - _ * POST05 -0.2281*** (0.0136) Intercept 18.4424* 28.3610* -0.7431 28.3610** (9.1966) (15.3712) (13.0144) (12.7628) R 0.7039 0.7395 0.7745 0.7589 Observation 556 243 313 556 F Statistic 2812*** 344.5*** 536.86*** 2430.05***
+, *, **, *** Denotes significant at the 0.2, 0.1, 0.05 and 0.01 levels, respectively. All standard error in parentheses and are clustered by firm.
∆ _ :change in total medical expense; ∆ _ : change in medical revenues;
∆ - _ : change in non-medical revenues;
POST05: indicator variables equal to 1 post 2005 and 0 otherwise (medical law amendment at 2005).