行政院國家科學委員會補助專題研究計劃成果報告
計劃類別:整合型計劃
計劃編號:NSC 89-2415-H-004-035-JC
執行期間:88 年 10 月 1 日至 89 年 9 月 30 日
主 持 人:周行一,國立政治大學財務管理學系教授兼主任,
[email protected]
共同主持人:李怡宗,國立中正大學會計研究所副教授,
[email protected]
計劃參與人:廖怡慎,國立政治大學財務管理學系碩士班研究生,
[email protected]
執行單位:國立政治大學財務管理學系
中華民國 90 年 3 月 27 日
金融危機下股市初級市場價格穩定機制之研究
An Empir ical Resear ch on the Pr ice Stabilization Function of
Under wr iter s on the Secondar y Mar ket in Taiwan
金融危機下股市初級市場價格穩定機制之研究
An Empir ical Resear ch on the Pr ice Stabilization Function
of Under wr iter s on the Secondar y Mar ket in Taiwan
計劃編號:NSC 89-2415-H-004-035-JC
執行期限:88 年 10 月 1 日至 89 年 9 月 30 日
主 持 人:周行一,國立政治大學財務管理學系教授兼主任,
[email protected]
共同主持人:李怡宗,國立中正大學會計研究所副教授,
[email protected]
計劃參與人:廖怡慎,國立政治大學財務管理學系碩士班研究生,
[email protected]
中文摘要 本研究報告研究了民國八十六年至八 十八年間,85 個初次公開發行及上市案 (IPO),我們發現這些 IPO 的折價情況非常 普遍,而且折價幅度亦頗高,但是其上市 後高報酬率的型態,不太可能是因主辦承 銷商於上市後次級市場中進行價格安定操 作的結果。我們發現,主辦承銷商極少於 上市後中之次級市場中交易,而且沒有明 顯地為了安定價格而下單,因此我國的發 現較支持理論上 IPO 的折價來自於承銷商 刻意將承銷價格壓低以讓投資人有機會於 上市後獲利,以維護承銷商信譽之假說, 我國的 IPO 折價不是因承銷商價格安定操 作的結果,這個發現與美國的情況不一 致。 關鍵詞:初次公開發行之折價,價格安定 操作,主辦承銷商 English AbstractThis paper shows that IPO underpricing is a common phenomenon on the Taiwan Stock Exchange. Contrary to the empirical evidence in the US that price stabilization activities of lead underwriters are complements to IPO underpricing, we find that the lead underwriters in Taiwan almost never trade in the aftermarket. And when
they trade, they do not trade to stabilize the market. Our finding thus indicates that deliberate underpricing is more likely the reason for IPO underpricing in Taiwan so that the lead underwriters can preserve the reputation as good underwriters without having to intervene in the aftermarket. The IPO process and trading mechanism in Taiwan make it difficult for the lead underwriter to stabilize the price in the aftermarket..
Key wor ds: IPO underpricing, price stabilization, lead underwriter
I. Introduction
The literature in the U.S. tends to presume that underwriters provide liquidity in the aftermarket of IPOs. As Ellis, Michaely and O’Hara (2000) puts it, “an implicit, and at times even explicit, part of the contract between underwriters and issuers in an IPO is that the underwriter will provide liquidity in the post-issuance trading of the newly traded security.” The theoretical underpinning for the presumption is that the lead underwriter certify the quality of the issue by his past performance in IPO underwriting, and by providing price support for the issue in the aftermarket the underwriter can uphold its reputation as a decent underwriter.
Zaman (1994), Aggarwal (2000) hold the view that price support activities are a complement to underpricing of IPOs. An investment bank’s reputation for price support ensures that IPOs underwritten by the firm are perceived ex ante as less likely to be overpriced. In addition, the aftermarket trading starts before the distribution is completely settled. Since IPO investors have the legal right to cancel an order before the end of the settlement period, if the aftermarket price is not supported, the potential buyer who expressed interest in the offering could infer that the previously approached buyers had negative information about the stock and thus can renege on his purchase.
There is ample empirical evidence on the price support efforts of the underwriter. Schultz and Zaman (1994) find that underwriters generally quote the highest bids to support the price of less successful IPOs. Hanley, Kumar, and Seguin (1993) and Prabhala and Puri (1998) find evidence that the lead underwriter engages in stabilization. Michaely and Womack (1999) find that underwriters issue more buy recommendations than nonunderwriters and that the recommendations are positively biased. Ellis, Michaely and O’Hara (2000) and Aggarwal (2000) show that the lead underwriters primarily use the overallotment option in their price stabilizing effort. Ruud (1993) suggests that underwriter price support may account for the phenomenon of positive average initial IPO returns. He thus challenges the presumption underlying previous research that positive average initial IPO returns result primarily from deliberate underpricing.
In Taiwan the overallotment option is not allowed by the law. The lead underwriter has to include in the underwriting contract the percentage of IPO shares (15% to 25%) that would be bought by it as inventory. The underwriting syndicate cannot distribute more than what is left for distribution. Moreover, penalty bids is not used in practice in Taiwan because of the distribution methods dictated by the law. The issuing
firm can choose lottery or a combination of competitive bid and lottery as the distribution method. In any case the aftermarket trading does not start until the distribution is completely settled. So flipping will not be problematic, at least not in the sense discussed in the U.S. literature. For there is no need for the underwriter to post stabilization bid before the completion of distribution.
In addition, studying the IPOs on the NASDAQ market, Ellis, Michaely, and O’Hara (2000) conclude that the lead underwriter is always the dominant designated market maker who takes substantial inventory positions in the aftermarket trading. The lead underwriter engages in stabilization activities for less successful IPOs, and uses the overallotment option to reduce his inventory risk. The Taiwan Stock Exchange (TSEC) is an order-driven market without designated market makers. So the lead underwriter does not have the obligation to make the market in the aftermarket. However, the law does not prohibit the dealing department of the underwriter from buying IPO shares on the exchange after the distribution. Thus, the lead underwriter can support the aftermarket price of the IPO shares by buying them on the TSEC. It is worth noting that stocks listed on the TSEC can only be traded on the exchange.
In this paper we will show that the initial underpricing of IPOs is common in Taiwan. But the lead underwriter’s trading volume is meager. Compared to other traders, it almost never buys IPO shares during the 40-day period since the beginning of trading in the aftermarket. There is some indication that the lead underwriters buy more IPO shares in the bearish market than in the bullish market. But overall relatively speaking it sells more than it buys. In addition, there is no clear indication that the lead underwriter buys more when the IPO shares perform worse. We also do not have strong evidence that the lead underwriter with more IPO cases tend to support the price more than those with less cases.
Our finding is interesting. The amount of shares bought by the lead underwriter is so small relative to the total trading volume on the market that it cannot have material effect on the market price. In addition, when the lead underwriter trades, it does not necessarily trades in the direction of supporting the price by buying shares in the bear market and refraining from selling the stock in the bull market. This finding suggests that the lead underwiter simply does not stabilize the price in the aftermarket. In addition, our 1-day IPO returns are skewed to the left, often take extreme values, and quite a number of them would exhibit price reversal over a longer time period. Ruud (1993) finds that her 1-day returns distribution is quite positively skewed, is inordinately peaked at zero, and stocks with initial return that is close to zero would often decline over a longer time period. She uses these pieces of evidence to substantiate her hypothesis that underwriter price support plays a role in explaining high average initial IPO returns.
All evidence considered, contrary to the findings in the U.S. literature, our finding suggests that in Taiwan price stabilization activity is not a complement to underpricing of IPOs. Underwriter price support cannot account for the phenomenon of positive average initial IPO returns. Deliberate underpricing is likely the reason for the positive average initial IPO returns. If the lead underwriter has reputation concern and would like to be perceived by investors as the type that underwrites good shares, then underpricing may be an easier route to take than stabilizing the price on the secondary market.
The trading mechanism on the TSEC makes it difficult to conduct price stabilization activity in the aftermarket. Without the overallotment option the lead underwriter does not need to cover short position by buying IPO shares. In addition, the lead underwriter is not the designated market maker of the IPO issue. It can only support the price through the trading of the proprietary trading desk, which is
constrained by the law from buying more than 10% of the outstanding shares of any listed firm. The trading desk cannot place limit orders whose price is set at either the upper price limit or the lower price limit.1
At the open of the TSEC neither can the trading desk place buy (sell) orders whose price is above (below) the previous day’s close price. Moreover, the trading desk cannot buy and sell the same stock on the same trading day, unless the stocks sold are out of the inventory established prior to the current trading day.
Our research has the following implication. The design of the trading mechanism on the secondary market affects the effectiveness of the price stabilization activity of the underwriter. If the lead underwriter cannot achieve its stabilization goal in the aftermarket efficiently, it would underprice the IPO issue to attract investors. Thus, our finding lends support to the longstanding belief that IPOs are deliberately underpriced over reputation concern.
The remainder of the paper is organized as follows. Section II describes the IPO process and the price stabilization practice in Taiwan. Section III discusses the data. Results of empirical analysis are presented in Section IV. Section V concludes.
II. The IPO Process and Price Stabilization Practice in Taiwan
A. The IPO Process
A typical IPO has investment banks in the role of the lead manager and syndicate members who underwrite and distribute the
1 The TSEC has a daily price limit of 7%. Only limit
orders are allowed on the TSEC. To secure matching priority, traders can submit limit orders hitting the daily price limits (limit orders with prices beyond the price limits are not accepted by the computer). This type of price-limit orders can achieve the effect of market orders. For this reason, Taiwanese practitioners call these orders market orders. If market orders are allowed, according to Schwartz (1991), they are equivalent to limit orders written at the highest allowable call price for buy orders and the lowest allowable call price for sell orders.
offering. Initially the offering company has an agreement with the lead manager for it to be the advisor of the underwriting case. The main responsibilities of the advisor generally include conditioning the offering company to meet the regulations with respect to IPO, which entails help set up adequate internal control and accounting procedures, as well as the distributions of the shares to the public. The advisory period cannot be shorter than one year. At the end of the advisory period and after the final due diligence is conducted, the lead manager submits the IPO case for the Securities and Futures Commission for approval. In the submission the underwriting contract, the number of IPO shares, distribution method, and the mechanism through which offering price is determined need to be stipulated. Issuer can choose a firm commitment, best effort, or standby underwriting contract to distribute the IPO shares. Prior to 1988 only best effort and standby agreements were allowed by the Securities Exchange Act (SEA). During that period in practice all IPOs were issued based on best effort contracts. After 1988 with the establishment of full-service securities houses both best effort and firm commitment contracts were used. Although best effort contracts were normally chosen in a bull market, since 1996 all contracts in practice have been firm commitment ones. This is mainly due to the severe competition among securities houses for underwriting cases. The SEA allows three distribution methods for IPO issues— competitive bid auction, lottery, and book building. If the IPO shares are provided by existing shareholders, then the lottery method can be used exclusively, or a combination of the competitive bid auction and lottery methods can be adopted. If the competitive bid auction and lottery methods are used in combination, then exactly 50% of the total IPO shares must be issued through the competitive bid auction. The rest is distributed through the lottery method. The offer price of the lottery is determined by the price obtained in the competitive bid auction,
which is the weighted average of the prices of the accepted bids. Only competitive bids with prices that are above the floor price can be accepted as the valid bids. The floor price is pre-approved by the SFC in its approval of the IPO. The lottery price must fall in the range between the floor price and 1.3 times of the floor price (the ceiling price). If the weighted average of the valid competitive bids exceeds the ceiling price, the lottery price is the ceiling price. Thus, the lead underwriter can set a low floor price to increase the probability of underpricing. Competitive bids with higher bid prices have a higher priority of receiving IPO shares. In the lottery distribution, investors receive shares in a lottery draw in multiples of a round lot (1,000 shares). The minimum number of shares distributed to a winner of the lottery draw is one round lot. No investor can win more than 3% of the shares offered. In the case where the IPO shares are distributed exclusively through the lottery method. The offer price must be approved by the SFC first.
If the IPO involves the issue of new shares, then book building can be the distribution method. In practice almost no IPO cases involve the issue of new shares. During our sample period there is one no such case, which is excluded from our sample.
B. The Price Stabilization Practice
The SEA allows the lead underwriter to conduct price stabilization only in the case of a seasoned offering. The lead underwriter can submit bids with prices below the offering price during a fixed period before the offering starts. There is no stipulation in the regulation for IPOs on the stabilization activities of the underwriters. The proprietary trading department of the underwriting securities firms can purchase the IPO shares on the secondary market. In practice the IPO and the listing for trading of the IPO shares on the TSEC occur simultaneously. Upon the completion of distribution, the IPO shares are listed and traded on the TSEC. There is no third or fourth market in Taiwan. Since there is no
regulation prohibiting the lead underwriter from buying the IPO shares after the offering, the lead underwriter can stabilize the price by buying the shares on the TSEC.
In addition, there are no designated market makers on the TSEC. So the lead underwriter does not become the market maker of the IPO issue. The TSEC is an order-driven market whose liquidity is attributed entirely to the orders submitted by market participants. Chow, Hsu and Tso (2001) show that the bulk of the liquidity on the TSEC is provided by individual investors.
There is no over-allotment option. Before April 2000 the regulation was that the lead underwriter could set aside 15% to 25% of the total issue as inventory. After April 2000 the new regulation requires that the lead underwriter keep 15% to 25% of the total issue as inventory.
Penalty bids are not used in practice. Penalty bids is quite common in the U.S. According to Aggarwal (2000) the purpose of penalty bids is to control flipping or reselling of shares. Each firm that makes up the selling group receives compensation, called the selling concession, for each share it distributes. If the distribution firm’s customers who bought in at the initial offer price sell their shares in the first few days, then penalty bids results in forfeiture of the selling concession received for the distribution of shares that are repurchased by the lead manager in the secondary market because of flipping.
III. Data
We obtain the data about the terms of IPO cases from the SFC, the TSEC, and the ROC Securities and Futures Foundation. The data include the name of the issuer, the date of listing, the number of shares offered, the offer price, the distribution method, and the percentage of investors winning the lottery. We have all (altogether 85) the IPO cases from 1996 to 1999. Table 1 shows the descriptive statistics of them.
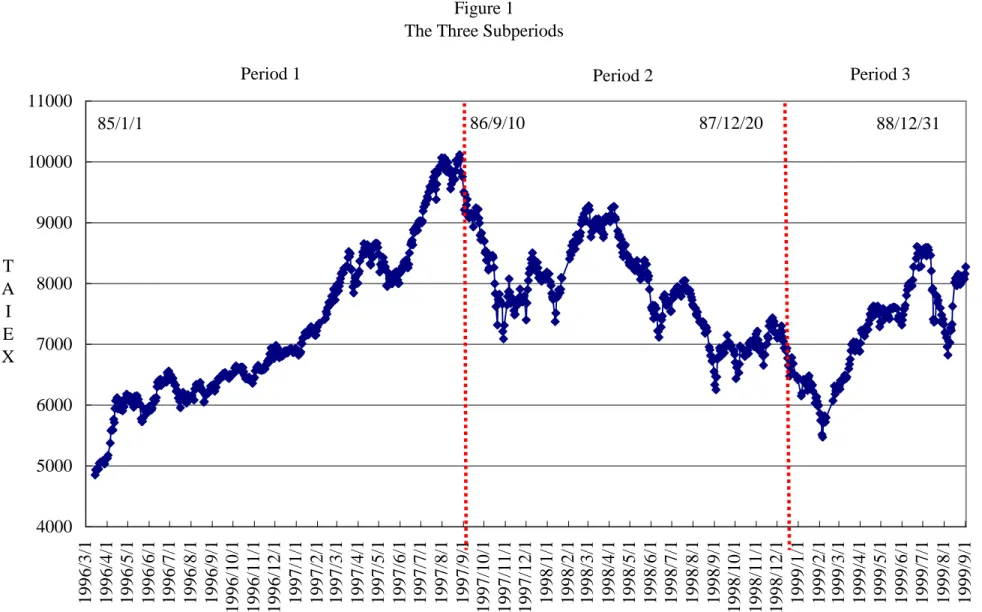
Figure 1 shows the time series of the
Taiwan Stock Exchange Value Weighted Index (TAIEX) for our sample period. We split our sample periods into three sub-periods. The first period can be considered a bull market because the TAIEX generally trends upward, rising from 5,000 points to reach over 10,000 points before taking a down turn. The second period started when the Taiwan’s stock market was affected by the Asian financial crisis that began in the summer of 1997. Period 3 started when Taiwan was pulling out of the shadow of financial crisis.
Table 1 shows that on average every lead underwriter handles more than four IPO cases. Although there are about 60 securities firms that are licensed by the SFC to underwrite IPOs, usually only the bigger ones have the chance to become the lead underwriters. On average, less than 20% of the outstanding shares are offered in IPOs. In a bull market, issue firms tend to use the lottery method more than the combination method for the distribution of shares. The percentage of investors winning the lottery in the lottery method is much higher than that in the combination method, which to some extent reflects the fact that the shares available for lottery in the combination methods are half of those in the pure lottery method.
We also obtain the tick-by-tick transaction and order flow data for the IPO stocks from the TSEC. Since the TSEC is completely automated, the transaction data and order flow data are complete. The orders and transactions are recorded at the time when they occur in the system. Compared to other data sets that have been used in other related researches our data set has a distinctive advantage in respect to its completeness. For example, the transaction data of Aggarwal (2000) include the date and time of each aftermarket short covering transaction, the price at which the shares are bought, the number of shares bought. She does not have the transaction data of other traders or the order flow data. Ellis, Michaely and O’Hara’s (2000) data are quite complete but yet incomplete. They study
NASDAQ IPOs. Their transaction data provide the time, price, and volume for each trade, as well as a code identifying both parties involved and an indicator that identifies buyers and sellers. They have full quote schedules at all times for all of the stocks, with each quote identified by the market maker who set that quote. But they cannot identify all types of investors, neither do they have the order flow of public traders who are not market makers. In contrast, our data set allows us to identify every trader’s identity and to trace his entire trading and order submission history during the sample period.
IV. Empirical Results
A. Initial IPO Returns
Table 2 shows the initial IPO returns of the 85 IPOs in our sample for different lengths of periods immediately after the stocks are listed for trading. The returns are measured as the natural log of (Pt/P0), where Pt is the
close market price on day t after the stock starts trading and P0 is the offer price of the
lottery. There is an underpricing phenomenon.2 For the 1-day return the means and the medians of the initial IPO returns are positive and are much bigger than those of the TAIEX (market) returns measured over the same period.3
The Wilcoxon signed rank test indicates the median of the IPO returns is significantly larger than that of the TAIEX at the 5% level at least, except for the 40-day return in periods 2 and 3. Seventy out 85 IPOs have positive first day returns. The underpricing phenomenon is most pronounced in the first period.
There is a tendency for the initial return to
2 We also calculate the IPO returns for two separate
samples: the IPOs distributed through the lottery method and those distributed through the combination method. The IPO returns of the two methods are similar, although those of the combination method are noticeably larger. The results are available upon request.
3 The medians of TAIEX are not reported in the table,
but are very similar to the means.
reverse. The number of positive IPO returns decreases with time, which is mainly due to periods 2 and 3, especially period 2. Table 2 also shows the number of IPOs whose return over longer periods of time is lower than the 1-day return. This number increases with time, which is mainly caused by the events in periods 2 and 3. Over the 40-day period after the listing of stocks 35 stocks’ return is lower than their 1-day return, while on average the TAIEX return increases over the same period. This indicates that there is an initial excessive optimism about the IPO stocks in the beginning of trading, and it does not seem to be more pronounced in a bull market.
The IPO return is skewed to the left for the period right after the listing, which tapers off with time, then eventually become positive for longer-period returns. There is a tendency for the return to be closer to being normally distributed as the kurtosis measure tends to move in the direction of zero as the measurement period lengthens.
It would be illuminating to compare our results to Ruud’s (1993). To facilitate our comparison we reproduce her Table 2 in the last panel of our Table 2. The mean of our 1-day return is about 1.8% less than Ruud’s, but our median is 4% more than hers, which is due to the fact that our IPO returns are left skewed, while Ruud’s are right skewed. Since the TSEC has a 7% daily price limit, comparing our 5-day return to her one-week return would be less obscured by the price limit on the TSEC. The mean and median of our 5-day returns are much larger than hers. Thus, IPO underpricing in our sample is also quite salient. But our 1-day return is not as leptokurtic as that in Ruud’s sample. Ruud’s have several pieces of evidence to substantiate her hypothesis that underwriter price support plays a role in explaining high average initial IPO returns. Her 1-day returns distribution is quite positively skewed and inordinately peaked at zero. However, our 1-day returns are negatively skewed and less peaked at zero. Figure 2 shows frequency distribution of the IPO returns measured over different trading days.
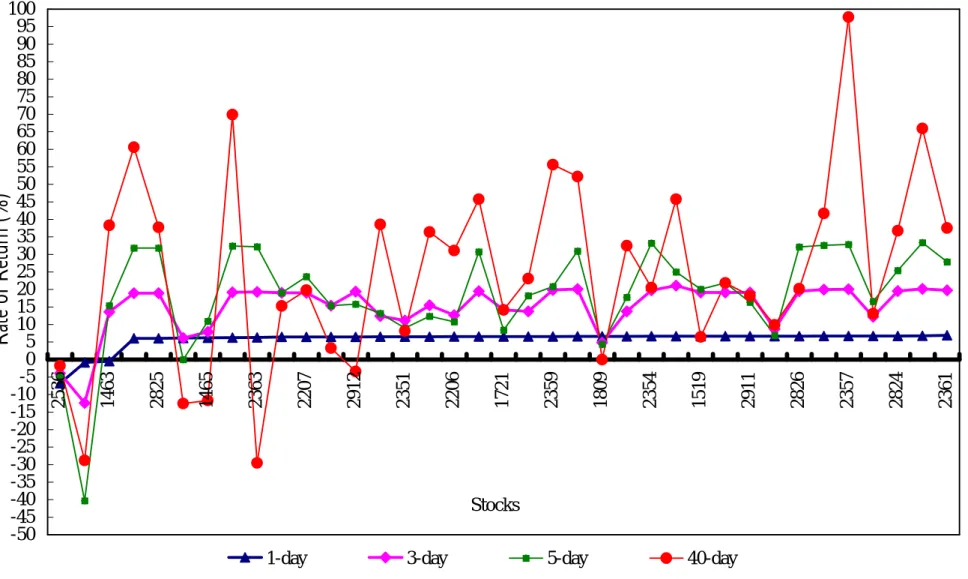
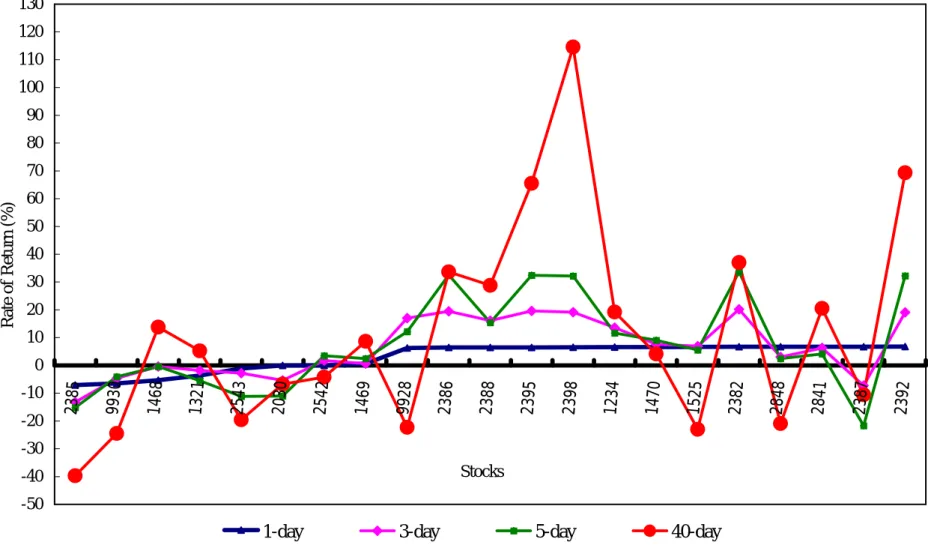
Figures 3A, 3B, and 3C show the pattern of the price performance of Taiwan’s IPOs in the three periods. For Figures 3 we rank the stocks in the order of their one-day price performance on their first day of trading along the horizontal axis (stock numbers are marked). The one-day, three-day, five-day, and 40-day returns of the IPOs are marked on the diagram according to the scale on the vertical axis. Apparently figures 2 and 3 show that returns are not lumped close to zero. In fact, few IPO returns are around zero, they are either quite high or quite low. Ruud also finds that the minimum return drops dramatically from the first day to the first week, while the maximum return remains virtually unchanged from one day to four weeks. We do not observe a similar pattern in the figures.
To sum, we also find underpricing for the IPOs on the TSEC, but the cross-sectional pattern of the IPO returns in our sample is distinct from that in Ruud’s sample. The pattern found by Ruud, according to her, results from the stabilization activities of underwriters. Since our pattern is very different from Rudd’s, it should not be attributed to the price support provided by underwriters. Rather, in the following we show that rarely do lead underwriters trade in the aftermarket.
B. The Stabilization Activities of the Lead Underwriters
Figure 4 shows the number of IPOs on which the lead underwriter buys and/or sells shares on the TSEC over the 40-day period after the initial listing of the stocks. In term of the number of IPOs whose stocks are traded by the lead underwriter, on average on every trading day there are only less than six IPOs. The maximum (minimum) number is 10 (3). Thus, the lead underwriters do not trade actively in the aftermarket.
Table 3 shows the transaction volume of the lead underwriter relative to other institutional traders and individual investors. Clearly the lead underwriter’s trading volume is very insignificant, less than 2% of total trading volume. The lead underwriter tends
to sell on the first trading day more than other days and they buy less than sales. However, the lead underwriter tends to buy more in the bear market (period 2) than in the bull market (period 2). Except for the first trading day, other institutional traders tend to be on the buy side, while individual investors tend to be on the sell side. On the first trading day, individual traders tend to buy, which may be the reason for the initial over shooting of market price. The bulk of trading comes from individual traders who contribute more than 80% of the total trading volume.
Table 4 shows the order flow of the lead underwriter relative to other institutional traders and individual investors. Similar to the trading volume, the lead underwriter’s order flow is very insignificant, less than 2% of the total order flow. The lead underwriter tends to place relatively more buy orders in the bear market (period 2). Other institutional traders also tend to place relatively more buy orders in the bear market, which results in their relatively larger trading volume in the bear market. Individual traders tend to place relatively less buy orders and in the bear market, which results in relatively smaller trading volume in the bear market. Overall, other institutional traders tend to be on the buy side, while individual investors tend to be on the sell side. Individual traders contribute more than 80% of the total order flow.
C. The Trading Behavior of the Lead Underwriter
It is clear that the aftermarket liquidity is provided by individual investors. Since the lead underwriter rarely trades in the aftermarket, one can safely presume that the lead underwriter cannot effectively stabilize the IPO aftermarket price. However, the lead underwriter holds 15-25% of the IPO shares as inventory. For concern over reputation, the lead underwriter may want to be perceived as “responsible” in the sense that it would sell only when the price is rising and that it would buy when the price is declining.
Table 5 shows the results of regressing the order flow of a type of traders relative to the total number of orders on the IPO return (IPO ret.), the percentage of shares offered for IPO (% offer), the percentage of investors winning the lottery (% winning), and the rank of the lead underwriter (uw. Rank). The dependent variable is the order flow of a type of trader to total order flow for the period the IPO return is measured. The rank of the lead underwriter is proxied by the number of IPO cases underwritten by a lead underwriter. The regression is done for different return periods, for different types of traders, and for buy and sell orders separately. The regression is cross-sectional, for the analysis of the trading behavior of the lead underwriter only IPOs for which the lead underwriter participates in the aftermarket trading is included. For the other two types of traders the regression includes all IPOs. The estimated slope coefficient of the IPO return can tell us whehter a type of traders buy (sell) when prices are rising (falling). The relationship between the percentage of shares offered for IPO and the relative order flows would indicate if the supply of shares increase the sell pressure or dampen the demand pressure for the shares. The percentage of winning the lottery indicates the degree of hotness of the new issue. Its estimated slope coefficient should suggest if aftermarket trading is related to how hot an issue is. Finally, if a lead underwriter has more IPO cases than others and it has a greater reputation concern, then tts estimated slope coefficient should be positively associated with its willingness to stabilize the price.
As one can see from Table 5, we do not have clear evidence that the lead underwriter is willing to stabilize the market. On the first trading day it buys when the stock price is rising, a behavior contrary to what price stabilization would predict. However, for longer return horizon, there is evidence that the lead underwriter buys more when the stock price is dropping. On the sell side there is some indication that, the lead underwriter sells when the price is rising.
These results suggest that the lead underwriter did not refrain from selling during the short period immediately after the listing of the stocks for trading, and would sell when the price is rising.
Individual investors, in contrast, are more like trend chasers. They tend to buy when the market is trending upward and sell when the price are falling. However, since they are the primary traders on the market, our results could also indicate that they are responsible for the price trend. However, institutional traders behave more like contrarian traders. They tend to buy when price falls.
Table 5 also indicates that the number of IPO cases handled by the lead underwriter is by and large irrelevant to its trading behavior. The percentage of winning lottery and the percentage of shares offered for IPO do not have any significant effect on the order placing behavior of the lead underwriters and other investors. The regression results would be qualitatively the same excluding the two variables from our regression.
V. Conclusion
This paper shows that IPO underpricing is also a prominent phenomenon in Taiwan. However, it is not a result of the price stabilization effort of the lead underwriter. The lead underwriter trades very sparsely in the aftermarket to the extent that it can at best have minimal effect on the stock price. The aftermarket trading activity of the lead underwriters does not indicate that they have their reputation in their minds when trading in the aftermarket. Thus, the underpricing of IPOs is more likely a result of deliberate arrangement on the part of the underwriter in order to increase the chance of the IPO stock performing well in the aftermarket so that the good reputation of the underwriter can be upheld without its intervention in the aftermarket.
References
activities by underwriters after initial public offerings, Journal of Finance 55, 1075-1103.
2. Ellis, K., R. Michaely and M. O’Hara, 2000, When the underwriter is the market maker: An examination of trading in the IPO aftermarket, Journal of Finance 55, 1039-1074.
3. Hanley, K. W., A. Kumar and P. Seguin, 1993, Price stabilization in the market for new issues, Journal of Financial Economics 34, 177-197.
4. Michaely, R. and K. Womack, 1998, Conflict of interest and the credibility of underwriter analyst recommendations, Review of Financial Studies, forthcoming.
5. Prabhala, N. L. and M. Puri, 1998, How does underwriter price support affect IPOs? Working paper, Yale University. 6. Ruud, J. S., 1993, Underwriter price
support and the IPO underpricing puzzle, Journal of Financial Economics 34, 135-151.
7. Schultz, P. H. and M. A. Zaman, 1994, Aftermarket support and underpricing of initial public offerings, Journal of Financial Economics 35, 199-219.
8. Schwartz, R. A., 1991, Reshaping the equity markets: a guide for the 1990s, Harper Business.
9. Welch, I., 1992, Sequential sales, learning, and cascades, Journal of Finance 47, 695-732
Figure 1 The Three Subperiods
4000 5000 6000 7000 8000 9000 10000 11000 1996/3/1 1996/4/1 1996/5/1 1996/6/1 1996/7/1 1996/8/1 1996/9/1 1996/10/1 1996/11/1 1996/12/1 1997/1/1 1997/2/1 1997/3/1 1997/4/1 1997/5/1 1997/6/1 1997/7/1 1997/8/1 1997/9/1 1997/10/1 1997/11/1 1997/12/1 1998/1/1 1998/2/1 1998/3/1 1998/4/1 1998/5/1 1998/6/1 1998/7/1 1998/8/1 1998/9/1 1998/10/1 1998/11/1 1998/12/1 1999/1/1 1999/2/1 1999/3/1 1999/4/1 1999/5/1 1999/6/1 1999/7/1 1999/8/1 1999/9/1 86/9/10 87/12/20
Period 1 Period 2 Period 3
85/1/1 88/12/31 T A I E X
Figure 2
Frequency Distribution of IPO Returns (Whole Period)
0 10 20 30 40 50 60 70 (45%-40%) (35%-30%) (25%-20%) (15%)-(10%) (5%)-0% 5%-10% 15%-20% 25%-30% 35%-40% 45%-50% 55%-60% 65%-70% 75%-85% 90%-95% 100%-105% 110%-115% Returns Frequency
Figure 3A IPO Returns in Period 1
-50 -45 -40 -35 -30 -25 -20 -15 -10 -5 0 5 10 15 20 25 30 35 40 45 50 55 60 65 70 75 80 85 90 95 100 2536 1463 2825 1465 2363 2207 2912 2351 2206 1721 2359 1809 2354 1519 2911 2826 2357 2824 2361 Stocks
Rate of Return (%)
Figure 3B
IPO Returns in Period 2
-50 -45 -40 -35 -30 -25 -20 -15 -10 -5 0 5 10 15 20 25 30 35 40 45 50 55 60 65 70 75 80 85 1723 2366 2365 1322 1467 2616 2832 2370 2384 1521 2377 1520 1522 2367 2368 2617 2376 2381 1466 2833 2380 2369 9926 1523 2375 2707 Stocks
Rate of Return (%)
Figure 3C IPO Returns in Period 3
-50 -40 -30 -20 -10 0 10 20 30 40 50 60 70 80 90 100 110 120 130 2385 9930 1468 1321 2543 2030 2542 1469 9928 2386 2388 2395 2398 1234 1470 1525 2382 2848 2841 2387 2392 Stocks Rate of Return (%)
Figure 4
The Number of IPOs (out of 85)for which the Lead Underwriter Buys or Sells Shares on the TSEC
0 1 2 3 4 5 6 7 8 9 10 11 1 3 5 7 9 11 13 15 17 19 21 23 25 27 29 31 33 35 37 39
No. of Trading Days after Initial Listing
Table 1
Descr iptive Statistics of IPOs
For the “% Offered” and “% Winning the Lottery”, the numbers in the table are mean figures. The numbers in the parentheses are medians. The numbers in the third column are the percentage of outstanding shares offered in the IPOs. The numbers in the fourth and fifth columns are the percentages of investors winning the lottery in the IPOs that use the lottery method exclusively and that use the combination of the competitive bid auction and the lottery method, respectively. The percentage of IPOs that adopt the lottery method and the combination is shown in the sixth and seventh columns. The last column reports the number of lead underwriters involved in the IPO cases.
% Winning the Lottery No. of IPOs % Offered
Lottery Combination % Lottery % Combination
No. of Lead Underwriters Period 1 (1996.1 ~ 1997.8) 37 15.31% (19.38%) 12.84% (3.93%) 1.93% (1.03%) 64.86% 35.14% 14 Period 2 (1997.9 ~ 1998.12) 26 18.72% (20.00%) 6.33% (6.14%) 2.16% (1.95%) 26.92% 73.08% 10 Period 3 (1999.1 ~ 1999.12) 22 15.69% (18.50%) 40.85% (23.73%) 3.91% (1.70%) 59.09% 40.91% 10 All Periods (1996.1 ~ 1999.12) 85 16.45% (19.53%) 20.08% (6.54%) 2.47% (1.37%) 51.76% 48.24% 20
Table 2
The Initial IPO Retur ns (% ) and Their Descr iptive Statistics
The skewness measure is calculated as the third moment divided by the cube of the standard deviation. A positive figure indicates right skewness. A negative number indicates left skewness. The Kurtosis measure is calculated as the fourth moment divided by the square of the second moment minus 3. It indicates leptokurtic for a value greater than 0, mesokurtic for a value close to 0, and platykurtic for a value less than 0.
Whole period (No. of IPOs = 85)
1-day 3-day 5-day 40-day
Mean 4.445553 10.551360 12.881803 15.575170 Median 6.453852 13.757190 15.415068 13.452478 Std. Dev. 4.218368 10.227763 16.256456 31.720033 Kurtosis 1.919554 -0.206628 0.018255 0.240282 Skewness -1.815873 -0.948569 -0.585329 0.621192 Min -7.224491 -15.665381 -40.296823 -41.551544 Max 6.899287 21.072103 33.647224 114.615323 Mean (TAIEX) -0.017228 -0.030477 -0.383450 2.290219 No. of firms with
positive returns 70 68 66 52
No. of firms whose cumulative return after IPO is smaller than the 1-day returns
15 20 35
Period 1 (No. of IPOs = 37)
1-day 3-day 5-day 40-day
Mean 5.786864 15.042824 18.488986 25.148933 Median 6.541314 19.022674 19.053296 21.868920 Std. Dev. 2.692837 7.192369 14.324716 27.225358 Kurtosis 14.441517 5.655639 6.752608 0.404598 Skewness -3.759914 -2.207978 -1.995336 0.224424 Min -6.776210 -12.405265 -40.296823 -29.511705 Max 6.899287 21.072103 33.384975 97.735099 Mean (TAIEX) -0.235854 0.234881 0.283545 4.132894
No. of firms with
positive returns 34 35 35 31
No. of firms whose cumulative return after IPO is smaller than the 1-day returns
Period 2 (No. of IPOs = 26)
1-day 3-day 5-day 40-day
Mean 3.720835 7.496622 9.137612 4.959070 Median 6.453852 9.743928 5.137400 -4.002135 Std. Dev. 4.802518 11.411987 16.342246 29.868998 Kurtosis 0.849571 -0.767406 -1.301660 0.329003 Skewness -1.499084 -0.632793 0.117039 0.979265 Min -7.224491 -15.665381 -18.805223 -41.551544 Max 6.758409 20.170659 32.583384 78.535337 Mean (TAIEX) 0.154089 -0.230700 -1.225462 -5.936497 No. of firms with
positive returns 20 19 17 9
No. of firms whose cumulative return after IPO is smaller than the 1-day returns
7 9 18
Period 3 (No. of IPOs = 22)
1-day 3-day 5-day 40-day
Mean 2.979563 6.419886 7.638147 11.850854 Median 6.453852 6.295785 4.154376 5.218575 Std. Dev. 5.069248 10.528037 16.978758 37.356822 Kurtosis -0.666828 -1.280681 -0.851081 1.542482 Skewness -0.959520 -0.069165 0.265296 1.171818 Min -7.103577 -13.217177 -21.716297 -39.693021 Max 6.765865 20.212418 33.647224 114.615323 Mean (TAIEX) 0.155862 -0.250119 -0.516138 9.229056
No. of firms with
positive returns 16 14 14 12
No. of firms whose cumulative return after IPO is smaller than the 1-day returns
Table 3
The Relative Tr ading Volume (in the r atio to the total tr ading volume) of Different Types of Tr ader s
“Buy” (“sell”) is the ratio of the shares of buy (sell) transaction to the total number of shares outstanding.
Whole period (No. of IPOs = 85)
1-day 3-day 5-day 40-day
Mean Median Mean Median Mean Median Mean Median
Buy 0.0033 0 0.0049 0 0.0045 0 0.0027 0 Lead Underwriter Sell 0.0377 0 0.0259 0 0.0028 0 0.0033 0 Buy 0.1444 0 0.1958 0.1031 0.2181 0.1378 0.2308 0.1893 Institutions Sell 0.1667 0.0174 0.1295 0.0741 0.1167 0.0755 0.1225 0.0956 Buy 0.8522 1.0000 0.7993 0.8781 0.7773 0.8287 0.7665 0.8107 Individuals Sell 0.7956 0.9668 0.8446 0.9239 0.8804 0.9245 0.8742 0.8982 Period 1 (No. of IPOs = 37)
1-day 3-day 5-day 40-day
Mean Median Mean Median Mean Median Mean Median
Buy 0.0004 0 0.0003 0 0.0014 0 0.0020 0 Lead Underwriter Sell 0.0270 0 0.0322 0 0.0061 0 0.0020 0 Buy 0.1072 0 0.1328 0.0545 0.1855 0.1234 0.2072 0.1812 Institutions Sell 0.2002 0.0167 0.1218 0.0660 0.1208 0.0698 0.1142 0.0956 Buy 0.8925 1.0000 0.8669 0.9455 0.8130 0.8766 0.7909 0.8188 Individuals Sell 0.7728 0.9826 0.8460 0.9192 0.8731 0.9302 0.8839 0.9036 Period 2 (No. of IPOs = 26)
1-day 3-day 5-day 40-day
Mean Median Mean Median Mean Median Mean Median
Buy 0.0095 0 0.0150 0 0.0122 0 0.0041 0 Lead Underwriter Sell 0.0462 0 0.0128 0 0.0000 0 0.0005 0 Buy 0.1877 0 0.2670 0.1536 0.2680 0.2020 0.2828 0.2132 Institutions Sell 0.1241 0.0176 0.1338 0.0724 0.1173 0.0857 0.1365 0.1163 Buy 0.8028 1.0000 0.7180 0.7996 0.7198 0.7830 0.7131 0.7834 Individuals Sell 0.8297 0.9675 0.8533 0.9276 0.8827 0.9143 0.8629 0.8766 Period 3 (No. of IPOs = 22)
1-day 3-day 5-day 40-day
Mean Median Mean Median Mean Median Mean Median
Buy 0.0010 0 0.0004 0 0.0007 0 0.0023 0 Lead Underwriter Sell 0.0455 0 0.0307 0 0.0006 0 0.0088 0 Buy 0.1544 0.0161 0.2149 0.0998 0.2140 0.0891 0.2092 0.1762 Institutions Sell 0.1608 0.0371 0.1372 0.0854 0.1092 0.0705 0.1198 0.0764 Buy 0.8447 0.9839 0.7847 0.8960 0.7853 0.9036 0.7885 0.8238 Individuals Sell 0.7938 0.9363 0.8321 0.9106 0.8902 0.9295 0.8713 0.9227
Table 4
The Or der Flow (in the r atio to the total or der flow ) of Different Types of Tr ader s “Buy” (“sell”) is the ratio of the shares of buy (sell) orders of a particular type of traders to the total number of buy orders.
Whole period (No. of IPOs = 85)
1-day 3-day 5-day 40-day
Mean Median Mean Median Mean Median Mean Median
Buy 0.0048 0 0.0039 0 0.0035 0 0.0021 0 Lead Underwriter Sell 0.0376 0 0.0238 0 0.0030 0 0.0024 0 Buy 0.1736 0.0610 0.1905 0.1054 0.2086 0.1494 0.2169 0.1859 Institutions Sell 0.1140 0.0068 0.1147 0.0603 0.1191 0.0789 0.1344 0.1041 Buy 0.8216 0.9345 0.8055 0.8921 0.7879 0.8451 0.7810 0.8141 Individuals Sell 0.8483 0.9879 0.8615 0.9243 0.8779 0.9145 0.8632 0.8824 Period 1 (No. of IPOs = 37)
1-day 3-day 5-day 40-day
Mean Median Mean Median Mean Median Mean Median
Buy 0.0035 0 0.0012 0 0.0010 0 0.0016 0 Lead Underwriter Sell 0.0270 0 0.0326 0 0.0066 0 0.0020 6.1810 Buy 0.0961 0.0475 0.1228 0.0614 0.1519 0.0896 0.1884 0.1871 Institutions Sell 0.1325 0 0.1045 0.0508 0.1297 0.0745 0.1301 0.1020 Buy 0.9004 0.9400 0.8760 0.9386 0.8471 0.9082 0.8100 0.8129 Individuals Sell 0.8405 1 0.8629 0.9426 0.8637 0.9244 0.8679 0.8976 Period 2 (No. of IPOs = 26)
1-day 3-day 5-day 40-day
Mean Median Mean Median Mean Median Mean Median
Buy 0.0103 0 0.0110 0 0.0093 0 0.0032 0 Lead Underwriter Sell 0.0462 0 0.0055 0 0.0002 0 0.0005 0 Buy 0.2531 0.0906 0.2785 0.1777 0.2870 0.2037 0.2854 0.2140 Institutions Sell 0.0902 0.0153 0.1318 0.0932 0.1244 0.1029 0.1490 0.1401 Buy 0.7366 0.8611 0.7105 0.7742 0.7037 0.7764 0.7114 0.7730 Individuals Sell 0.8636 0.9561 0.8627 0.9068 0.8754 0.8971 0.8504 0.8557 Period 3 (No. of IPOs = 22)
1-day 3-day 5-day 40-day
Mean Median Mean Median Mean Median Mean Median
Buy 0.0003 0 0.0002 0 0.0007 0 0.0015 0 Lead Underwriter Sell 0.0455 0 0.0305 0 0.0004 0 0.0051 0 Buy 0.2101 0.0813 0.2005 0.1177 0.2113 0.1171 0.1840 0.1214 Institutions Sell 0.1111 0.0288 0.1116 0.0779 0.0949 0.0690 0.1245 0.0802 Buy 0.7896 0.9171 0.7993 0.8810 0.7879 0.8820 0.8145 0.8782 Individuals Sell 0.8434 0.9526 0.8578 0.9221 0.9047 0.9310 0.8704 0.8917
Table 5
The Tr ading Behavior of Different Types of Tr ader s
The followings are the results of regressing the order flow of a type of traders relative to the total number of orders on the IPO return (IPO ret.), the percentage of shares offered for IPO (% offer), the percentage of investors winning the lottery (% winning), and the rank of the lead underwriter (uw. Rank).
Institutions Lead underwriter Individuals Buy
1-day 3-day 5-day 40-day 1-day 3-day 5-day 40-day 1-day 3-day 5-day 40-day IPO ret. -0.02243 (0.3318) -0.00730 (0.0023)*** -0.01070 (0.0892)* -0.00423 (0.0270)** 0.04061 (0.0039)*** -0.00149 (0.0559)* -0.00080 (0.6321) -0.00024 (0.0413)** 0.01386 (0.5484) 0.00760 (0.0014)*** 0.01078 (0.0851)* 0.00428 (0.0248)** % offer -0.41551 (0.0964)* -0.19652 (0.3284) -0.27898 (0.1577) -0.32214 (0.0576)* 0.54053 (0.0628)* 0.02056 (0.8353) 0.05602 (0.4852) -0.01154 (0.1413) 0.39531 (0.1138) 0.18900 (0.3418) 0.27607 (0.1596) 0.32760 (0.0531)* % winn. -0.20403 (0.4843) -0.10713 (0.6493) -0.08865 (0.7024) 0.02949 (0.8785) -0.29392 (0.2392) -0.19261 (0.2491) -0.05186 (0.7172) 0.01512 (0.1036) 0.21858 (0.4542) 0.12711 (0.5854) 0.10345 (0.6538) -0.04265 (0.8246) Uw. Rank 0.00018 (0.9626) -0.00065 (0.8348) -0.00042 (0.8917) -0.00013 (0.9581) -0.00001 (0.9965) 0.00109 (0.2960) 0.00104 (0.2317) 0.00042 (0.0255)** -0.00033 (0.9314) 0.00035 (0.9090) 0.00011 (0.9707) 0.00005 (0.9850) Adj. R2 -0.0015 0.0853 0.0142 0.0379 0.7946 0.1590 -0.032 0.2150 -0.0098 0.0954 0.0145 0.0409 N 84 84 84 84 10 19 23 42 84 84 84 84 Institutions Lead underwriter Individuals
Sell
1-day 3-day 5-day 40-day 1-day 3-day 5-day 40-day 1-day 3-day 5-day 40-day IPO ret. 0.01624 (0.4030) -0.00082 (0.6200) 0.00703 (0.0710)* -0.00022 (0.8571) -0.09353 (0.4923) 0.00884 (0.0518)* 0.00130 (0.5918) 0.00007 (0.7437) -0.01872 (0.4443) -0.00132 (0.5470) -0.00743 (0.0766)* 0.00014 (0.9107) % offer 0.15549 (0.4561) 0.13471 (0.3429) 0.15508 (0.2030) -0.06441 (0.5602) 1.54561 (0.6651) 0.63972 (0.2746) 0.24560 (0.0438)** -0.00721 (0.5920) -0.02751 (0.9166) -0.09586 (0.6123) -0.17413 (0.1850) 0.06672 (0.5449) % winn. -0.06957 (0.7763) 0.26458 (0.1145) 0.26318 (0.0689)* 0.14406 (0.2583) -0.97457 (0.7726) 0.11487 (0.9036) -0.08326 (0.6875) -0.00247 (0.8761) 0.08018 (0.7951) -0.24048 (0.2803) -0.25596 (0.1002) -0.14463 (0.2548) Uw. Rank 0.00676 (0.0386)** 0.00111 (0.6133) -0.00050 (0.7924) -0.00111 (0.5063) -0.03248 (0.3557) -0.01220 (0.0546)* -0.00174 (0.1697) -0.00008 (0.8003) -0.00431 (0.2905) 0.00072 (0.8042) 0.00074 (0.7162) 0.00120 (0.4710) Adj. R2 0.0232 0.0025 0.0428 -0.0237 -0.3633 0.1824 0.0784 -0.0866 -0.0267 -0.0277 0.0364 -0.0223 N 84 84 84 84 10 19 23 42 84 84 84 84