Pressure-induced effect on the light reflection
of cholesteric liquid crystals using the finite element method
Jiun-Yeu Chen1, Jia-Yi Yeh2,1Center for General Education, Hsing Kuo University of Management
2Department of Information Management,Chung Hwa University of Medical Technology.
E-mail : [email protected]
Abstract
Bragg reflections of cholesteric liquid crystals were investigated by the finite element method (FEM). The Galerkin FEM formulations and the absorbing boundary conditions are adopted. The number of chiral pitches required for establishing the Bragg reflection was calculated. Two models for the relationships between the applied pressure and the pitch of a cholesteric liquid crystal (CLC) were simulated: one is the linear model of the relative maximum reflection wavelength proportional to the reduced pressure, and the other is the model introduced by Pollamnn and Stegemeyer. In each case, the effect of pressure-induced changes in the peak of the reflection wavelength is demonstrated. The concept of pressure sensing performed on the CLCs is discussed and was simulated numerically. CLCs can be applied to measure for a required range of pressure.
Keywords: Cholesteric liquid crystal, finite element method, pressure effect.
1. Introduction
The optical properties of cholesteric liquid crystals(CLCs) have been extensively studied and are of great interest for display applications [1,2]. Three major textures of CLCs sandwiched between two parallel glass plates are planar, focal conic and homeotropic. In the planar texture, CLCs possess unique optical properties associated with a special helical of nematic layers. The chiral structure exhibits a periodic refractive index of the material and the spatial period is equal to half of the pitch length Z0. Because of the periodic structure, the incident light with the same circular
polarization as the cholesteric screw is strongly reflected and another circular polarization is transmitted. The Bragg reflection occurs at a wavelength given by the Bragg formula
λ
0 =nZ0, where n is the average refractive index. The spectral width of the reflection peak depends on the birefringence and the chiral arrangement of liquid crystal molecules [2−6].The effects of the temperature and the static pressure on the helical structure of CLCs are well known [4−8]. In most CLCs, the pitch is a decreasing function of the temperature (dZ/dT<0) .The pressure induces the raise of the transition temperature so that the pitch may be expected to increase accordingly [9]. The temperature dependence of the pitch has practical applications in thermography [4]. Although the temperature can strongly affect the optical properties of CLCs, other kinds of thermal behavior such as dZ/dT≈0 and dZ/dT>0 are also possible, especially in induced chiral nematic liquid crystals [10]. A CLC pressure sensing device was proposed [11,12]. The effect of the pressure-induced changes at the peak of the light-reflection wavelength can be observed in CLCs. By choosing suitable materials with a low thermal sensitivity, the polarization effects caused by strong rotary power of CLCs can depend on the pressure only.
To analyze the light propagation in anisotropic stratified media, Jones matrix or the Berreman 4×4 matrix method can be utilized to calculate the reflection of a cholesteric liquid crystal. For obliquely incident light, the Berreman 4×4 matrix method is recommend [2]. The Berreman method treats each stratified layer as homogeneous. If the medium is a chiral structure, the layer will be divided into many thin slices so that the director orientation varies slightly in the slice. The calculation time will increases as the thickness of the medium. Besides, it is difficult to solve two-dimensional or three-dimensional problems. In this paper, the finite element method (FEM) is utilized to investigate the Bragg reflection properties of CLCs [13]. The FEM is recognized as a general method widely applicable to engineering and mathematical problems. The FEM with the advantage of easy convergence in the spatial domain can be easily developed to solve the problems which analytical solutions are difficult to be obtained in optical simulations. Even though the medium is still separated into a lot of elements, the parameter element matrices of the differential equation in the FEM are sparse and can be treated with an efficient method to reduce the calculation time greatly.
The pressure dependence of the pitch is considered to be caused by two relationships. One of the relationships between the relative maximum reflection wavelength
λ
R,p /λ
R,1 and the reduced pressure is linear, and the other is the form proposed by Pollmann and Stegemeyer [8]. The Galerkin FEM is applied to analyze the reflection bandwidth of the two modes with various parameters.∞ p p /
2. Analytical Model and Calculation Method
2.1. Finite element formulations
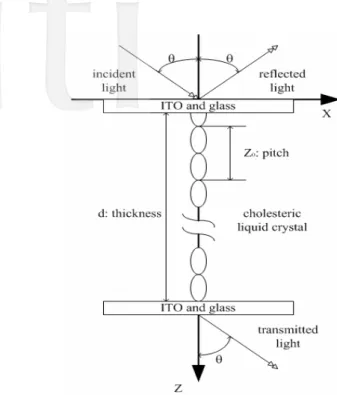
To simulate the reflection spectra of CLCs, a simple optical model shown in Fig. 1 is solved by the FEM. The chiral structure has a pitch length Z0. The helical axis of the cholesteric liquid crystal is parallel to z-axis and the
dielectric tensor may be expressed as [14]
⎥ ⎥ ⎥ ⎦ ⎤ ⎢ ⎢ ⎢ ⎣ ⎡ = ) ( ) ( ) ( ) ( ) ( ) ( ) ( ) ( ) ( ) ( 33 32 31 23 22 21 13 12 11 z z z z z z z z z z
ε
ε
ε
ε
ε
ε
ε
ε
ε
ε
, (1) where ⊥ ⊥ ⊥ ⊥ ⊥ ⊥ = = ⎟⎟ ⎠ ⎞ ⎜⎜ ⎝ ⎛ − = ⎟⎟ ⎠ ⎞ ⎜⎜ ⎝ ⎛ − − + = ⎟⎟ ⎠ ⎞ ⎜⎜ ⎝ ⎛ − + + =ε
ε
ε
ε
π
ε
ε
β
ε
π
ε
ε
ε
ε
ε
π
ε
ε
ε
ε
ε
) ( ) ( ) ( 4 sin ) ( 2 1 ) ( 4 cos ) ( 2 1 ) ( 2 1 ) ( 4 cos ) ( 2 1 ) ( 2 1 ) ( 33 21 12 0 || 12 0 || || 22 0 || || 11 z z z z P z z P z z P z .Fig. 1. The model of the cholesteric structure for simulations.
Here and are the dielectric constants perpendicular and parallel to the liquid crystal director, respectively. β=1 is right-hand screw sense and β=-1 is left-hand. In an isotropic medium such as the glass,
and ) ( 2 0 0 =n
ε
( 2) ⊥ ⊥ = nε
2 33 22 11(z)=ε
(z)=ε
(z)=nε
ε
21(z)=ε
12(z)=0, where n is the refractive index of the medium. Because the dielectric tensor varies only in the z direction, the electric field and the magnetic field of the light can be expressed in only two independent components each. The Berreman equations can be derived from Maxwell’s equations [2]:2 0 2 0 33 0 2 0 21 0 22 2 0 0 0 11 12 0 0
1
0
0
0
1
0
0
0
( )
1
0
0
0
0
Ψ
Ψ
x xk
k
jk
k
jk Q z
z
k
η
ε
η
ε
ε
η
η
ε
ε
η
η
⎡
⎛
⎞
⎤
−
⎢
⎜
⎟
⎥
⎝
⎠
⎢
⎥
⎢
⎥
⎢
⎥
∂
=
⎢
⎛
⎞
∂
⎢
⎜
−
⎟
⎥
⎝
⎠
⎢
⎥
⎢
−
−
⎥
⎢
⎥
⎢
⎥
⎣
⎦
Ψ
=
⋅
⎥
, (2)where
η
0 =μ
0/ε
0 =377Ω is the impedance of a vacuum. For an incident light with wavelength λ and anoblique angle θ relative to z axis, the wavenumber is k0 =2
π
λ
and its component in the x-directionis
k
x=
n
xk
0sin
θ
.Ψ
=
(
E
xE
yH
xH
y)
Tand Q(z) are the Berreman vector and matrix:⎥ ⎥ ⎦ ⎤ ⎢ ⎢ ⎣ ⎡ = 0 0 ) ( E H Q Q z Q . (3)
The differential equation for E can be obtained by eliminating H. The wave equation for
E
=
(
E E
x,
y)
T is 0 0 1 0 E E -1 H E d d Q k Q dz k dz ⎛ ⎞ + ⎜ ⎟ ⎝ ⎠ = . (4)Galerkin’s method [15] is used to formulate the finite element equations, the weight residual integral for the eth element can be written as
3 1 0 0
1
1 2 3
R
E
E
e e z -1 e e i z i H Ed
d
N
Q
k Q
dz
i
dz k
dz
⎛
⎛
⎞
⎞
=
⎜
⎜
⎜
⎟
+
⎟
⎟
⎝
⎠
⎝
⎠
∫
=
, , .
e (5)The electric field intensity of the element e is represented as the following equation: 3 1
( )
E
e eE
j j jN z
==
∑
, (6)where
E
ej are the unknown electric field intensities at the node j of element e and denote the basis functions given by( )
e jN z
2 3 1 1 2 1 3 1 3 2 2 1 2 3 1 2 3 3 1 3 1 ( )( ) ( ) ( )( ( )( ) ( ) ( )( ( )( ) ( ) ( )( e e e e e e e e e e e e e e e e e e e e e ) ) ) z z z z N z z z z z z z z z N z z z z z z z z z N z z z z z ⎧ = − − ⎪ − − ⎪ ⎪ − − ⎪ = ⎨ − − ⎪ ⎪ − − ⎪ = − − ⎪⎩ . (7)Integrating Eq. (5) by parts and using Eq. (6) for E, the elemental equation is obtained:
3 3 1 1 3 0 1 0 0
1
1
E
R
E
e e e e z e e z -1 j -1 e e i e e e i j z i j i H E H j zdN
dN
d
Q
k Q N N dz
Q N
k
dz dz
k
dz
=⎛
⎞
=
⎜
⎜
−
+
⎟
⎟
+
⎝
⎠
∑ ∫
. (8)Writing Eq. (8) in matrix form, it becomes
{ }
e e{ } { }
e eR
=
⎡
⎣
K
⎤
⎦
E
−
g
. (9)By summing Eq. (9) over all elements, the global finite element equation is given by
{ } { }
(
1 1{ }
{ }
M M e e e e e)
eR
R
K
E
g
= =⎡
⎤
=
∑
=
∑
⎣
⎦
−
, (10)where M is the total number of elements. The Eq. (10) is rewritten as
[ ]
K E
{ } { }
=
g
, (11)where
[ ]
K
is a diagonal matrix. The electric field intensities can be obtained by solving Eq. (11). The finite element solutions are valid through the whole region containing CLCs, indium tin oxide (ITO) film and the glass.2.2. Boundary condition
The absorbing boundary condition is used in the FEM model to solve the scattering problems. The electromagnetic wave can be written as
E A
=
e
−jk zz , (12)where A is a constant vector. An approximate boundary condition can be obtained as
E
jk
zE
z
∂
≈ −
∂
, (13)which is called the first-order absorbing boundary condition [15]. The model of the cholesteric structure is shown in Fig. 1. The total wave at the boundary
z z
=
0 isE E
=
i+
E
r, (14)where the incident wave is
E
(
0,
0)
z T jk z ix y
E
E
e
−=
, and the reflected wave is(
0,
0)
E
r T jk zzx y
E
E
e
−= Γ
,where is the reflection coefficient. The electric field E in Eq. (13) is replaced by .Then using from Eq. (14), the boundary condition at
Γ
E
rE
r= −
E E
i 0z z
=
can be expressed as 0 02
E
E
E
i z z z z z z z zI
jk I
jk
z
= = =∂
−
= −
∂
0 , (15)where
I
is a 2×2 unity matrix. There is no reflection at the boundary z=zn.the total wave isE E
=
t. (16)Utilizing the same process as that provided at z=z0, the boundary condition at z=zn can be given by
0
E
E
n z z z z zI
jk I
z
= =∂
+
∂
n=
. (17)2.3. Reflectance and transmittance
The reflectance and the transmittance can be calculated by [2]
(
)
(
)
(
)
(
)
2 2 2 2 2 2 2 2cos
cos
cos
cos
r r x y i i x y t t x y i i x yE
E
E
E
E
E
E
E
θ
θ
θ
τ
θ
+
Γ =
+
+
=
+
, (18)where the reflected and transmitted electric field can be obtained from Eq. (14) and (16). The reflectance and the transmittance of TE and TM waves can be solved as [13]
(
)
(
) (
)
(
)
(
) (
)
2 2 2 2 2 2 2 2 2 2 2 2cos
cos
cos
cos
cos
cos
r i i TE y x y r i TM x x y t i i TE y x y t i TM x x yE
E
E
E
E
E
E
E
E
E
θ
θ
θ
τ
θ
τ
θ
θ
⎡
⎤
Γ =
⎢
+
⎥
⎣
⎦
⎡
⎤
Γ
=
⎢
+
⎥
⎣
⎦
⎡
⎤
=
⎢
+
⎥
⎣
⎦
⎡
⎤
=
⎢
+
⎥
⎣
⎦
i iE
E
. (19)3. Simulation results and discussions
3.1. Validate the accuracy of the FEM
The 4×4 matrix method is a well known method for the computation of light propagation in liquid crystals. The results obtained by the FEM are compared with those by the 4×4 matrix method. The simulated Bragg reflection spectra calculated by the 4×4 matrix method and the FEM are shown in Fig. 2 for the cases of the normal and oblique incidence. The results of the presented FEM are shown to have very good agreement with those of the 4×4 matrix method. The Bragg reflection is centered at λ0=518 nm with about 60 nm bandwidth for the normal incidence, and is centered at
about 506nm for the 20° oblique incidence. The central wavelength and the bandwidth of the Bragg reflection at the normal incidence can be given by [2]
0 0 0
nZ
nZ
λ
λ
=
⎧
⎨Δ = Δ
⎩
, (20)where
Δ
n
is the birefringence of the liquid crystal,Z
0 is the pitch of the CLC, and is the average refractive index defined byn
(
)
2 22
2n
=
n
&+
n
⊥3
. (21)(a)
(b)
Fig. 2. Comparison of the Bragg reflection between the FEM and the 4×4 matrix method: (a) normal incidence; (b) oblique incidence at 20°. CLC:
Z
0=
310
nm,Δ =
n
0.2
,n
e=
1.8
andd
=
8
Z
0.At a Θ oblique angle incidence, the central wavelength of the Bragg reflection is governed by 0
cos
nZ
λ
=
Θ
, (22)where Θ can be given by Snell’s law as
(
1 1
sin
−n
−sin
θ
)
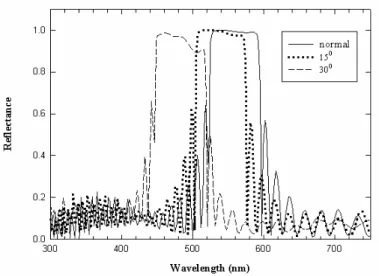
Θ =
, (23)where θ is the incident angle outside the CLCs. The relationship between the angle Θ and the central wavelength of the Bragg reflection is shown in Fig. 3. When the angle Θ is increased, the reflection band is shifted to a shorter wavelength. The oblique incidence is responsible for the blue shift [2].
Fig. 3. The blue shift of the Bragg reflection. The glass substrates and the ITO layer are included in the simulation. The interference from the interfaces between the air and the glass is neglected. CLC:
Z
0=
330
nm,Δ =
n
0.2
,and .
1.8
e3.2. Establishment of Bragg reflection
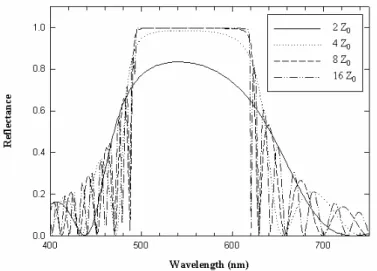
The effect of the CLC layer thickness on the reflectivity of a perfect planar texture is considered. The right-circular polarized light is incident normally to the CLC structure. The FEM simulation results of the Bragg reflection are presented in Fig. 4. It is seen that a minimum thickness is needed to establish the Bragg reflection. The Bragg reflection is established for the thickness larger than 8Z0 in the present case. The circularly polarized light with a rotational sense
equal to the liquid crystal helices will be strongly reflected.
Fig. 4. The establishment of the Bragg reflection for a CLC film at normal incidence. CLC: nm,
and . 0
310
Z
=
0.4
n
Δ =
n
e=
2
3.3. Pressure dependence of the CLC structure
The effects of the pressure on the chiral structure of the CLCs are discussed. Two approaches are presented in the present studies. The interference from the interfaces between the air and the glass is neglected. The chiral structure of CLCs is assumed to be independent of the temperature such as dZ/dT≈0, and the central wavelength of the Bragg reflection is linearly dependent on the pressure:
, , ,
1
R R p R Rp
p
p
,1λ
∞λ
λ
∞λ
∞ ∞−
−
=
−
−
, (24)where
λ
R,1 denotes the reflection wavelength at the pressure p=1 bar. Whenλ
R,p approaches infinity, denotes the limiting pressure and the reflection wavelength is∞ p ∞
, R
λ
. The reduced expression(
, ,1
R p R
f p p
)
λ
λ
=
∞ can be derived from Eq. (24):, , , ,1 ,1 ,1
1
1
R p R R R R Rp
p
λ
λ
λ
λ
λ
λ
∞ ∞ ∞⎛
⎞⎛
⎞
=
+ −
⎜
⎜
⎟⎜
⎟⎝
−
⎠
⎝
⎠
⎟
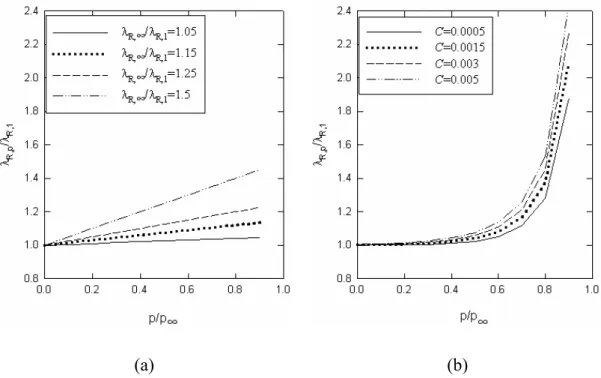
. (25)The relationship between the relative reflection wavelength
λ
R,p/λ
R,1 and the reduced pressure is plotted in Fig. 5(a). The other approach is the expression proposed by Pollmann and Stegemeyer [8]∞ p p /
, (1 ) ,1
1
1
R p p p RC
λ
λ
=
−
− ∞ , (26)where C the same as
λ
R,p /λ
R,1 in the linear model is determined from the experimental data. The theoretical curves according to Eq. (26) are sketched in Fig. 5(b).(a) (b)
Fig. 5. Dependence of the relative maximum reflection wavelength
λ
R p,λ
R,1on the reduced pressurep p
∞ : (a) the linear model; (b) Pollmann’s model.The effect of the reduced pressure on the reflection response for the normal incidence is shown in Fig. 6. The solutions of the linear model for a specified value
λ
R,∞/λ
R,1 are plotted in Fig. 6(a). The spectra of the Braggreflection responding to the various reduced pressure is shown, and the results present a remarkable increase of the reflection wavelength with the increasing pressure. The Bragg reflection of Pollmann’s model for a specified parameter C is presented in Fig. 6(b). The lower reduced pressure under the value 0.4 reveals little influence on the variation of the Bragg reflection wavelength. At higher reduced pressure over 0.4, a notable variation of the reflection spectra is shown. In each model, the increase of the pitch due to the applied pressure is responsible for the strong red-shift.
∞ p p /
(a)
(b)
Fig. 6. Simulated spectra of the Bragg reflection responding to the reduced pressure
p p
∞ for (a) the linear model (λR,∞ λR ,1=1.5) and (b) Pollmann’s model (C=0.005). CLC:Z
0=
310
nm,Δ =
n
0.2
,n
e=
1.8
andd
=
16
Z
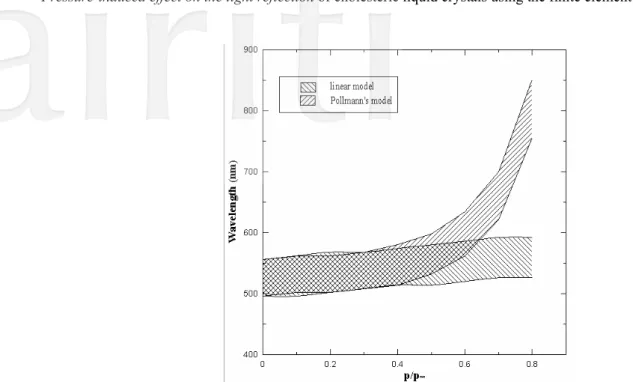
0.In Fig. 7, the Bragg reflection bandwidth against the reduced pressure for the normal incident light is compared by the two models. If the nonlinear optical responses of the CLCs due to the pressure can be approached by Pollmann’s model, the results of Fig. 7 show the limitation of the linear model as the reduced pressure exceeds 0.4. The linear behavior of a material due to the external action is much easier to be controlled and predicted than the nonlinear one. The physical properties of liquid crystals in the linear optics are not affected by the optical field, but the optical responses under the applied field (temperature, pressure, electric filed, etc.) are nonlinear. It is limited to utilize the linear model to describe the Bragg reflection shift due to the applied pressure. If the optical responses of the CLCs are considered the linear behavior, the limitation to the range of the applied pressure must be noticed.
Fig. 7. Simulated spectrum band of the Bragg reflection responding to the reduced pressure
p p
∞ for the linear model (λR,∞ λR ,1=1.085 ) and Pollmann’s model ( C=0.005 ). CLC:Z
0=
310
nm,Δ =
n
0.2
,n
e=
1.8
and. 0
16
d
=
Z
3.4. Pressure sensing
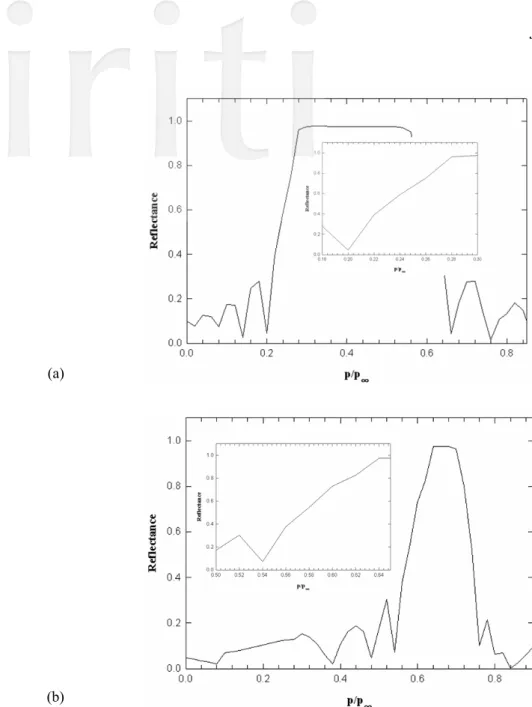
The striking features of the refractive indices of nematic liquid crystals are dependent on the temperature [3]. The thermal index gradients ( and ) become extraordinarily large near the phase transition temperature. The CLCs utilized to be a sensing element should be controlled in the appropriate temperature range to maintain the birefringence character. Also, the CLCs must be chosen suitably with a significantly reduced thermal sensitivity to insure the change of the pitch will be dependent on the applied pressure only. For the linear model with a specified relative maximum reflection wavelength, Fig. 8(a) reveals the reflectance against the reduced pressures corresponding to the specified wavelength at 632.8 nm. It is assumed that the pitch is independent of temperature. There is a quasi-linear relationship between the reflectance and the reduced pressure in the certain range (0.2−0.28) of pressure. For Pollmann’s model with a specified parameters C, Fig. 8(b) also shows a quasi-linear relationship between the reflectance and the reduced pressure in the certain range (0.54−0.64) of pressure. Both of the models can assure a good linear response for specific ranges of the reduced pressure. If the limiting pressure is higher, the range of the real pressure p is wider in the linear region. Besides, if the specified wavelength is changed, the range of the linear relationship will be shifted to another region against the different reduced pressure. The potential of using CLCs as a pressure sensing element can be clearly demonstrate in the study. The selection in the different combination of CLCs and the specified light source can be applied to measure different pressure ranges. The working temperature, the film thickness, and an appropriate choice of the CLC material also need to be noticed when designing the CLC sensing elements.
dT
dn /⊥ dn /0 dT
∞ p
(a)
(b)
Fig. 8. Light reflection at 632.8 nm vs. the reduced pressure
p p
∞ for (a) the specified relative maximum reflection wavelength λR,∞ λR,1=
1.5
in the linear model and (b) the specified parameter C=0.005 in Pollmann’s model.CLC:
Z
0=
310
nm,Δ =
n
0.2
,n
e=
1.8
andd
=
16
Z
0.4. Conclusions
The Bragg reflections of CLCs have been investigated by the Galerkin FEM. The finite element modeling of a chiral structure has been introduced. For the establishment of Bragg reflection, the required film thickness of a cholesteric liquid crystal has been calculated. In order to simulate the variety of the reflection peak due to the pressure, two approaches have been analyzed. The Bragg reflection spectra responding to the reduced pressure have been discussed with the linear model and Pollmann’s model. The constraints of the linear model to describe the nonlinear optical responses of CLCs have been studied. If CLCs are utilized to sense the static pressure with a specified light source, both of the models show a good linear response between the reflection intensity and the reduced pressure in the certain range of pressure. With the appropriate choice of CLCs, it is believed that the CLC pressure sensor can be constructed.
Reference
[1] Yang D.K., Doane J.W., Yaniv Z. and Glasser J., “Cholesteric reflective display: Drive scheme and contrast,”Applied Physics Letters, Vol. 64, pp. 1905-1907, 1994.
[2] Wu S.T. and Yang D.K., “Reflective Liquid Crystal Displays,” Wiley, New York, 2001.
[3] Khoo I.C. and Wu S.T., “Optics and Nonlinear Optics of Liquid Crystals,” World Scientific, Singapore, 1993. [4] Chandrasekhar S., “Liquid Crystals,” Cambridge University Press, Cambridge, 1992.
[5] De Gennes P.G. and Prost J., “The Physics of Liquid Crystals,” Oxford University Press, Oxford, 1993. [6] Blinov L.M., “Electro-Optics and Magneto-Optical Properties of Liquid Crystals,” Wiley, New York, 1983.
[7] Pindak R.S., Huang C.C. and Ho J.T., “The intrinsic pitch of cholesteryl nonanoate,” Solid State Communications, Vol.14, No.9, pp. 821-825, 1974.
[8] Pollmann P. and Stegemeyer H., “Pressure dependence of the helical structure of cholesteric mesophases,” Chemical Physics Letters, Vol.20, No.1, pp. 87-89, 1973.
[9] Heyes P.H., Weston H.T. and Dameils W.B., “Tricritical Behavior in a Liquid-Crystal System,“ Physical Review. Letters, Vol.31, pp. 628-630, 1973.
[10] Woliński T., “Calorific Effect of the Magnetically Induced Phase Transition in Induced Chiral Nematic Systems,” Molecular Crystals & Liquid Crystals, Vol.162B, pp. 171-183, 1988.
[11] Woliński T.R. and Bock W.J., “Cholesteric Liquid Crystal Sensing of High Hydrostatic Pressure Utilizing Optical Fibers,” Molecular Crystals & Liquid Crystals, Vol. 199, pp. 7-17, 1991.
[12] Woliński T.R., Jarmolik A. and Bock W.J., “Development of fiber optic liquid crystal sensor for pressure measurement,“IEEE Transactions on Instrumentation and Measurement, Vol. 48, pp. 2-6, 1999.
[13] Hong Q., Wu T.X. and WU S.T., “Optical wave propagation in a cholesteric liquid crystal using the finite element method,”Liquid Crystal, Vol. 30, pp. 367-375, 2003.
[14] John W.D.S., Fritz W.J., Lu Z.J. and Yang D.K., “Bragg reflection from cholesteric liquid crystals,“ Physical Review E, Vol. 51, pp. 1191-1198, 1995.