行政院國家科學委員會專題研究計畫 期中進度報告
自組成氮化銦鎵量子點研究(1/3)
計畫類別: 整合型計畫
計畫編號: NSC92-2120-M-002-006-
執行期間: 92 年 08 月 01 日至 93 年 07 月 31 日
執行單位: 國立臺灣大學光電工程學研究所
計畫主持人: 楊志忠
共同主持人: 楊哲人,江衍偉,林浩雄,綦振瀛,張玉明,馬廣仁
報告類型: 精簡報告
報告附件: 出席國際會議研究心得報告及發表論文
處理方式: 本計畫可公開查詢
中 華 民 國 93 年 5 月 7 日
Abstract:
The results of photoluminescence (PL), detection-energy-dependent photoluminescence excitation (DEDPLE), excitation-energy -dependent photoluminescence (EEDPL), and strain state analysis (SSA) of three InGaN/GaN quantum-well (QW) samples with silicon doping in the well, barrier and an undoped structure are compared. The SSA images show strongly clustering nanostructures in the barrier-doped sample and relatively weaker composition fluctuations in the undoped and well-doped samples. Differences in silicon doping between the samples give rise to the differences in DEDPLE and EEDPL spectra, as a result of the differences in carrier localization. Also, the PL results provide us clues for speculating that the S-shape PL peak position behavior is dominated by the quantum-confined Stark effect in an undoped InGaN/GaN QW structure.
Temperature-dependent fsec pump-probe experiments are performed to explore the ultrafast carrier-relaxation processes in an InGaN/GaN quantum-well sample, in which nm-scale cluster structures have been identified. Combining with the time-resolved photo- luminescence results, we can identify three stages of carrier relaxation. The fast-decay time, ranging from several hundred fs to one ps, corresponds to the process reaching a local quasi-equilibrium condition, in which carriers reach a thermal distribution within one or a few nearby indium-rich clusters. The slow-decay time, ranging from tens to a couple hundred ps, corresponds to the process reaching a global quasi-equilibrium condition, in which carriers reach a thermal distribution among different clusters of various potential minima. In this stage, the mechanism of carrier transport over barriers between clusters dominates the relaxation process. Finally, carrier recombination dominates the relaxation process with the carrier lifetime in the range of a few ns.
Summary
Nanostructures and Carrier Localization Behaviors of Green-luminescence InGaN/GaN Quantum-well Structures of Various
Silicon-doping Conditions
Silicon doping in InGaN/GaN quantum wells (QWs) has been widely used in fabricating high performance light emitting devices. Silicon doping has been reported to affect many properties of InGaN/GaN QWs, including the growth mode change, the microstructure (through the formation of quantum dots (QDs)), the interface abruptness, the photoluminescence (PL) intensity, the uniformity of the potential in the well, the strain relaxation, and the screening of piezoelectric field. However, most previous studies of silicon doping effects focused on the samples emitting violet-blue photons. Silicon-doped InGaN/GaN QWs of higher nominal
indium contents, leading to green light emission, were rarely investigated. Also, the nanostructures and their implications in radiative mechanisms of such silicon-doped samples, emitting either violet-blue or green light, have not been well studied yet. Usually, it is difficult to grow uniform InGaN alloy, particularly with high indium contents. This is so due to the solid phase immiscibility and phase separation between GaN and InN, which originate from their large lattice constant mismatch.
In this part of research, we conduct the comparisons of nanostructure and related optical characteristics between green-emitting InGaN/GaN QW samples of the same geometry and composition, but different silicon doping conditions. Three samples of no doping, well doping, and barrier doping were prepared for comparisons. Detection- energy-dependent photoluminescence excitation (DEDPLE) and excitation-energy-dependent photoluminescence (EEDPL) measurements show different variation trends of absorption spectrum and PL spectral peak position, respectively. Such trends can be well interpreted with the observations of strain state analysis (SSA), based on a high-resolution transmission electron microscopy technique.
The three InGaN/GaN QW samples of different doping conditions were prepared with MOCVD growth on sapphire (0001) substrate. They all consisted of five QW periods, with 2.5 nm in well width and 7.5 nm in barrier width, on top of an un-doped GaN buffer layer of 1.52 µm in thickness. The growth temperatures were 1100 and 800 oC for the GaN barriers and InGaN wells, respectively. The doping concentration of silicon was 5 x 1018 cm-3,
either in barriers or wells. The samples with un-doped, well-doped and barrier-doped conditions were denoted with HU, HW, and HB, respectively. The nominal indium contents of the three samples are the same at 20 %.
Figs. 1(a) and (b) show the temperature -dependent variations of PL spectral peak and normalized integrated PL intensity, respectively, of the three samples. From part (a), one can see the blue shift of sample HB when compared with samples HU and HW. Only sample HU generates a clear S-shape variation. As shown in Fig. 1(b), the radiative efficiency of sample HB is higher than those of the other two samples. Such results are quite similar to what we have reported previously with the samples emitting violet photons. Barrier-doped samples always result in higher optical quality. Fig. 2 shows the PL and DEDPLE spectra of the three samples at 10 K. The DEDPLE spectra were normalized to the level at 3.5 eV (GaN absorption peak). One can see that in sample HU, the luminescence intensity level of the InGaN absorption band decreases with increasing detection photon energy. However, the opposite variation trend is observed in sample HW. Meanwhile, almost the same absorption spectra, when the detection photon energy is varied, are
measured in sample HB. Such major differences imply the significant variations in sample nanostructure upon silicon doping of different conditions. Fig. 3 shows the EEDPL spectral peak positions as functions of excitation photon energy for the three samples. In sample HU, the EEDPL spectral peak maintains almost constant when carriers are excited in InGaN. That of sample HW increases with decreasing excitation energy. However, the opposite trend is observed in sample HB.
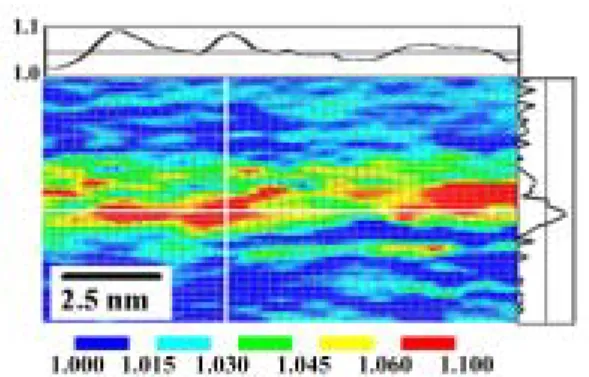
Figs. 4-6 show typical SSA images of samples HU, HW, and HB, respectively. In these SSA images, line scans were conducted along the shown white lines. Here, the line scan values 1 and 1.1, respectively, represent indium compositions of 0 and 60 % (estimated based on the assumption of a specimen thickness larger than 30 nm). Different colors stand for various ranges of indium composition, as shown in the legends. As shown in Fig. 4 for sample HU, although the QW interface is blurred, indium is basically confined within the well. Here, within the well a few spots of indium aggregation can be observed. From the line-scan results, one can observe quite a weak fluctuation in indium composition either along the well layer or in the growth direction. The fluctuation contrast (the difference between the maximum and minimum in the scan range) is around 0.03 along the QW layer. Then, in Fig. 5 for sample HW, the QW is not as well shaped as sample HU. The indium composition fluctuations in both directions are relatively stronger in comparing with sample HU. In particular, more indium-aggregated clusters can be observed within the well layer. The fluctuation contrast is now around 0.045 along the QW layer. As shown in Fig. 6, the SSA image of sample HB shows quite a different nanostructure from the other two samples. Here, the QW layer becomes unclear. Instead, a distribution of clusters of different sizes and shapes exists. The indium composition fluctuation (the contrast is now around 0.075 along the QW layer) is much stronger than those of the other two samples, implying stronger carrier localization for effective recombination.
In Fig. 2(a), the DEDPLE signal intensity decreases with increasing detection photon energy in sample HU. This trend can be attributed to the relatively weaker potential fluctuation in this sample. With such an energy level distribution, photo-generated carriers in higher energy levels can easily transport to the absolute potential minimum for recombination within a certain region. Hence, when the detection photon energy is low, most carriers can contribute to photon emission. When the detection photon energy is higher, fewer carriers can actually recombine at this relatively higher energy level and hence the DEDPLE signal becomes weaker. In this situation, PL spectral peak is always located at the absolute potential minimum and is independent of the excitation level, as shown in Fig. 3. On the
other hand, in sample HW the potential fluctuation becomes relatively stronger. In particular, more clusters are formed in the designated QW layers (see Fig. 5). In this situation, it requires certain amount of energy and hence is more difficult for carriers to transport from a local minimum to another of a deeper level. Therefore, the majority of photo-generated carriers can be trapped by local minima of relatively higher energy. When the detection photon energy is high, stronger DEDPLE signals are recorded, as shown in Fig. 2(b). In this case, as the excitation energy becomes lower in the EEDPL measurement, more carriers can actually be trapped in local potential minima of relatively higher levels such that the PL spectral peak energy increases with decreasing excitation energy, as shown in Fig. 3. Then, in sample HB, because of the strongly clustering structure with an island-by-island configuration (see Fig. 6), when carriers are generated at high InGaN energy levels, they can transport directly into individual potential minima without a cascading relaxation process. In this situation, carrier distributions after relaxation among shallow and deep potential minima can be quite even such that the DEDPLE signal intensity is almost independent of the detection photon energy. Also, as the excitation photon energy decreases, the local potential minima of relatively lower levels can collect more carriers and hence the EEDPL peak position decreases.
Carrier localization and quantum-confined Stark effect (QCSE) have been the two major mechanisms for explaining the S-shape behavior of temperature dependent PL spectral peak position. However, it is still unclear which one dominates under a certain condition. With the results above, one can speculate that upon silicon doping in wells or barriers, the QCSE is reduced, due to strain relaxation and/or carrier screening, and the S-shape behavior disappears in samples HW and HB (see Fig. 1). This argument actually implies that the usually observed S-shape behavior can be dominated by the QCSE. On the other hand, carrier localization can be the key to the blue shift and radiative efficiency improvement, particularly in the barrier-doped sample. The similar nanostructures of samples HU and HW explain well their close PL spectral peak positions, particularly below 150 K, and their close integrated PL intensity curves. The stronger carrier localization in sample HB does result in higher radiative efficiency. This result may imply that carrier localization is more effective in blue-shifting luminescence and improving radiative efficiency of a sample, when compared with the relaxation of QCSE.
In summary, we have compared the results of PL, DEDPLE, EEDPL, and SSA of three InGaN/GaN QW samples with un-doped, well-doped, and barrier-doped structures. The SSA images showed strongly clustering nanostructures in the
barrier-doped sample and relatively weaker composition fluctuations in the undoped and well-doped samples. Such variations in nanostructure resulted in different carrier transport processes that well explained the DEDPLE and EEDPL observations. Also, the PL results provided us clues for speculating that the S-shape PL peak position behavior is dominated by the QCSE in an undoped InGaN/GaN QW structure. However, carrier localization is more effective in blue-shifting luminescence and improving radiative efficiency of a sample, when compared with the relaxation of QCSE. 0 50 100 150 200 250 300 10-2 10-1 100 (b) N o rmal iz ed I n tensit y Temperature (K) HU HW HB 2.30 2.35 2.40 2.45 2.50 2.55 (a) P hot o n E nergy (eV ) HU HW HB
Fig. 1 (a) Temperature-dependent PL spectral peak positions, and (b) integrated PL intensities of the three samples. 2.0 2.5 3.0 3.5 4.0 4.5 0 1
(c)
PLE PL HBExcitation Energy (eV)
2.340 eV 2.514 eV 2.611 eV 0 1
(b)
PLE PL HWN
o
rm
aliz
ed Int
ensi
ty
2.175 eV 2.394 eV 2.505 eV 0 1 PL PLE 2.175 eV 2.380 eV 2.465 eV 660 550 440 330(a)
HUWavelength (nm)
Fig. 2 PL and DEDPLE spectra of the three samples. The eV values shown are the detection photon
energies. 2.5 3.0 3.5 4.0 2.37 2.38 2.39 2.40 2.41 2.42 2.50 2.52 2.54 Wavelength (nm) EEDPL pe ak posi ti o n (e V)
Excitation Energy (eV)
HU HW HB
500 450 400 350
Fig. 3 EEDPL spectral peak positions as functions of excitation photon energy of the three samples.
Fig. 4 A typical strain-state analysis (SSA) image of the undoped InGaN/GaN quantum well sample HU. The color legend indicates the estimated indium mole fractions (1.0 = 0 %, 1.1 = 60 %).
Fig. 5 A typical strain-state analysis (SSA) image of the well-doped InGaN/GaN quantum well sample HW.
Fig. 6 A typical strain-state analysis (SSA) image of the barrier-doped InGaN/GaN quantum well sample HB.
Carrier Relaxation in InGaN/GaN Quantum Wells with nm-scale Cluster Structures
InGaN/GaN quantum-well (QW) structures have been widely used for blue-green light-emitting devices. Due to the large lattice mismatch between InN and GaN, indium-rich aggregation usually occurs in InGaN, leading to the formation of nm-scale clusters and hence potential fluctuations. Carriers, once generated, are trapped in the localized states of potential minima and recombine effectively. The cluster structure is the key to the efficient emission in such a compound. Normally, cluster structures with well-defined potential minima, such as those in a sample of barrier doping with silicon, result in higher emission efficiency. Because the information of carrier relaxation in such a sample can help us in understanding better its nanostructure and hence the recombination process, an ultrafast pump-probe study is useful for the development of related devices. Although a temperature-dependent fs pump-probe experiment on InGaN/InGaN QWs of low indium contents was reported, no cluster-related phenomena were mentioned. So far, insufficient effort was made for the study of cluster-related carrier dynamics in InGaN.
In this part, we report the results of temperature-dependent fs pump-probe experiments on an InGaN/GaN QW sample. By combining the results of ps-scale time-resolved photoluminescence (TRPL) measurement, we can identify different time scales of carrier relaxation process. The sample consists of five periods of QW with 2.5 nm In0.15Ga0.85N wells and 10 nm GaN barriers. The
details of sample structure and growth condition can be found in. Cluster structures in the nm-scale have been identified in this sample with high-resolution transmission electron microscopy. In the pump-probe experiment, a 76 MHz, 100 fs Ti:sapphire laser,
pumped with a Nd:YVO4 laser, was frequency
doubled through a 0.5 mm thick BBO crystal. The second-harmonic pulses were split into two beams for degenerate, non-collinear, and cross-polarized pump-probe measurements. A half-wave plate and
two polarizers were used to minimize coherent
artifacts. The 1-µm stepping resolution of the
computer-controlled translation delay stage accounts for 7 fs step size in the time domain. Pump photon energies at 2.98 and 3.14 eV were chosen, as explained in the following, with average powers at 12 and 32 mW (4.96 and 13.2 µJ/cm2), respectively.
The sample was back-side polished to guarantee effective transmission of the probe beam. Fig. 1 shows the photoluminescence (PL) and photoluminescence excitation (PLE) spectra at 10 K. At around 3.14 eV, there is an absorption peak in the PLE spectrum. Also, near 2.98 eV, the PLE intensity reaches its minimum before it rapidly increases as the photon energy falls into the PL spectral range. We choose these two photon energies for pumping the sample (see the arrows in Fig. 1).
In Fig. 2, we show the differential transmission,
∆T/T, as functions of time at various sample
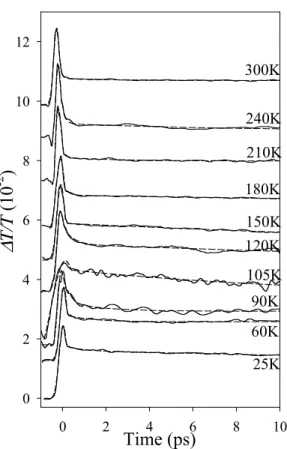
temperatures when the pump-probe photon energy is 2.98 eV. One can see that in each temporal trace, after the pump pulse, differential transmission decays with time first quite fast in the fs range, followed by a slower ps-scale decay. Traces in Fig. 2 show the temperature-dependent variations of the fast-decay speed and relative level of the slow-decay range. The decay behavior around 105 K is quite different from those at lower or higher temperatures. In particular, oscillations in the slow-decay range can be clearly seen. Such oscillations are supposed to be due to the existence of coherent acoustic phonons.
To explore the decay phenomena, we evaluated the ratio of differential transmission of the level in the slow-decay range (we used the value at 4 ps to represent this level) over that of the peak. The results are shown in the curve with filled triangles in Fig. 3. The vertical line segments represent the error bars, which were obtained from 10 times measurements. Also shown in Fig. 3 is the curve with filled circles for the PL spectral peak position as a function of temperature. The PL spectral peak position shows a typical S-shape variation, which is a key feature of a clustering structure, indicating the effect of carrier localization. In Fig. 3, it is interesting to observe that when the sample is pumped with photon energy of 2.98 eV, a peak of transmission ratio exists around 105 K, at which the PL spectral peak starts to show the significant blue shift trend. Based on the observation, we can build a model as follows: At low temperatures (< 105 K), the pump photon energy is far above the peak level of carrier thermal distribution. In this situation, once carriers are generated, in the process of approaching the quasi-equilibrium condition, carriers move rapidly into the states of lower levels. Therefore, after the fast decay, the carrier density at the pump energy level is low. When temperature increases to a certain level (around 105 K in this sample), the peak level of carrier thermal distribution is raised to become close to the pump energy level. In this situation, plenty of
carriers stay in the levels close to the pump energy during the relaxation process of approaching a quasi-equilibrium condition. Therefore, the transmission ratio shown in Fig. 3 reaches a maximum around 105 K. Beyond this temperature, the phonon effect (leading to band gap shrinkage in increasing temperature) gradually dominates and the peak level of carrier distribution moves below the pump energy level. Hence, the transmission ratio essentially decreases with temperature.
To obtain the carrier decay times, we used a model of double-exponential variation, convolved with a Gaussian function (the pump pulse), to fit the measured data, as illustrated by the dashed curves in Fig. 2. With such fitting, the fast- and slow-decay times were obtained, as plotted in Fig. 4. One can see that the fast-decay times (filled circles) are in the range from 700 fs to 1 ps. It generally decreases with temperature with a shallow maximum around 105 K. On the other hand, the slow-decay times (open circles) range from 50 to 200 ps with a general increasing trend with temperature. A minimum around 105 K can be clearly seen. In Fig. 4, we also show the carrier lifetimes, which were obtained with TRPL measurement by using a streak camera of about 4 ps in temporal resolution. They were calibrated from the ns-scale decay of PL intensity when the sample was excited with 100 fs pulses at 3.14 eV. These decay times are in the range of a few ns and correspond to the carrier lifetime in the recombination process. In the TRPL measurement, a faster decay with decay time in the ps range was also observed. This ps-scale decay, corresponding to the open-circle data in Fig. 4, has been attributed to the carrier transport process among potential minima of different levels. With such observations, we can speculate that the fast-decay times in Fig. 4 describe the carrier relaxation process toward a quasi-equilibrium condition in a localized region (within one or a few nearby clusters). Because the sample has a structure between 2-D and 0-D, a quasi-continuous state distribution still exists. Hence, carrier redistribution among different states for a local quasi-equilibrium condition dominates carrier dynamics in this time range. Such a process becomes faster as temperature increases, as clearly described in Fig. 4. After this stage, carriers significantly transport to neighboring clusters of higher or lower potential minima, reaching a global quasi-equilibrium condition. This process takes an average time of about 100 ps, which is consistent with our previous calibrations based on the TRPL measurement. At the temperature (around 105 K) where the PL spectral peak shows a significant blue shift, such a relaxation process becomes faster because carriers are supposed to move into the energy states close to the pump level. In this transport process, carriers need to gain certain thermal energy for overcoming the barriers between neighboring clusters. After the transport stage,
electrons with the global quasi-equilibrium condition will eventually relax back to the valence band with a time scale of carrier lifetime.
With pump at 3.14 eV, the transmission ratios are shown as the curve with filled squares in Fig. 3. In this situation, the peak around 105 K, like that in the case of 2.98 eV pump, disappears. The result is attributed to the fact that the pump energy is far above the peak level of thermal carrier distribution, even with the blue-shift trend of PL spectral peak beyond 105 K. The fitted fast- and slow-decay times in the case of 3.14 eV pump are shown in Fig. 5. The results are similar to those in Fig. 4 although the decay times with 3.14 eV pump are slightly shorter. It has been pointed out that the carrier transport process through overcoming a variety of barrier heights should follow a power-law behavior in time evolution. However, because our measurement time range (~ 10 ps) represents only a small portion of the whole slow-decay process, it is difficult to exactly calibrate its time dependence.
In summary, we have performed temperature- dependent, fs pump-probe experiments to explore the ultrafast carrier-relaxation processes in an InGaN/GaN QW sample, in which nm-scale cluster structures have been identified. Combining with the TRPL results, we could identify three stages of carrier relaxation. The fast-decay time, ranging from several hundred fs to one ps, corresponded to the process toward a local quasi-equilibrium condition, in which carriers reached a thermal distribution within one or a few nearby clusters. The slow-decay time, ranging from tens to a couple hundred ps, corresponded to the process toward a global quasi-equilibrium condition Finally, the mechanism of carrier recombination dominated the process with the carrier lifetime in the range of a few ns.
Energy (eV) 2.6 2.8 3.0 3.2 3.4 3.6 3.8 4.0 4.2 In ten sity (a .u .) 0.0 0.2 0.4 0.6 0.8 1.0 1.2 Pump PL PLE 10 K
Fig. 1 PL and PLE spectra at 10 K. The used pump photon energies are indicated with arrows.
Time (ps)
0 2 4 6 8 10∆
T/
T
(1
0
-2)
0 2 4 6 8 10 12 25K 90K 105K 300K 120K 60K 240K 210K 180K 150KFig. 2 Time evolution of differential transmission at various sample temperatures when the pump energy is 2.98 eV. Temperature (K) 0 50 100 150 200 250 300 PL pe ak e ne rgy ( eV) 2.80 2.81 2.82 2.83 2.84 2.85 2.86 Tr an sm is sion r atio ( % ) 0 20 40 60 80 100 2.98 eV 3.14 eV
Fig. 3 Temperature-dependent variations of PL spectral peak and transmission ratios at two pump energies. Temperature (K) 0 50 100 150 200 250 300 Ca rr ie r li fe time ( ns) 2.4 2.6 2.8 3.0 3.2 3.4 3.6 3.8 4.0 D ec ay time ( ps) 10-1 100 101 102 103
Slow decay time
Carrier lifetime
Fast decay time
Fig. 4 Temperature-dependent variations of the fast-
and slow-decay times and the carrier lifetime when the pump energy is 2.98 eV.
Temperature (K) 0 50 100 150 200 250 300 De cay t im e (ps) 10-1 100 101 102 103
Fast decay time Slow decay time
Fig. 5 Temperature-dependent variations of the fast- and slow-decay times when the pump energy is 3.14 eV.
Related Publication List:
1. Hsiang-Chen Wang, Shih-Jiun Lin, Yung-Chen Cheng, C. C. Yang, and Kung-Jen Ma, “Carrier Relaxation in InGaN/GaN Quantum Wells with nm-scale Cluster Structures”, under revision for publication in Applied Physics Letters. (SCI) 2. Yung-Chen Cheng, Cheng-Ming Wu, Meng-Kuo
Chen, C. C. Yang, Zhe-Chuan Feng, Gang Alan Li, Jer-Ren Yang, Andreas Rosenauer, and Kung-Jen Ma, “Improvements of InGaN/GaN Quantum Well Interfaces and Radiative Efficiency with InN Interfacial Layers,” accepted for publication in Applied Physics Letters. (SCI) 3. Yung-Chen Cheng, En-Chiang Lin, Cheng-Ming
Wu, C. C. Yang, Jer-Ren Yang, Andreas Rosenauer, Kung-Jen Ma, Shih-Chen Shi, L. C. Chen, Chang-Chi Pan and Jen-Inn Chyi, “Nanostructures and Carrier Localization Behaviors of Green-luminescence InGaN/GaN Quantum-well Structures of Various Silicon-doping Conditions,” accepted for publication in Applied Physics Letters. (SCI) 4. Shih-Wei Feng, Tsung-Yi Tang, Yen-Cheng Lu,
Shi-Jiun Liu, En-Chaing Lin, C. C. Yang, Kung-Jen Ma, Ching-Hsing Shen, L. C. Chen, J. Y. Lin and H. X. Jiang, “Cluster Size and Composition Variations in an InGaN Thin Film of Yellow Emission upon Thermal Annealing,” accepted for publication in J. Applied Physics. (SCI)
5. Yung-Chen Cheng, S. Jursenas, Shih-Wei Feng, C. C. Yang, Cheng-Ta Kuo, and Jian-Shihn Tsang, “Impact of Post-growth Thermal Annealing on Emission of InGaN/GaN Multiple Quantum Wells,” Phys. Stat. Sol. (a), Vol. 201, no. 2, pp. 221-224, 2004. (SCI)
6. Shih-Wei Feng, Yung-Chen Cheng, En-Chiang Lin, Hsiang-Chen Wang, C. C. Yang, Kung-Jen Ma, Ching-Hsing Shen, L. C. Chen, K. H. Kim, J. Y.
Lin, and H. X. Jiang, “Thermal Annealing Effects on the Optical Properties of High-indium InGaN Epi-layers,” Physica Status Solidi (c), No. 7, pp. 2654-2657, 2003. (SCI)
7. S. Juršėnas, S. Miasojedovas, G. Kurilčik, A. Žukauskas, Shih-Wei Feng, Yung-Chen Cheng, C. C. Yang, Cheng-Ta Kuo, and Jian-Shihn Tsang, “Quantum-well Thickness Dependence of Stimulated Emission in InGaN/GaN Structures”, Physica Status Solidi (c) 0, No. 7, pp. 2610-2613, 2003. (SCI)
8. Yung-Chen Cheng, En-Chiang Lin, Shih-Wei Feng, Hsiang-Chen Wang, C. C. Yang, Kung-Jen Ma, Chang-Chi Pan, and Jen-Inn Chyi, “Characteristics of amplified spontaneous emission of high indium content InGaN/GaN quantum wells with various silicon doping conditions”, Physica Status Solidi (c) 0, pp. 2670-2673, 2003. (SCI)
9. Shih-Wei Feng, En-Chiang Lin, Tsung-Yi Tang, Yung-Chen Cheng, Hsiang-Chen Wang, C. C. Yang, Kung-Jen Ma, Cheng-Hsing Shen, L. C. Chen, K. H. Kim, J. Y. Lin and H. X. Jiang, “Thermal Annealing Effects of an InGaN Film with an Avearge Indium Mole Fraction of 0.31,” Applied Physics Letters, Vol. 83, No. 19, pp. 3906-3908, November 2003. (SCI)
10. Yung-Chen Cheng, Shih-Wei Feng, En-Chiang Lin, C. C. Yang, Cheng-Hua Tseng, Chen Hsu and Kung-Jeng Ma, “Quantum Dot Formation in InGaN/GaN Quantum Well Structures with Silicon Doping and Its Implication in the Mechanisms of Radiative Efficiency Improvement,” Physica Status Solidi (c) 0, No. 4, pp. 1093-1096, 2003. (SCI)
11. Yi-Yin Chung, Yen-Sheng Lin, Shih-Wei Feng, Yung-Chen Cheng, En-Chiang Lin, C. C. Yang, Kung-Jen Ma, Hui-Wen Chuang, Cheng-Ta Kuo and Jian-Shihn Tsang, “Quantum Well Width Dependencies of Post-growth Thermal Annealing Effects of InGaN/GaN Quantum Wells,” J. Applied Physics, Vol. 93, No. 12, pp. 9693-9696, 2003. (SCI)