A surface acoustic wave sensor modified from a wireless transmitter
for the monitoring of the growth of bacteria
Ku-Shang Chang
a,b,∗, Chen-Kai Chang
a,c, Chien-Yuan Chen
a,∗∗aDepartment of Biochemical Science and Technology & Graduate Institute of Microbiology and Biochemistry, National Taiwan University, Taipei, Taiwan bDepartment of Food Science & Graduate Institute of Biotechnology, Yuanpei University of Science and Technology, Hsinchu, Taiwan
cDepartment of Food Science and Technology, Chia Nan University of Pharmacy and Science, Tainan, Taiwan Received 15 June 2006; received in revised form 26 January 2007; accepted 6 February 2007
Available online 11 February 2007
Abstract
This work presents a novel surface acoustic wave (SAW) sensor for the measurement of the microbial count in a biological culture. The signal translation interface of the sensor was modified using a common commercial wireless SAW transmitter design. A pair of conductive electrodes was inserted in a 314.5 MHz SAW stabilized oscillator of the transmitter. Measurements were made by placing the electrodes within the culture solution of interest and measured the time required to identify readily detectable frequency changes (detection time, DT). The change of frequency was caused by the impedance change of the microbial metabolism. The calibration curve of detection times against density of Escherichia coli shows a linear correlation coefficient (R2= 0.924) over the range of 102to 107cells/mL. A sample that contains 102cells/mL of E. coli required a detection times (DT) of 7 h, shorter than was required using instruments based on conventional conductance methods. The proposed ultra high frequency SAW sensor (314.5 MHz) shows a large total frequency change and gives a sharp inflexion at the DT but possesses the same stability compared with that of low frequency serial piezoelectric quartz crystal (PQC) sensor for the measurement of bacteria concentration. This sensor platform enabled real time monitoring of bacterial growth within a sealed opaque container. This sensor is potentially applicable to a remote query wireless measurement in hazardous environments when a suitable antenna device is adapted.
© 2007 Elsevier B.V. All rights reserved.
Keywords: Surface acoustic wave; SAW; Escherichia coli; Bacterial growth
1. Introduction
Conventional microbiological methods for determining bacteria counts are time-consuming, taking up to 2 days. Addi-tionally, a large number of tests lead to great expense due to labor, material costs, and huge storage costs in the food industry. As a result, various rapid methods have been developed for the deter-mination of bacteria counts in the past several decades, including ATP estimations[1], direct epifluorescent filter technique[2], amperometric biosensing method[3], immuno-biosensor assays
[4], and electrical methods[5,6]. This work presents an
ultra-∗Corresponding author. Tel.: +886 3 5381183x8483; fax: +886 3 5385353. ∗∗ Corresponding author at: Department of Biochemical Science and Technol-ogy & Institute of MicrobiolTechnol-ogy and Biochemistry, National Taiwan University, No. 1, Sec. 4, Roosevelt Road, Taipei 106, Taiwan. Tel.: +886 2 23630231x3256; fax: +886 2 23661696.
E-mail addresses:[email protected](K.-S. Chang), [email protected](C.-Y. Chen).
high frequency surface acoustic wave (SAW; 314.5 MHz) sensor for the measurement of the microbial count in a biological cul-ture. This type of acoustic biosensor could potentially offer a simple, low-cost and robust (repeatable) way to assay bacterial loads in complex liquids [7]. The availability of an ultra-high frequency also enables the design of wireless remote control functions. The ATP method and epifluorescent filter method are fast but complicated for handling. Strong electrochemical inter-ference from oxidisable species in the media exposes a serious problem for the practical operation of amperometric biosensors. The immuno-biosensor assays encounter non-specific adsorp-tion of protein during measurement. Electrical methods are simple but require expensive instruments. Impedance micro-biology[8] was one of the earliest electrical methods for the detection of bacteria in foods, and has been developed as a rapid method that can detect bacteria within 24 h[9,10]. It is based on the measurement of changes in electrical impedance of a medium or a reaction solution resulting from the growth of bacteria. The growth of microbial populations in culture changes the electrical
0925-4005/$ – see front matter © 2007 Elsevier B.V. All rights reserved. doi:10.1016/j.snb.2007.02.007
properties of the culture medium. Substrates in microbiological growth media are generally uncharged or weakly charged. They are normally transformed into highly charged end products fol-lowing the organism’s normal metabolic pathways. Thus the electrical properties of the test medium will change during the growth of bacteria[9,11]. Simple examples include the conver-sion of glucose from a non-ionized substrate to two molecules of lactic acid with a corresponding increase in conductivity. Typi-cally, changes in the electrical properties of the culture medium resulting from bacterial growth become detectable when the microbial density reaches 106to 107cells/mL[12,13]. The time
required to identify readily detectable changes (detection time, DT) provides an approximate measure of the number of micro-bial organisms in the initial inoculums[14].
Two types of measurement techniques have proved use-ful in commercial applications: conductivity and impedance
[5,15,16]. Devices based on these techniques monitor microbial metabolism in growth medium by immersing electrodes directly into the medium and measuring the permittivity and/or conduc-tivity[17]. The impedance method was approved as an official method for the detection of Salmonella in foods by the Asso-ciation of Analytical Communities (AOAC)[6]. Despite their widespread application, these techniques have many disadvan-tages including polarization of the probe electrodes, decreased sensitivity of the device in more conductive media and the high cost of the instruments[18]. Alternatively, surface acoustic wave (SAW) resonator impedance systems appear very attractive because they work at very high frequency[19], and thus elec-trode polarization is eliminated. Surface acoustic wave (SAW) resonator transmitters have been widely used for unlicensed applications for more than a decade. Applications include: auto-motive keyless entry, door and gate openers, wireless alarm sensors, bar code reader, and many others in wireless remote control, security and transmission areas. The SAW resonator stabilized oscillator provides a very stable fundamental mode frequency source at ultra-high frequency.
Yoa et al. developed a system consisting of a SAW resonator (61 MHz) and a pair of conductive electrodes in the feedback circuit with a radio frequency amplifier[20,21]. Designs using SAW impedance systems have been applied to various bio-analytical fields concerning the (i) total salt concentration in serum[22], (ii) determination of urea[23], and (iii) pancreatic lipase[24]. The system can respond to changes in the capacitance and the conductance of the solution between the two electrodes, but its use to monitor bacterial growth has not been reported. Furthermore, there have been no studies of SAW impedance system using an ultra-high frequency resonator signal, which could improve sensitivity[25]. The availability of an ultra-high frequency also enables the design of wireless remote control functions[26].
This article describes the development of a sensor with a sig-nal translation circuit, modified using a common commercial wireless SAW transmitter. The device consists of a pair of con-ductive electrodes inserted into a 314.5 MHz SAW stabilized oscillator. The oscillator is characterized by its low cost, small size and energy-efficiency. We describe the application of this sensor for measurement of the number of microbes in a
biologi-cal culture. The stability and sensitivity of proposed SAW sensor was also compared with that of low frequency PQC (8.0 MHz) sensor[27].
2. Experimental
2.1. Reagents
The 314.5 MHz one-port, two terminal SAW resonator (RO2113A) used in this study was obtained from the Radio Fre-quency Monolithic Company (RFM, USA). The AT-cut AT-cut piezoelectric crystal with 8 MHz frequency used in this study was obtained from the Tai Tien Electric Co., Ltd., Taiwan.
Escherichia coli (ATCC 43886) obtained from the Food Industry
Research and Development Institute (FIRDI, Hsinchu, Taiwan) was inoculated into nutrient broth (Difco) and incubated at 30◦C overnight. The home-made reaction cell was constructed from a Teflon cup (i.d. = 5 mm, depth = 20 mm) and a teflon cover which held two gold electrodes (o.d. = 1 mm, L = 10 mm). l-Glycine, cysteine, leucine, tyrosine, methionine, histidine, l-aspartate, l-lysine and l-arginine were purchased from Sigma Chemical Co. (St. Louis, USA).
2.2. Experimental set-up
Fig. 1 shows the experimental set-up. The sensor was constructed with a SAW-stabilized oscillator [26]. A pair of gold electrodes was connected to the SAW resonator in series. The oscillation signal was fed to a frequency counter with a coaxial cable (Fig. 1A) (HP 53131A, Hewlett-Packard, USA).
Fig. 1. Schematic diagram of the experimental set-up where (A) signal is fed to a frequency counter via a coaxial cable and (B) signal is transmitted wirelessly.
The signal from the frequency counter was coupled to a PC (Pentium 600 MHz) using a PCMCIA-GPIB interface (GPIB National Instruments, Austin, TX, USA). Data acquisition and display were programmed using the LabVIEW 5.1 software
package (National Instruments, Austin, TX, USA). Fig. 1B
depicts the wireless experimental set-up. The design of the oscillator was the same as shown in Fig. 1A except that the signal from the oscillator was transmitted via the antenna to the frequency counter. The counter was separated from the sensor by approximately 20 cm and was used to receive the wireless signal. The series piezoelectric quartz crystal (PQC) sensor was constructed by connecting an AT-cut piezoelectric crystal with 8 MHz frequency and a pair of gold electrodes in series. A homemade TTL oscillator was employed to drive the crystal.
2.3. Procedure
To eliminate cross-contamination during bacteria concen-tration monitoring experiments, the Teflon reaction cell and electrodes were washed and rinsed with distilled water and ster-ilized at 121◦C for 15 min before each incubation and prior to immersion in any of the solutions. Then, a volume of 0.1 mL milk sample mixed with 0.1 mL sterilized nutrient broth was added to the cell culture which was then fitted with the elec-trodes. Unless otherwise stated, the total volume was ca. 0.2 mL for each experiment. The conductive electrodes were immersed in the cell culture and connected to a 314.5 MHz SAW resonator. The sensor was placed in an air bath at 30◦C with precise tem-perature control within± 0.2◦C. Unless otherwise stated, the measurements were taken half an hour after each inoculation of the cell cultures. The frequency was displayed and recorded by the computer until the incubation was completed. When a test is initially set up the user defines the detection criteria, nor-mally−10 Hz for most applications and when the rate of change of frequency exceed this pre-determined value the system will detect growth. The time required to reach the point of detection is referred to as detection time (DT) and is a function of the number of initial microbial population. Pour plates were pre-pared from these samples and incubated at 30◦C for 24 h. All colonies were counted 24 h after they were incubated. The detec-tion times were plotted against the responses determined by the plate count method for the solutions in a calibration graph. For the determination of growth curve, a concentration of E. coli of ca. 108cells per milliliter (cells/mL) in the nutrient broth was used to prepare ca. 101to 102cells/mL E. coli in the aseptic nutrient broth. The concentration of E. coli in the dilution was confirmed by both plate counting method and SAW method. The growth curve of E. coli in this commercial aseptic nutrient broth at 30◦C was obtained by determining the bacterial counts of sample every 2–3 h.
2.4. Principle
The SAW resonator was used to control the frequency of a SAW resonator-stabilized oscillator.Fig. 2shows the equivalent circuit model of a SAW resonator and its reactance character-istics with frequency. The circuit components Cm, Lm, Rmand
Fig. 2. The equivalent circuit of a SAW resonator. Cm, Lm, Rmand Co are the motional capacitance, motional inductance, motional resistance and static capacitance, respectively, of the SAW resonator. Rsol is the reciprocal of the solution conductance, Csolis the permittivity of the solution, and Cdlis the double layer capacitance between the electrodes and the fluid establishing contact with the electrode.
Coare the motional capacitance, motional inductance, motional resistance and static capacitance, respectively, of the SAW
res-onator. The components Cm and Lm determine the resonance
frequency of the SAW resonator. When a load capacitor (CL) is
connected with the resonator in series, the frequency of the oscil-lator is changed by a frequency Df, where Df is Cm/2(C0+ CL).
The frequency is decreased with the increase of the CL.
Yoa et al. reviewed the characteristics of electrode– electrolyte interfacial impedances when a pair of electrodes was connected with a SAW resonator in series[20]. For sinusoidal inputs, the terminal characteristics of an electrode have both a resistive (Rsol) and a reactive (Csoland Cdl) component, where Rsolis the reciprocal of the solution conductance, Csolis the
per-mittivity of the solution, and Cdlis the double layer capacitance
between the electrodes and the fluid establishing contact with the electrode[8,28]. When a pair of electrodes was connected to the SAW resonator in series and was placed within the bacte-rial culture solution of interest, microbial metabolism typically decreased both the resistance and the capacitance of the culture solution[5], causing a variation of the Csol, Cdland Rsolof the
circuit loop and thereby altering the frequency of the oscilla-tor. These features permit the SAW resonator to be used for the real-time monitoring of bacterial growth within a sealed opaque container.
3. Results and discussion
3.1. Frequency profile of the saw-stabilized oscillator
The frequency profile of the SAW-stabilized oscillator is shown inFig. 3. The oscillation signal was fed to a universal fre-quency counter by an axial cable (HP 53131A, USA). The noise level of the oscillator is±5 Hz (Fig. 3A). The relative frequency stability was 3.2× 10⁻⁸based on the observed noise to oscilla-tion frequency ratio over an average period of 20 min. Value of frequency stability was the noise level divide by the frequency of the SAW device (314.5 MHz).Fig. 1B shows the wireless design of the oscillator, where the signal is transmitted by antenna to the frequency counter. The frequency profile obtained by the wireless transmission and the non-wireless transmission were almost identical to each other, except for the effects of EMI. A
Fig. 3. Frequency profile of (A) the coaxial cable design and (B) the wireless design of the transmitter.
signal free from the effects of EMI is obtainable when the signal was fed into the counter via a coaxial cable. These findings indi-cate that the proposed SAW system has potential application for remote wireless monitoring of bacterial growth when the noise of EMI has been filtered.
The effect of temperature on the frequency of the oscilla-tor was also studied. The frequency of the oscillaoscilla-tor was steady within a temperature range from 25 to 40◦C (Fig. 4), but became unstable when the temperature exceeded 40◦C. Based on the above results, a temperature of 30◦C was selected for the fol-lowing tests.
Fig. 4. Effect of temperature on the frequency of the SAW oscillator.
Fig. 5. Effect of sample volume on the response of the SAW sensor. The sample is a nutrient broth (pH 7.0) inoculated with ca. 105cells/mL E. coli.
3.2. Optimization of the bacterial growth monitoring system
Fig. 5(line I) shows the frequency profile of the SAW sensor when the electrodes were immersed in a reference culture cell containing sterile nutrient broth. The sensor response remained stable for more than 10 h. The noise level of the sensor was ±10 Hz and the relative frequency stability was 6.36 × 10⁻⁸
based on the observed noise-to-oscillation frequency ratio over an average period of 10 h. This result indicates that the phys-ical and/or chemphys-ical factors unrelated to microbial growth of the media only affect the frequency of the sensor at a negligible level. On the contrary, the frequency decreases the frequency decreased slowly in the following 1 h when the electrodes were immersed in a cell culture containing bacteria inoculums. This may due to the bacteria and protein adsorbing on the elec-trode leading to an increase in the double layer capacitance (Cdl), resulting in the frequency decreased[6]. After
equilib-rium, the sensor response remained stable for a period of time hours (Fig. 5, line I). The stable time depend on the initial con-centration of bacteria in the cell culture (Fig. 5, lines II and III).
A further study was carried out to investigate the effect of sample volume on the response of the sensor. The detection time of 0.2 and 1.0 mL sample volume were 2.7 and 3.0 h, respectively (Fig. 5, lines II and III). Both lines have the same frequency profile model. A sample of 1.0 mL or larger than 1.0 mL required a longer time for the sensor to reach a plateau (Fig. 5, line IV), A sample volume less than 0.2 mL, however, was insufficient to perform the operation. The sample volume was selected as 0.2 mL for the following experiments.
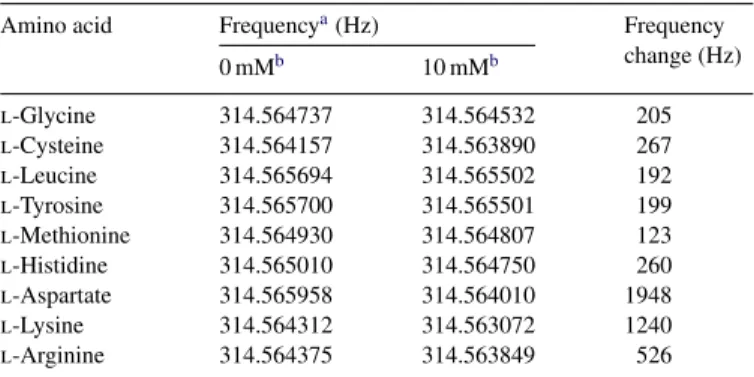
The effect of peptone and/or glucose enrichment on the growth of E. coli was also studied. Peptone enrichment was effective to have a shorter detection time of E. coli culture. On the contrary, the glucose enrichment showed no effect. As the result of our experiment, the breakdown of peptone by micro-bial metabolism was responsible for the frequency shift.Table 1
shows the effect of various amino acids on the frequency shift of the SAW sensor. The amino acids with acid or basic residues (e.g. l-aspartic acid, l-lysine, and l-arginine) could lead to a great change in the conductivity of the media, thereby the frequency shift notably, whereas the neutral amino acids (e.g. l-glycine,
Table 1
The effect of the concentration of different amino acid on the frequency of the SAW sensor
Amino acid Frequencya(Hz) Frequency
change (Hz) 0 mMb 10 mMb l-Glycine 314.564737 314.564532 205 l-Cysteine 314.564157 314.563890 267 l-Leucine 314.565694 314.565502 192 l-Tyrosine 314.565700 314.565501 199 l-Methionine 314.564930 314.564807 123 l-Histidine 314.565010 314.564750 260 l-Aspartate 314.565958 314.564010 1948 l-Lysine 314.564312 314.563072 1240 l-Arginine 314.564375 314.563849 526 aThe sample volume was 0.2 mL and the sensor was placed in an incubator at 30◦C with temperature precisely controlled at±0.2◦C. Each data point is the mean value of three measurements.
b Amino acid concentration.
l-cysteine, and l-leucine) caused relatively low frequency shift.
Fig. 6shows the effect of pH on the frequency response curves of E. coli in nutrient broth at 30◦C. The SAW sensor was used at an inoculums level of 104cells. Notably, detection time did not occur if the media was adjusted to pH 5.5 by adding HCl. This phenomenon can be explained by the following arguments. First, as described in a previous article[21], in high conductive media, the relative changes in conductance in the solution were smaller than in a low conductive media. The media with pH 7.0 could be classified as a low electrolytic conductivity medium. Thus, the relative changes in conductance in the solution were signif-icant, thereby producing a decrease in the frequency response after several hours’ incubation. However, the electrolytic con-ductivity of the media with pH 5.5 could be classified as high. Therefore, it should not be expected that a frequency decrease will be found in response to the growth of bacteria at pH 5.5 media. Second, the growth rate of E. coli in pH 5.5 was slower than that at pH 7.0 (data not shown). Interestingly, comparison of the growth rate of the bacteria in pH 8.5 with that of pH 7.0 revealed that both had identical grow curve (data not shown). However, the DT was delayed when the pH of culture media was increased from pH 7.0 to 8.5. It is possible that the major
Fig. 6. Effect of pH on the response of the sensor at 30◦C. The sample is 0.2 mL nutrient broth inoculated with 104cells/mL E. coli.
Fig. 7. Growth and frequency response curves of E. coli in nutrient broth (pH 7.0) at 30◦C using the sensor with inoculums with 102cells/mL. The sample volume was 0.2 mL.
protease produced by the E. coli in the present study is not alka-line protease. The protein breakdown by microbial metabolism was slow at high pH. Thus, the changes in conductance in the solution were less significant. Therefore, pH 7.0 of the culture medium was selected for the following tests.
3.3. Detection time (DT) versus standard plate count
The change in frequency of the oscillator when the elec-trodes were immersed in the culture was measured to monitor the growth of bacteria. Fig. 7 plots the growth and the fre-quency response against time after E. coli inoculation. A lag phase, a period of exponential growth, and a stationary phase were observed. The initial small change in frequency occurred in the seventh hour when the cell concentration reached 105to 106cells/mL. The microbial level associated with this change in frequency for such an impedance system is called the micro-bial threshold level. The micromicro-bial threshold level for our sensor was less than the conventional impedance method which shows a threshold level of 106to 107cells/mL[12,13].
Fig. 8shows the frequency response curves of the sensor with 102, 104 and 106cells/mL inoculums size of E. coli in nutri-ent broth at 30◦C. The detection time was found exponentially
Fig. 8. The response curves of the sensor at 30◦C in 0.2 mL nutrient broth (pH 7.0) inoculated with 102,104and 106cells/mL E. coli.
Fig. 9. (A) Noise trace of a SAW sensor (I) and a PQC sensor (II) in the sterile media. (B) Frequency response curves of SAW sensor (I) and SPQC sensor (II) of E. coli in nutrient broth with inoculums with 102cells/mL.
related to the inoculums size. The scattergrams of the detec-tion time against the logarithm of the inoculums size of E. coli from 102to 107cells/mL showed a linear curve. The regression equation was Y = 6.7692− 0.6531X (n = 10) and the correlation coefficient (R2) was 0.924. The relationship between the detec-tion time and the concentradetec-tion of E. coli became non-linear or undetectable when the inoculums concentration of E. coli was lower than 102cells/mL (data not shown). Therefore, the detec-tion limit of 102cells/mL was determined. This finding is in agreement with previous reports using conventional impedance systems[12,13,27,29].
Further studies involving pre-incubation of the sample before testing for lower bacterial concentrations may exploit whether these sensitivity limitations can be overcome[8].
3.4. Comparison of SAW sensor with the PQC sensor for the determination of bacteria concentration
The stability and sensitivity of proposed SAW sensor was compared with the PQC sensor (Fig. 9A). The SAW sensor and the PQC sensor have the same stability when the electrodes were immersed in a reference culture cell containing sterile nutrient broth. The noise level of the SAW sensor and PQC sen-sor were±10 Hz (relative stability of frequency = 6.36 × 10⁻⁸)
and ±0.25 Hz (relative stability of frequency = 6.25 × 10⁻⁸), respectively. The relative stability of frequency was based on the observed noise-to-oscillation frequency ratio over an aver-age period of 10 h. After the culture cell inoculated with E. coli, the SAW sensor shows a rapid initial rate change of the frequency signal (400 Hz/h), with a large total frequency change and give a sharp inflexion at the DT, whereas the PQC sensor only shows a slow and shallow response (0.25 Hz/h) (Fig. 9B). This result reveals that the SAW sensor is superior to PQC sensor in deter-mination of bacteria concentration. The noise level is the same for both SAW and PQC sensor. However, the resolution is higher for the SAW sensor due to its ultra high frequency. Furthermore, the SAW sensor was more sensitive than the PQC sensor based on the signal to noise ratio. When compared with conventional bacterial plating methods, this technique is relatively simple and, therefore, does not require the expertise of highly skilled tech-nicians. Nevertheless, the detection limit of our sensor for E.
coli was only 102cells/mL. Further investigation on the effect of pre-incubation of the sample may determine whether the sen-sor can be used in testing for lower bacterial concentrations. Another important feature of our SAW impedance system is the possibility of wireless transmissions of the sensor signal, which may enable the development of distinct application from conventional systems, such as in aseptic environments, which would be contaminated by a connecting wire or in hazardous environments. The wireless method may improve safety.
4. Conclusions
This study presents a novel design for a SAW impedance sensor. This device was used to detect the growth of E. coli. The impedance signal from the interface of the electrode in the bacterial culture solution was translated into a frequency sig-nal by our SAW impedance sensor. An important advantage of our sensor is its lower microbial detection threshold number than traditional impedance methods. The microbial detection threshold in this study was 105to 106cells/mL. Hence, the sen-sor described in this paper is faster than instruments employing traditional impedance methods (106to 107cells/mL). Although the proposed SAW sensor work at ultra high frequency, it pos-sesses the same stability compare with that of lower frequency PQC sensor. Furthermore, the SAW sensor was more sensitive than the PQC sensor base on the signal to noise ratio. When compared with conventional bacterial plating methods, this tech-nique is relatively simple and, therefore, does not require the expertise of highly skilled technicians. Nevertheless, the detec-tion limit of our sensor for E. coli was only 102cells/mL. Further investigation on the effect of pre-incubation of the sample may determine whether the sensor can be used in testing for lower bacterial concentrations. Another important feature of our SAW impedance system is the possibility of wireless transmissions of the sensor signal, which may enable the development of dis-tinct application from conventional systems, such as in aseptic environments, which would be contaminated by a connecting wire or in hazardous environments. The wireless method may improve safety.
Acknowledgement
The authors would like to thank the National Science Council of the Republic of China for financially supporting this research under Contract No. NSC-92-2113-M-002-053-.
References
[1] J. Niza-Ribeiro, A.C. Louza, P. Santos, M. Lima, Monitoring the microbi-ological quality of raw milk through the use of an ATP bioluminescence method, Food Contr. 11 (2000) 209–216.
[2] M.R. Rosmini, M.L. Signorini, R. Schneider, J.C. Bonazza, Evaluation of two alternative techniques for counting mesophilic aerophilic aerobic bacteria in raw milk, Food Contr. 15 (2004) 39–44.
[3] I.K. Shitanda, Takada, Y. Sakai, T. Tatsuma, Amperometric biosensing systems based on motility and gravitaxis of flagellate algae for aquatic risk assessment, Anal. Chem. 77 (2005) 6715–6718.
[4] N.V. Kulagina, M.E. Lassman, F.S. Ligler, C.R. Taitt, Antimicrobial pep-tides for detection of bacteria in biosensor assays, Anal. Chem. 77 (2005) 6504–6508.
[5] C.J. Felice, R.E. Madrid, J.M. Olivera, V.I. Rotger, M.E. Valentinuzzi, Impedance microbiology: quantification of bacterial content in milk by means of capacitance growth curves, J. Microbiol. Methods 35 (1999) 37–42.
[6] L. Yang, Y. Li, C.L. Griffis, M.G. Johnson, Interdigitated microelec-trode (IME) impedance sensor for the detection of viable Salmonella
typhimurium, Biosens. Bioelectron. 19 (2004) 1139–1147.
[7] J.W. Gardner, M. Cole, C.G. Dowson, P. Newton, G. Sehra, Smart acous-tic sensor for the detection of bacteria in milk, in: Proceeding of the 3rd IASTED International Conference on Biomedical Engineering, vol. 458, 2005, p. 168.
[8] R. Firstenberg-Eden, J. Zindulis, Electrochemical changes in media due to microbial growth, J. Microbiol. Methods 2 (1984) 103–115.
[9] P. Silley, S. Forsythe, Impedance microbiology—a rapid change for micro-biologists, J. Appl. Bacteriol. 80 (1996) 233–243.
[10] M. Wawerla, A. Stolle, B. Schalch, H. Eisgruber, Impedance microbiology: applications in food hygiene, J. Food Prot. 62 (1999) 1488–1496. [11] A. Ur, D.F.J. Brown, Impedance monitoring of bacterial activity, J. Med.
Microbiol. 8 (1975) 19–27.
[12] R. Firstenberg-Eden, Rapid estimation of the number of microorganisms in raw meat by impedance measurement, Food Technol. 37 (1983) 65–70. [13] D. Hardy, S.J. Kraeger, S.W. Dufour, P. Candy, Rapid detection of microbial contamination in frozen vegetables by automated impedance measure-ments, Appl. Environ. Microbiol. 34 (1977) 14–17.
[14] P. Candy, S.W. Dufour, S.J. Kraeger, Electrical impedance measurements: rapid method for detecting and monitoring micro-organisms, J. Clin. Micro-biol. 7 (1978) 265–272.
[15] K.O. Kolquhoun, S. Timms, C.R. Fricker, Detection of Escherichia coli in potable water using direct impedance technology, J. Appl. Bacteriol. 79 (1995) 635–639.
[16] P. Neaves, M.J. Waddell, G.A. Prentice, A medium for the detection of Lancefield group D cocci in skimmed milk powder by measurement of conductivity changes, J. Appl. Bacteriol. 65 (1988) 437–448.
[17] K.G. Ong, J. Wang, R.S. Singh, L.G. Bachas, C.A. Grimes, Monitoring of bacteria growth using a wireless, remote query resonant-circuit
sen-sor: application to environmental sensing, Biosens. Bioelectron. 16 (2001) 305–312.
[18] T. Deak, L.R. Beucha, Comparison of conductimetric and traditional plat-ing techniques for detectplat-ing yeasts in fruit juices, J. Appl. Bacteriol. 75 (1993) 546–550.
[19] W. Welsch, C. Klein, M. von Schickfus, S. Hunklinger, Development of a surface acoustic wave immunosensor, Anal. Chem. 68 (1996) 2000–2004. [20] S. Yoa, K. Chen, D. Liu, L. Nie, Circuit network analysis method applied to surface acoustic wave impedance system in liquids, Anal. Chim. Acta 294 (1994) 311–318.
[21] S. Yoa, K. Chen, L. Nie, Application of a surface acoustic wave sensor system for the determination of non-aqueous solutions and phase transitions in lipid multibilayers, Anal. Chim. Acta 289 (1994) 47–55.
[22] S. Yoa, K. Chen, F. Zhu, D. Shen, L. Nie, Surface acoustic wave sensor system for the determination of total salt content in serum, Anal. Chim. Acta 287 (1994) 65–73.
[23] D. Liu, K. Chen, K. Ge, L. Nie, S. Yoa, Study on the urease activity in different plant seeds and clinical analysis of urea in human body fluids by a surface acoustic wave enzyme sensor system, Fresenius J. Anal. Chem. 354 (1996) 114–117.
[24] K. Ge, D. Liu, K. Chen, L. Nie, S. Yoa, Assay of pancreatic lipase with surface acoustic wave sensor system, Anal. Biochem. 226 (1995) 207– 211.
[25] F.L. Dickert, P. Forth, W.-E. Bulst, G. Fischerauer, U. knauer, SAW devices-sensitivity enhancement in going from 80 MHz to 1 GHz, Sens. Actuators B 46 (1998) 120–125.
[26] RFM, Product data book. RF solutions for communications and computing. RF Monolithics, Inc., Texas, USA, 1997, A:17.
[27] S.B. Martins, M.J. Selby, Evaluation of a rapid method for the quantitative estimation of coliforms in meat by impedimetric procedure, Appl. Environ. Microbiol. 39 (1980) 518–524.
[28] W. Laureyn, D. Nelis, P. Van-Gerwen, K. Baert, L. Hermans, R. Magnee, J.J. Pireaux, G. Maes, Nanoscaled interdigitated titanium electrodes for impedimetric biosensing, Sens. Actuators B 68 (2000) 360–370. [29] S. Gnan, L.O. Luedecke, Impedance measurements in raw milk as an
alternative to the standard plate count, J. Food Prot. 45 (1982) 4–7.
Biographies
Ku-Shang Chang received his PhD degree in Microbiological and Biological Engineering from the Taiwan University, Taipei, Taiwan. He is currently an associate professor in the Department of Food Science at Yuanpei University of Science & Technology, Hsinchu, Taiwan. His research interests include food science and chemical sensors.
Chen-Kai Chang received his PhD degree in Microbiological and Biological Engineering from the Taiwan University, Taipei, Taiwan. He is currently an assistant professor in the Department of Food Science at Chia Nan University of Pharmacy and Science, Tainan, Taiwan. His research interests include plant cell culture and chemical sensors.
Chien-Yuan Chen received his PhD degree in Life Science from National Tai-wan University, Taipei, TaiTai-wan and PhD of Engineering from The University of Tokyo, Japan. He is currently a professor in Microbiological and Biological Engineering from the Taiwan University, Taipei, Taiwan. His research interests include life science and chemical sensor.
![Fig. 1 shows the experimental set-up. The sensor was constructed with a SAW-stabilized oscillator [26]](https://thumb-ap.123doks.com/thumbv2/9libinfo/8841935.239180/2.892.470.812.670.1076/fig-shows-experimental-sensor-constructed-saw-stabilized-oscillator.webp)