Liquid–liquid equilibria of two binary systems: water q 1-pentanol
and water q 2-methyl-2-butanol and two ternary systems:
water q 1-pentanol q 2-butyloxyethanol and
water q 2-methyl-2-butanolq 2-butyloxyethanol
Yung-Hsiang Pai, Li-Jen Chen
)Department of Chemical Engineering, National Taiwan UniÕersity, Taipei 106, Taiwan Received 5 September 1998; accepted 10 November 1998
Abstract
Liquid–liquid equilibrium phase diagrams for two binary systems: water q 1-pentanol and water q 2-methyl-2-butanol and two ternary systems: water q 1-pentanol q 2-butyloxyethanol and water q 2-methyl-2-methyl-2-butanolq 2-butyloxyethanol at 208C and 308C are presented in this paper. The experimental results were correlated with the UNIQUAC model by fitting the effective UNIQUAC binary interaction parameters as a function of temperature. Agreement between the calculated and experimental data was very good. q 1999 Elsevier Science B.V. All rights reserved.
Keywords: Liquid–liquid equilibria; Data; Mixture; UNIQUAC model
1. Introduction
The experimental data of liquid–liquid equilibrium are necessary for the design of liquid–liquid extractors and of decanters in distillation systems. It is of particular importance in these days of higher energy costs. In this study, liquid–liquid equilibrium measurements were performed for two binary systems: water q pentanol and water q 2-methyl-2-butanol and two ternary systems: water q 1-pentanol q 2-butyloxyethanol and water q 2-methyl-2-butanolq 2-butyloxyethanol at 208C and 308C. Although the mutual solubility of the systems water q 1-pentanol and water q 2-methyl-2-butanol had
)
Corresponding author. Tel.: q886-223623296; fax: q886-223623040; e-mail: ljchen@ccms.ntu.edu.tw 0378-3812r99r$ - see front matter q 1999 Elsevier Science B.V. All rights reserved.
Ž .
Table 1
w x
Comparison of the experimental results and literature data 11 of densities, r, refractive index, n , and viscosities, h, of theD pure compounds at 293.15 K
y3
Compound r rg cm nD hrmPa s
Exptl. Lit. Exptl. Lit. Exptl. Lit.
1-Pentanol 0.81453 0.8151 1.4096 1.4100 4.0606 4.0608
2-Methyl-2-butanol 0.80999 0.8096 1.4049 1.4049 4.3817 4.3760
Water 0.99821 0.9982058 1.3330 1.33299 0.9943 1.0020
2-Butyloxyethanol 0.90072 1.4196 3.2861
w x
been reported previously by several different research groups 1–9 , there exists a certain discrepancy among these data. It is our purpose to verify these inconsistent data. On the other hand, there are, to the best of our knowledge, no liquid–liquid equilibrium experimental data for the ternary systems water q 1-pentanol q 2-butyloxyethanol and water q 2-methyl-2-butanolq 2-butyloxyethanol avail-able in the literature.
w x
The experimental data were correlated with the UNIQUAC model of Abrams and Pranusnitz 10 . The effective binary interaction parameters of the UNIQUAC model were determined as a function of temperature. The experimental equilibrium data were successfully described by the UNIQUAC model.
2. Experimentals
Ž . Ž
Reagent grade 1-pentanol better than 98.5% purity , 2-methyl-2-butanol better than 99.5%
. Ž .
purity , and 2-butyloxyethanol better than 99% purity were obtained from Merck. All the chemicals were used as received without any further purification. Water was purified in a Barnstead NANOpure
Table 2
Ž . Ž .
Experimental mole fraction of water of equilibrium liquid phases for the binary systems: water 1 q1-pentanol 2 and
Ž . Ž .
water 1 q2-methyl-2-butanol 2 at various temperatures
Ž . Ž . Ž . Ž .
Temp.r8C Water 1 q1-pentanol 2 Water 1 q2-methyl-2-butanol 2
l u l u x1 x1 x1 x1 10 0.9943 0.3391 0.9716 0.6310 20 0.9951 0.3439 0.9764 0.6042 30 0.9955 0.3515 0.9794 0.5883 40 0.9958 0.3591 0.9829 0.5763 50 0.9959 0.3755 0.9853 0.5624 60 0.9959 0.3909 0.9868 0.5514 70 0.9959 0.4040 0.9874 0.5378 80 0.9956 0.4222 0.9880 0.5350
Ž . Ž .
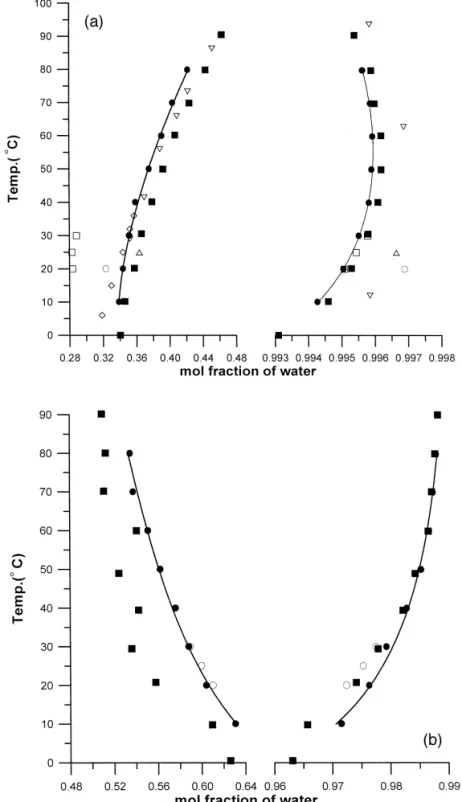
Fig. 1. Coexistence curve for the binary systems: a waterq1-pentanol and b waterq2-methyl-2-butanol: experimental
Ž . Ž . w x Ž . Ž . w x Ž .
results of this study v , of Ginning and Baum 1937 1 I, of Krupatkin and Glagoleva 1969 2 ^, of Laddha and
Ž . w x Ž . Ž . w x Ž . Ž . w x Ž .
Smith 1948 3 `, of Verschaffelt 1894 4 e , of Zhuravleva and Zhuravlev 1970 5 \, of Stephenson et al. Ž1984. w x Ž9 B., and calculated results by the UNIQUAC model solid curve .Ž .
II system with the resistivity better than 17.8 M V cm. The comparison of measured density, refractive index and viscosity of 1-pentanol, 2-methyl-2-butanol, 2-butyloxyethanol and water with
w x
literature values 11 at 293.15 K is shown in Table 1. The purity of 1-pentanol was further checked by gas chromatography, confirming the absence of other significant organic components, so no further purification was attempted.
The mixtures of binary and ternary systems were prepared in an 1 cm diameter test tube, and placed in a computer-controlled water-thermostat, whose temperature stability was better than
"0.0048C. These samples were kept in the thermostat at least for several hours, sometimes up to two
days, to allow the system to reach equilibrium. Before and during the equilibration process, the samples were shaken vigorously several times to ensure a thorough mixing. After the equilibrium was reached, both liquid phases were transparent with a sharp, mirror-like interface. Following equilibra-tion, both liquid phases were carefully sampled by syringe for further experiments on the determina-tions of composition by gas chromatography for each liquid phase.
Ž .
A gas chromatograph Shimadzu, model GC-8A equipped with thermal conductivity detector and
Ž .
connected to an integrator Shimadzu, model C-R6A Chromatopac was used. A 6 ft by 1r8 in. diameter stainless steel column packed with Poropak P 100r200 mesh was used. The oven temperature was held at 2008C for the systems containing 1-pentanol and at 1808C for the systems containing 2-methyl-2-butanol. Both injection-port and detector temperature were held at 2308C. The carrier gas was helium. Each analysis took about 10 min. Samples of single phase with known compositions were used to calibrate the instrument in the composition range of interest. Replicate measurements of a composition analysis indicated a precision of less than 1% deviation.
3. Results and discussion
The experimental compositions of the equilibrium phases obtained for the systems water q 1-pentanol and water q 2-methyl-2-butanol under investigation are reported in Table 2. The data are expressed in units of mole fraction of water. The superscripts u and l stand for the upper and lower
Ž . Ž .
phases, respectively. Fig. 1 a and b compare our experimental data to the previous data in the
w x
literature 1–9 for the systems water q 1-pentanol and water q 2-methyl-2-butanol, respectively. As
w x
one can see in Fig. 1 that our data have a very good agreement with that of Stephenson et al. 9 . It
w x
should be pointed out that the experimental uncertainty of Stephenson et al. 9 was claimed to be less than 5%, a relatively large value, which makes most of their data within our experimental uncertainty.
Table 3
w x
The relative van der Waals volume r and van der Waals surface area q 11
Compound r q
1-Pentanol 4.5987 4.208
2-Methyl-2-butanol 4.5972 4.284
Water 0.9200 1.400
Table 4
Ž . Ž .
Estimated coefficients defined in Eqs. 3 and 4 for the systems: waterq1-pentanol and waterq2-methyl-2-butanol
Parameter Waterq1-pentanol Waterq2-methyl-2-butanol
o Ž . a12 K y1162.18 y1175.73 o b12 6.90062 6.96258 o Ž . c12 1rK y0.00805346 y0.00865876 o Ž . a21 K 447.452 845.062 o b21 y0.777057 y4.66108 o Ž . c21 1rK y0.000528099 0.00728619 w x
Except the data 9 of the upper phases in the system water q 2-methyl-2-butanol, as shown in Fig.
Ž .
1 b , are systematically smaller than our result.
w x
The UNIQUAC model of Abrams and Pranusnitz 10 was used to correlate experimental data. The relative van der Waals volume, r, and van der Waals surface area, q, of the UNIQUAC model were
w x
calculated from the UNIFAC group contribution table of Hansen et al. 12 and are listed for each
component in Table 3. The effective binary interaction parameter ai j is defined by
u y ui j j j
a si j
Ž .
1R
where R is the gas constant and ui j is the UNIQUAC interaction parameter between molecules i and
j. The effective binary interaction parameters a12 and a21 were exactly solved for each temperature by numerical method according to the iso-activity criterion:
xlgls
xugu
, i s 1 and 2
Ž .
2i i i i
where x is the mole fraction of component i, g is the activity coefficient, and superscript l and ui
stand for the lower and upper liquid phases, respectively.
It was found that the effective binary interaction parameters a12 and a21 are
temperature-depen-dent. Therefore, the effective binary interaction parameters a12 and a21 were further correlated with
Ž .
temperature T K by the following polynomial equation:
a s ao qboT q coT2 3
Ž .
12 12 12 12
Table 5
Ž . Ž . Ž .
Average absolute deviation in compositions for the systems: water 1 q1-pentanol 2 and water 1 q2-methyl-2-butanol
Ž .2
System Average absolute deviation
l u
D x1 D x1
Waterq1-pentanol 0.0010 0.0000
Table 6
Ž . Ž .
Experimental and calculated mole fractions of equilibrium liquid phases for the ternary system water 1 q1-pentanol 2
Ž . q2-butyloxyethanol 3 at 208C
Experimental results Calculated results
u u l l u u l l x1 x3 x1 x3 x1 x3 x1 x3 0.3887 0.0385 0.9937 0.00094 0.3887 0.0393 0.9947 0.00058 0.4117 0.0654 0.9928 0.0018 0.4117 0.0587 0.9944 0.00099 0.4385 0.0944 0.9928 0.0027 0.4385 0.0800 0.9940 0.0016 0.4879 0.1233 0.9912 0.0042 0.4879 0.1150 0.9930 0.0029 0.5355 0.1463 0.9897 0.0058 0.5355 0.1431 0.9916 0.0046 0.5804 0.1684 0.9892 0.0075 0.5804 0.1640 0.9899 0.0066 0.6397 0.1813 0.9872 0.0098 0.6397 0.1822 0.9868 0.0100 0.7009 0.1833 0.9845 0.0128 0.7009 0.1882 0.9825 0.0148 0.7946 0.1526 0.9792 0.0183 0.7946 0.1682 0.9722 0.0257 0.8694 0.1073 0.9707 0.0260 0.8694 0.1237 0.9566 0.0422
average absolute deviation 0.0076 0.0032 0.0032
and a s ao qboT q coT2 4
Ž .
21 21 21 21 Table 7 Ž . Ž .Experimental and calculated mole fractions of equilibrium liquid phases for the ternary system water 1 q1-pentanol 2
Ž . q2-butyloxyethanol 3 at 308C
Experimental results Calculated results
u u l l u u l l x1 x3 x1 x3 x1 x3 x1 x3 0.3933 0.0322 0.9952 0.00068 0.3933 0.0390 0.9951 0.00057 0.4123 0.0494 0.9945 0.0011 0.4123 0.0561 0.9949 0.00092 0.4280 0.0693 0.9940 0.0017 0.4280 0.0696 0.9947 0.0013 0.4473 0.0838 0.9936 0.0021 0.4473 0.0852 0.9943 0.0017 0.4725 0.1042 0.9930 0.0028 0.4725 0.1043 0.9937 0.0024 0.5025 0.1228 0.9916 0.0038 0.5025 0.1247 0.9929 0.0035 0.5285 0.1442 0.9908 0.0048 0.5285 0.1404 0.9920 0.0045 0.5574 0.1615 0.9903 0.0058 0.5574 0.1554 0.9908 0.0059 0.5851 0.1725 0.9900 0.0067 0.5851 0.1673 0.9895 0.0073 0.6083 0.1838 0.9888 0.0079 0.6083 0.1754 0.9882 0.0087 0.6517 0.1891 0.9875 0.0095 0.6517 0.1855 0.9853 0.0118 0.6985 0.1912 0.9855 0.0120 0.6985 0.1886 0.9813 0.0160 0.7608 0.1771 0.9817 0.0159 0.7608 0.1791 0.9743 0.0233 0.8261 0.1439 0.9767 0.0211 0.8261 0.1509 0.9632 0.0347 0.8378 0.1365 0.9755 0.0224 0.8378 0.1438 0.9605 0.0375 0.8455 0.1318 0.9739 0.0239 0.8455 0.1389 0.9585 0.0395 0.8628 0.1190 0.9717 0.0260 0.8628 0.1267 0.9534 0.0447 0.9011 0.0883 0.9608 0.0360 0.9011 0.0953 0.9361 0.0621
Table 8
Ž .
Experimental and calculated mole fractions of equilibrium liquid phases for the ternary system water 1 q2-methyl-2-butanol
Ž .2 q2-butyloxyethanol 3 at 208CŽ .
Experimental results Calculated results
u u l l u u l l x1 x3 x1 x3 x1 x3 x1 x3 0.6381 0.0545 0.9787 0.0023 0.6381 0.0483 0.9780 0.0026 0.6496 0.0703 0.9789 0.0032 0.6496 0.0598 0.9779 0.0038 0.6697 0.0802 0.9785 0.0040 0.6697 0.0763 0.9770 0.0061 0.6910 0.0947 0.9788 0.0053 0.6910 0.0896 0.9751 0.0089 0.7169 0.1061 0.9777 0.0071 0.7169 0.1013 0.9717 0.0130 0.7446 0.1095 0.9770 0.0086 0.7446 0.1089 0.9667 0.0183 0.7812 0.1087 0.9756 0.0111 0.7812 0.1118 0.9576 0.0269 0.8200 0.1018 0.9705 0.0160 0.8200 0.1066 0.9439 0.0388 0.8367 0.0958 0.9652 0.0201 0.8367 0.1019 0.9362 0.0450 0.8886 0.0672 0.9583 0.0243 0.8886 0.0779 0.9040 0.0684
average absolute deviation 0.0056 0.0151 0.0130
The coefficients a12o , b12o , c12o, ao21, b21o, and c21o were estimated by regression of the effective
binary interaction parameters a s over the whole experimental temperature range. Table 4 lists thei j
values of these coefficients.
Ž . Ž .
Fig. 1 a and b show a comparison between the experimental results and the calculated phase
Ž . Ž .
boundaries obtained from the UNIQUAC model with the correlated parameters, Eqs. 3 and 4 . The calculated results of phase behavior describe the experimental data very well. Table 5 gives the average absolute deviation of the compositions of water in both lower and upper phases over the experimental temperature range calculated by the UNIQUAC model. The calculated results of the
Table 9
Ž .
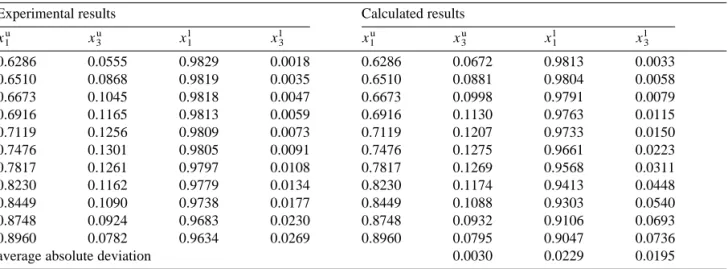
Experimental and calculated mole fractions of equilibrium liquid phases for the ternary system water 1 q2-methyl-2-butanol
Ž .2 q2-butyloxyethanol 3 at 308CŽ .
Experimental results Calculated results
u u l l u u l l x1 x3 x1 x3 x1 x3 x1 x3 0.6286 0.0555 0.9829 0.0018 0.6286 0.0672 0.9813 0.0033 0.6510 0.0868 0.9819 0.0035 0.6510 0.0881 0.9804 0.0058 0.6673 0.1045 0.9818 0.0047 0.6673 0.0998 0.9791 0.0079 0.6916 0.1165 0.9813 0.0059 0.6916 0.1130 0.9763 0.0115 0.7119 0.1256 0.9809 0.0073 0.7119 0.1207 0.9733 0.0150 0.7476 0.1301 0.9805 0.0091 0.7476 0.1275 0.9661 0.0223 0.7817 0.1261 0.9797 0.0108 0.7817 0.1269 0.9568 0.0311 0.8230 0.1162 0.9779 0.0134 0.8230 0.1174 0.9413 0.0448 0.8449 0.1090 0.9738 0.0177 0.8449 0.1088 0.9303 0.0540 0.8748 0.0924 0.9683 0.0230 0.8748 0.0932 0.9106 0.0693 0.8960 0.0782 0.9634 0.0269 0.8960 0.0795 0.9047 0.0736
Table 10
Ž . Ž .
Effective binary interaction parameters of UNIQUAC model for the system water 1 q1-pentanol 2 q2-butyloxyethanol
Ž .3 ij 208C 308C Ž . Ž . Ž . Ž . ai j K aji K ai j K aji K 12 169.005 173.808 189.532 163.497 13 297.973 y153.181 293.525 y153.693 23 137.816 y157.897 139.104 y168.361
system water q 1-pentanol have a smaller deviation from the experimental data than that of the system water q 2-methyl-2-butanol.
The experimental compositions of tie lines for the ternary systems water q 1-pentanol q 2-butyloxyethanol and water q 2-methyl-2-butanolq 2-2-butyloxyethanol at 208C and 308 are given in Tables 6–9.
The experimental data of ternary systems were also correlated by the UNIQUAC model. For the UNIQUAC model, there are six binary interaction parameters for a ternary system. Two binary interaction parameters for the systems water q 1-pentanol and water q 2-methyl-2-butanol can be directly determined from the experimental results of these binary systems. Therefore, there are four binary interaction parameters left for each ternary system under investigation. In this work, the
w x
parameter estimation was carried out in a two-step procedure proposed by Negahban et al. 13 . The first step was to minimize the sum of the squared differences between the activities of each component in each phase.
m 3
2
l l u u
F s1
Ý Ý
ž
x g y x gi j i j i j i j/
Ž .
5js1 is1
where xli j and xui j are the experimental mole fraction of component i of, respectively, lower and
upper phase along a tie-line j, gl and gu are the corresponding activity coefficient calculated from
i j i j
the UNIQUAC model, and m is the total number of tie-lines. The regression results of the effective
Ž .
binary interaction parameters from minimization of Eq. 5 were used as initial guesses for the second step, which was to minimize of the sum of the squared differences between the calculated and experimental mole fractions.
m 3 2 2 l l u u F s
Ý Ý
x y xˆ
qŽ
x y xˆ
.
Ž .
6ž
/
½
5
2 i j i j i j i j js1 is1 Table 11 Ž . Ž .Effective binary interaction parameters of UNIQUAC model for the system water 1 q2-methyl-2-butanol 2
q2-buty-Ž . loxyethanol 3 ij 208C 308C Ž . Ž . Ž . Ž . ai j K aji K ai j K aji K 12 118.784 108.277 132.246 108.437 13 159.190 y104.305 144.639 y87.202 23 114.394 y190.425 110.016 y202.564
where x
ˆ
li j and xˆ
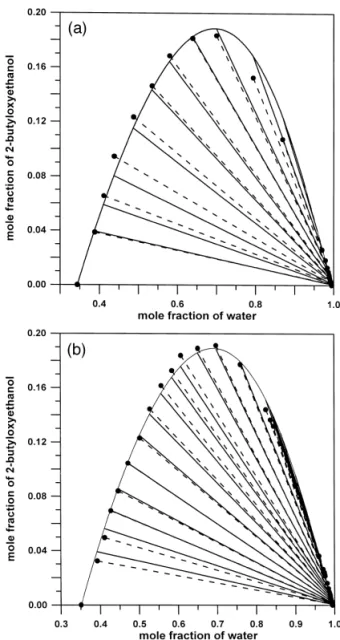
i ju are the calculated mole fraction of component i of, respectively, lower and upper phase along the tie-line j.Tables 10 and 11 summarize the values of the UNIQUAC model parameters obtained from the two-step regression procedure for the systems water q 1-pentanol q butyloxyethanol and water q 2-methyl-2-butanolq 2-butyloxyethanol, respectively. Note that the effective binary interaction parame-ters are temperature-dependent. The calculated results along each tie-line are also given in Tables 6–9, and have a good agreement with experimental data. The average absolute deviation of the calculated compositions along a tie-line is also given in the bottom of Tables 6–9. Figs. 2 and 3 show a graphical comparison between the experimental and the calculated tie lines for the systems
Ž . Ž .
Fig. 2. Ternary liquid–liquid equilibria for the system waterq1-pentanolq2-butyloxyethanol a at 208C; b at 308C:
Ž . Ž . Ž .
Ž . Ž .
Fig. 3. Ternary liquid–liquid equilibria for the system waterq2-methyl-2-butanolq2-butyloxyethanol a at 208C; b at
Ž . Ž . Ž .
308C: experimental tie lines v, dotted line , calculated tie lines solid line , and calculated binodal curve solid curve .
water q 1-pentanol q 2-butyloxyethanol and water q 2-methyl-2-butanolq 2-butyloxyethanol, respec-tively. The experimental equilibrium data were successfully correlated by the UNIQUAC model. List of symbols
Ž . Ž .
ai j effective binary interaction parameter of UNIQUAC model defined by Eq. 1 , K
o o o
Ž . Ž .
a , b , ci j i j i j coefficients in Eqs. 3 and 4
F1 activity objective function
Ž . Ž .
m total number of tie-lines in Eqs. 5 and 6
nD refractive index in Table 1
R gas constant
Ž .
T temperature K
ui j the UNIQUAC binary interaction parameter between molecules i and j
xi the experimental mole fraction of component i
x
ˆ
i the calculated mole fraction of component iGreek letters
Ž .
h viscosity mPa s
gi activity coefficient of component i
Ž y3.
r density g cm
Subscripts
i, j,1,2,3 component identification
Superscripts
l lower phase of a two-liquid-phase coexisting system
u upper phase of a two-liquid-phase coexisting system
Acknowledgements
This work was supported by the Chinese Petroleum and the National Science Council of Taiwan, Republic of China.
References
w x1 P.M. Ginning, R. Baum, J. Am. Chem. Soc. 59 1937 1111.Ž .
w x2 I.L. Krupatkin, M.F. Glagoleva, Zh. Prikl. Khim. Leningrad 42 1969 1076.Ž . Ž . w x3 G.S. Laddha, J.M. Smith, Ind. Eng. Chem. 40 1948 494.Ž .
w x4 J. Verschaffelt, Z. Phys. Chem. Leipzig 15 1894 437.Ž . Ž .
w x5 I.K. Zhuravleva, E.F. Zhuravlev, Izv. Vyssh. Ucheb. Zaved. Khim. Tekhnol. 13 1970 480.Ž . w x6 W. Herz, Ber. Dtsch. Chem. Ges. 31 1898 2669.Ž .
w x7 J.A.V. Butler, D.W. Thomson, W.H. MacLennan, J. Chem. Soc. 1933 674.Ž . w x8 K. Kinoshita, H. Ishikawa, K. Shinoda, Bull. Chem. Soc. Jpn. 31 1958 1081.Ž . w x9 R. Stephenson, J. Stuart, M. Tabak, J. Chem. Eng. Data 29 1984 287.Ž . w10 D.S. Abrams, J.M. Prausnitz, AIChE J. 21 1975 116.x Ž .
w11 TRC-Thermodynamic Tables Non-Hydrocarbons, Thermodynamic Research Center, Texas A&M University: Collegex
Station, TX, 1993.
w12 H.K. Hansen, B. Coto, B. Kuhlmann, UNIFAC with Lineary Temperature-Dependent Group-Interaction Parameters,x
Ž .
IVC-SEP, Phase Equilibria and Separation Processes, SEP 9212, 1992 .