Direct Measurements of Intersystem Crossing Rates and Triplet Decays of Luminescent
Conjugated Oligomers in Solutions
†Hsin-Liang Chen,‡Yi-Fang Huang,§Chao-Ping Hsu,|Tsong-Shin Lim,§ Li-Chung Kuo,⊥ Man-kit. Leung,⊥Teng-Chih Chao,⊥Ken-Tsung Wong,⊥Show-An Chen,#and
Wunshain Fann*‡,§
Department of Physics, National Taiwan UniVersity, Taipei 106, Taiwan, Institute of Atomic and Molecular Sciences, Academia Sinica, Taipei 106, Taiwan, Institute of Chemistry, Academia Sinica, Taipei 106, Taiwan, Department of Chemistry, National Taiwan UniVersity, Taipei 106, Taiwan, and Department of Chemical Engineering, National Tsing Hua UniVersity, Hsinchu 300, Taiwan
ReceiVed: May 25, 2007; In Final Form: August 3, 2007
Photothermal calorimetry and fluorescence spectroscopy were used to determine the relaxations of the photoexcited singlet state of two PPV and polyfluorene oligomers, (E,E)-1,4-bis[(2-benzyloxy)styryl]benzene (PVDOP) and ter(9,9′-spirobifluorene) (TSBF). The decay rates of different S1relaxation channels, which
include intersystem crossing (ISC), radiative, and nonradiative decay can be determined by the combination of photoacoustic calorimetry (PAC) and the time-correlated single photon counting (TCSPC) technique. The triplet state energy level is determined by the phosphorescence (Ph) spectra recorded at 77 K. The ISC yields are∼3% and 6% for PVDOP and TSBF, respectively. The T1to S0transition decay rate is acquired by PAC
and photothermal beam deflection (PBD) measurements. The triplet state decay rate is 17 and 21 ms-1at room temperature. The Ph intensity decay at 77 K shows that the triplet state lifetime increases by 4 orders of magnitude, as compared to room temperature.
Introduction
There is extensive interest in using conjugated polymer for flexible electronic and electro-optic devices such as thin-film transistors,1-3polymer light emitting diodes (PLEDs),4-6 and
solar cells.7,8 Among the different conjugated polymers, the
derivatives of poly(p-phenylenevinylene) (PPV) and polyfluo-rene (PF) play significant roles in the development of the PLEDs. PPV and PF have been extensively studied both experimentally and theoretically.9-17However, the
photophysi-cal behaviors of conjugated polymers are strongly influenced by the conjugated length distribution. The problem can be simplified by studying the model oligomers with similar building blocks of the polymers, thus eliminating the effect of conjugated length distribution on photophysics.23
Except for the singlets (the excitons created by light excitation directly), molecules can also transfer from the lowest energy vibrational state S1 to the first triplet state T1 and undergo a
spin conversion intersystem crossing (ISC). Phosphorescence (Ph), emitted from T1to the singlet ground state with a longer
wavelength and much longer lifetime (microseconds to mil-liseconds) relative to fluorescence, has a much smaller rate constant. The transition from T1to singlet the ground state is
effectively inhibited, thus the triplet exciton is believed to reduce the luminescence quantum yield, especially the electrolumines-cence quantum yield of polymeric light-emitting diodes (PLED). Because presumably in PLED 75% of the population is in the triplet state, understanding their properties are important. The
concentrations in solution provide a tuning knob to vary the intermolecular interactions. This is important for studying the photophysics properties. For example, the triplet decays in films are dominated by triplet-triplet annihilation. In solution, we can vary the concentration, so the decay can go from triplet-triplet dominated to T1-S0 decay. Because the ground state
typically has the singlet characteristic for conjugated polymers and oligomers, direct optical absorption can only access singlet excited states. The decay from S1 to S0has been studied by
various experimental and theoretical methods. The T1state can
also be populated by optical excitation through intersystem crossing. In general, the ISC yield depends on the chain length and can be enhanced in the presence of heavy atoms.20,24The
subsequent triplet state decay from T1 to S0 is generally
nonradiative at room temperature. The T1 to S0 transition
generally exhibits a much longer lifetime and nonradiative characteristics at room temperature.
Intersystem crossing provides a way to reach the triplet state in optical excitation experiments. Unon optical excitation, the triplet exciton can only be generated through intersystem crossing. The techniques include photoinduced absorption (PA) spectroscopy, photoacoustic calorimetry (PAC), single-molecule spectroscopy (SMS), singlet oxygen quenching, and femtosec-ond ground state recovery methods that have been applied to investigate the ISC and triplet energy of the conjugated oligomers and polymers. PA spectroscopy can be used to obtain the T1to Tntransition energy gap. However, it is not sufficient
to obtain ISC yields and T1values by only using the PA method;
combination with other measurements is needed. For example, magnetic resonance spectroscopy needs to be used to decide the T1energy,37whereas either varying the excitation power37
or PA frequency-modulation spectroscopy is needed to get the ISC yield.19-21 In addition, a well-known ISC yield from a
†Part of the “Sheng Hsien Lin Festschrift”.
‡Department of Physics, National Taiwan University. §Institute of Atomic and Molecular Sciences, Academia Sinica.
|Institute of Chemistry, Academia Sinica.
⊥Department of Chemistry, National Taiwan University.
#National Tsing Hua University.
10.1021/jp0740651 CCC: $37.00 © 2007 American Chemical Society Published on Web 08/16/2007
Downloaded by NATIONAL TAIWAN UNIV on September 2, 2009 | http://pubs.acs.org
standard compound can be used to compare with the unknown polymer to get its yield by triplet-triplet spectroscopy.22,23,35
The Barbara group has shown that SMS is a powerful tool to study the ISC rate on the microsecond time scale. However, it is difficult to perform SMS with nanosecond time resolution.43
In a single-oxygen quenching experiment, it is difficult to confirm the oxygen quantity and it is essential to assume that the triplet state quenching comes from nowhere other than the oxygen.38 The femtosecond ground state recovery method is
very similar to PA spectroscopy.18
Because the triplet exciton is generated via intersystem crossing, the energy level of triplet state ET1 is needed for
estimating the ISC rate. Phosphorescence measurement at low temperature offers an opportunity to determine the triplet state energy. At room temperature, the triplet decay is dominated by a nonradiative process and relaxed via releasing heat to the system. Hence, photothermal techniques are powerful to deter-mine the heat release processes and subsequently obtain the ISC rate. Time-resolved photoacoustic calorimetry and photothermal beam deflection (PBD), which monitor the heat release, are suitable methods to measure the nonradiative processes such as ISC and triplet excited state decay following direct photo-excitation.25,26PAC has been applied to study the photothermal
properties of molecules in gas and solution forms.27-30 The
principle of PAC is that the material absorbs the light and releases the heat to the solvent. The pressure wave can be generated by the thermal expansion of the solvent and detected by the high-frequency sensitive PZT microphone. Because of the bandwidth of detection and the acoustic echo from cuvette wall, the nonradiative decay processes occurring between the time window from 20 ns to 2µs will contribute to the PAC
signal. Typically, these will include the internal convention (from Sn to S1 and S1 to S0; Sn depends on the excited
wavelength) and ISC. In these relaxation processes, there are three unknown quantities: the nonradiative decay rate from S1
to S0, the ISC yield, and the T1energy level. The T1level can
be measured by the phosphorescence at 77 K. By combining the quantum yield measurements and the PAC results, both the S1to S0nonradiative and the ISC yields can be obtained.18Note
that the relaxation from Snto S0, typically occurring at sub-ps
to ps time scale, is dominated by nonradiative relaxation. PBD provides a complementary method to study the photo-thermal processes at longer time scale. The PBD method probes changes in the refractive index of the solution caused by heat release after pulsed laser excitation. The time window of PBD is from a few microseconds to milliseconds, thus the PBD signal can be used to measure the T1 to S0 transition, typically
occurring on a longer time scale than PAC can probe. Thus combining the PAC and PBD methods provides a powerful way to study the triplet state photophysics at room temperature.
In this work, ISC as well as the relaxations from the T1to S0
state of two model oligomers are reported. (E,E)-1,4-Bis[(2-benzyloxy)styryl]benzene (PVDOP) and ter(9,9′-spirobifluorene) (TSBF) (Figure 1) are p-phenylenevinylene and fluorene based oligomers with different rigidities. The results show that both oligomers have similar decay channels, but the ISC yields are substantially different.
Experimental Section
Materials. (E,E)-1,4-Bis[(2-benzyloxy)styryl]benzene (PV-DOP) and ter(9,9′-spirobifluorene) (TSBF) were synthesized according to the previous report.31 The compounds were
synthesized by the Pd-catalyzed cross coupling reaction (Suzuki reaction). The product was isolated by column chromatography
on silica gel and purified by high vacuum sublimation. Most of the metal trace was removed by the purification processes.31
Compounds synthesized by similar methods have been checked by EDX analysis and show no metal trace. These two oligomers were dissolved in toluene or 2-methyltetrahydrofuran (MTHF) for 24 h at 50°C under a nitrogen environment. The solutions were then filtered through a 50µm filter. Because the common
solvents will become opaque and scatter both the excitation and emission light at a low temperature of 77 K, they are not suitable for low temperature measurements. The solvent 2-methyltet-rahydrofuran is transparent even at 77 K, it is suitable for measurements at 77 K. It is noted that the toluene and 2-methyltetrahydrofuran solutions showed similar emission spectra at room temperature for both oligomers. This implies the molecular conformation is similar for the oligomers dis-solved in toluene or 2-methyltetrahydrofuran.
Apparatus. For the PAC and PBD experiments, both signals were acquired simultaneously in the current apparatus. The light source, operated at 355 nm, is the third harmonic of a Q-switch Nd:YAG laser (New Wave Research). The excitation power was ∼200 µJ. The sample was maintained at a temperature of 20 ( 0.5°C. Samples were measured by comparing to the calorimetric reference compound, 2-hydroxybenzophenone (2-HBP), which will release all the energy absorbed upon photoexcitation as heat within the laser pulse width with a quantum efficiency of 1.0.27The optical densities (O.D.) of the samples were prepared
in the range 0.10-0.35. The O.D. of the reference solutions was prepared and carefully matched with the sample solutions. The photoacoustic pressure wave was detected by using a microphone with a 1 MHz bandwidth (GE Panametrics V-103), which is sensitive to the relaxation processes between 20 ns to a few microseconds.32 The microphone was mounted in the
sidewall of the cuvette. In the PBD experiments, the He-Ne laser (632.8 nm) was used as the probe beam for measuring changes in the refractive index of the solution subsequent to pulse laser excitation. The deflection of the probe beam due to the changes of the refractive index of the solution was detected by a split-photodiode detector. Both the PAC and PBD signals from 100 shots were averaged and recorded using a digital oscilloscope.
Time-resolved fluorescence measurements were performed by using a time-correlated single photon counting (TCSPC) apparatus with a time resolution of∼40 ps. The excitation pulses were generated by frequency double of a femtosecond Ti-sapphire laser. The excitation power used was less than 0.5 mW (∼7 pJ per pulse).
Figure 1. Chemical structure of (a) (E,E)-1,4-bis[(2-benzyloxy)styryl]-benzene (PVDOP) and (b) Ter(9,9′-spirobifluorene) (TSBF).
Downloaded by NATIONAL TAIWAN UNIV on September 2, 2009 | http://pubs.acs.org
The phosphorescence of the oligomers at 77 K was detected by an intensified CCD (PIMAX, Gen II) equipped with a monochromator. The steady state absorption and fluorescence spectra were measured by the GBC Cintra-20 and Jobin Yvon FL3-21 instruments, respectively.
Results and Discussion
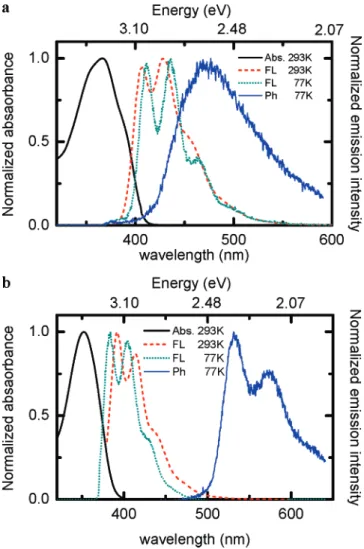
Figure 2a shows the absorption, fluorescence (FL), and phosphorescence (Ph) spectra of the PVDOP (<10-5 M) at various temperatures in 2-methyltetrahydrofuran (MTHF) solu-tion. The absorption maximum is at 366 nm and the first emission peak is at 407 nm. At a low temperature of 77 K, the first emission peak revealed a little red-shift of∼6 nm compared with that at 293 K. The torsional and vibrational modes between adjacent backbone units or aggregations are reduced at 77 K, which results in the planar conformation and leads to the reshift spectrum. The red shift had been observed with similar oligomers and polymers.22,33Also, the emission peaks in the
FL spectrum become sharper, probably due to the reduced thermally vibrational relaxation at 77 K. The Ph spectrum was recorded from 100µs to 100 ms after photoexcitation, and its
emission maximum appeared at 475 nm. Figure 2b shows the absorption, FL, and Ph spectra of TSBF (<10-5M) in MTHF solution. The absorption maximum is at 352 nm and the first emission peak is at 392 nm. At 77 K, the FL spectrum is blue-shifted by∼9 nm compared with that of 293 K, which indicates the twist dihedral angle is more acute between the neighbor
benzene. The main vibronic splitting of 170 meV results from the CdC stretching mode of TSBF. The Ph of TSBF (peak at 532 nm), under similar experimental conditions, is stronger in intensity and the vibrational structure is more significant compared to that of PVDOP.
For PAC, PBD, and TCSPC studies, both oligomers were dissolved in toluene solution. Note that the first emission peak for PVDOP and TSBF dissolved in toluene are located at 408 nm (3.04 eV) and 398 nm (3.11 eV), respectively. To derive ISC yields from PAC and PBD data, it is essential to know the triplet state T1energy.18,25The phosphorescence measurement
described in the previous section is used to determine the T1
energy level. Thus there are two environmental effects, solvent and temperature, that should be considered before combining the results from these measurements. The room-temperature FL spectra (not shown here) are similar for both oligomers dissolved in MTHF or toluene, indicating similar photophysics in different solvents. Thus, it is reasonable to assume the Ph spectra are also similar in both solvents. In both oligomers, the FL spectra only show a slight shift measured at different temperatures (Figure 2a,b). Because the signals of the PAC and PBD were measured at room temperature while the Ph was collected at 77 K, the uncertainty of the T1 energy level is ∼(0.03 eV.
This uncertainty is estimated on the basis of the fluorescence spectrum shift from 293 to 77 K.
Figure 3a shows the PAC results of PVDOP and TSBF in toluene measured at 293 K. The PAC profiles of PVDOP and TSBF are normalized to the amplitude of reference 2-HBP. The normalized PAC amplitudes of PVDOP and TSBF are 0.230 ( 0.018 and 0.200 ( 0.018, respectively. There is no phase difference in PAC signal among PVDOP, TSBF, and reference solutions. This indicates that there is no other heat release process detected within a few microseconds for PVDOP and TSBF solutions after nanosecond laser excitation. The results of PAC indicated there is no volume change, which is confirmed by the PBD experiments later. The amplitude of the PAC signal only corresponds to the nonradiative decay, including the intersystem crossing rate from S1to T1(kISC) and nonradiative
decay rate from S1to S0(k1) and Snto S1. From the PAC result,
the relation of kISCand k1could be written as25
ESnis 3.49 eV, corresponding to the laser pulse of 355 nm, and
k is the total decay rate of the S1state. TCSPC was then utilized
to measure the total decay rate of these two oligomers.
where kfis the fluorescence decay rate.
The quantum yield for singlet emission of TSBF, 0.85, had been reported by Wong et al.31Using TSBF as the standard,
the quantum yield for singlet emission of PVDOP was measured at various concentrations with O.D. < 0.1 by a fluorescent spectrometer and is shown in the inset of Figure 3a. In the inset, the slope for the sample is proportional to the fluorescence quantum yield of the TSBF. The result shows the two oligomers have similar fluorescence quantum yields. The fluorescence quantum yield of PVDOP is estimated to be∼0.86. By the combination of PAC, TCSPC, and Q.Y. measurement, the individual ISC yields of∼0.030 ( 0.02 and 0.06 ( 0.02 were obtained for PVDOP and TSBF, respectively. Note that not all the nonradiative decay can be detected by the PAC. The T1to Figure 2. UV-vis absorption (293 K), fluorescence and
phosphores-cence spectra (293 and 77 K) of (a) PVDOP and (b) TSBF excited at 355 nm in the MTHF solution.
(
(ESn-S1) + (ES1-T1)×(
kISCk
)
+ (ES1-S0)×k1 k
)
/ESn) normalized PAC signal (1)k ) kf+ kISC+ k1 (2)
Downloaded by NATIONAL TAIWAN UNIV on September 2, 2009 | http://pubs.acs.org
S0decay, on the order of tens of microseconds is out of the
window of PAC, which is about a few microseconds. In addition, the S1 to S0 energy gap is used as the fluorescent
photon energy, instead of the averaged photon energy obtained from the fluorescence spectrum. This contribution will propagate
down to∼2% to the final step analysis. And this is within the error bar of our experiments.
Figure 3b shows the PBD profiles of PVDOP and TSBF, which are normalized to the amplitude of reference 2-HBP in the toluene. The normalized PBD amplitudes of PVDOP and TSBF are 0.260 ( 0.018 and 0.230 ( 0.018, respectively. The fluorescence quantum yield can be independently estimated by comparing the amplitude of the PBD signal for samples and the reference compound. The amplitude of the PBD signal implies the total release heat from Snto S0. The quantum yield
can be written as ESn - (ES1 × quantum yield) ) ESn ×
(amplitude of PBD signal) has been reported by Huang et al.25
The fluorescence quantum yields of PVDOP and TSBF are estimated to be∼0.85 ( 0.02 using the PBD data. It is almost the same with the low concentration fluorescent spectrometer method. Because the FL quantum yield determined by PAC and PBD is identical to the direct FL quantum yield measurements, this implies the signals from heat release to solvent dominate the photothermal signal in the experiments. The FL quantum yield deduced from the PBD is similar to the direct Q.Y. measurement. This indicates that there is no volume change in PBD measurements. Because PAC results are consistent with PBD studies, it is concluded that there is also no volume change in PAC. More importantly, the PBD result shows that there is a phase difference among PVDOP, TSBF, and reference solutions. In the inset of Figure 3b, the PBD signal of PVDOP is normalized to 1, revealing the time difference to the reference signal. The TSBF also exhibits a similar result (not shown here). The additional slow components could be resolved by using the deconvolution method.
The signals of the PAC and PBD are a convolution of the instrumental response function (R(t)) and a function representing the time evolution (S(t)) of the heat upon laser excitation. The form describing the signal can be written as H(t) ) R(t)*S(t). S(t) is often written as the summation of the single-exponential terms:
φi and τi are the amplitude and the decay time for the ith
component in the sum of exponentials. Because the heat release process of the reference compound is much faster than the instrumental response time, the signal of the reference compound is revealed as the instrumental response time function R(t). H(t), the total signal from the sample, is recorded by a digital oscilloscope. In the deconvolution for the PAC signal, the fitting result shows the decay is faster than 20 ns. From the result of PBD for the reference solution, the instrumental response time is several microseconds. The PBD can monitor the heat release process in the time range of microseconds to milliseconds. The fast process and the slow process are the fraction (compare with reference compound) of heat release from picoseconds to microseconds and microseconds to milliseconds, respectively. Thus the fast component includes the processes of Snto S1, S1
to S0, and S1to T1and the slow component is the process of T1
to S0. The slow component can be analyzed by the
deconvo-lution of the PBD signal. There are four free parameters (φ1, τ1, φ2, andτ2) used to fit the triplet state decay in the signal.
Because the PAC and PBD signals are recorded simultaneously, the fast component from PBD comes from the same source as that of the signal of PAC. The φ1andτ1are, respectively, the
amplitude and the decay time of the fast process recorded by PAC. In the slow component, φ2andτ2represent the amplitude Figure 3. (a) Photoacoustic waves of reference
2-hydroxybenzophe-none (black line), PVDOP (red line, 4.2 times enlarged), and TSBF (blue line, 4.2 times enlarged) in toluene solutions irradiated at 355 nm. The inset shows the plot of FL intensity vs absorbance for PVDOP (open circles) and TSBF (filled square). The slopes of PVDOP and TSBF are 1.08 and 1.06, respectively. (b) PBD waveform of reference 2-hydroxybenzophenone (black line), PVDOP (red line), and TSBF (blue line) in toluene solutions irradiated at 355 nm. The inset shows the normalized PVDOP signal to compare with the reference signal. (c) The deconvolution result of PBD signal for TSBF. Two components fast (red line) and slow (blue line) were resolved. The black line is the summation of fast and slow components. The φ1∼ 0.19 and
τ1< 20 ns were computed for the fast component. The φ2∼ 0.041
andτ2∼ 47 µs were computed for the slow component.
S(t) )
∑
i φi τi
e-t/τi (3)
Downloaded by NATIONAL TAIWAN UNIV on September 2, 2009 | http://pubs.acs.org
and the decay time of the process from T1 to S0. φ2 can be
obtained by subtracting the amplitude of the PAC from the amplitude of the PBD. The only free parameter, τ2, can be
determined from the fitting. The software program “Sound analysis 32” (Quantum Northwest Inc.) is used to fit the data. The program is based on the least-squares iterative reconvolution (LSIR) method. Figure 3c shows a representative deconvolution result for TSBF. Table 1 shows the kinetic analysis results from TCSPC, Q.Y., PAC, and PBD signals. The mean square error (MSR) 1.848e-7is calculated for PVDOP case. As a result, φ1
) 0.231 is very close to the PAC amplitude 0.230 and τ1)
18.25 ns is the instrumental response time (∼20 ns). φ2) 0.028
is also very close to the difference between the amplitude of PAC and PBD of 0.030. Consequently, the triplet state decay timeτ2is calculated as 60µs. For TSBF, the fitting MSR is
9.746e-6and the triplet state decay time is∼47 µs. φ1) 0.19
is very close to the PAC amplitude 0.20 (andτ1< 20 ns). φ2)
0.041 is slightly larger than 0.030 (the difference between the amplitude of PAC and PBD). By using the LSIR method, the triplet state decay rates of PVDOP and TSBF are 0.017 and 0.021 µs-1, respectively. The triplet state decay kinetics is extracted by recording the PAC and PBD signals simultaneously. The two oligomers exhibit similar ISC yields and triplet state decay rates at the room temperature.
The triplet state lifetime of a few to 100 µs of similar
oligomers, p-phenylenevinylene trimers with different side groups, have been reported by using triplet-triplet absorption and laser flash photolysis.22,23 For other types of oligomers,
R-oligothiophenes and oligopolyfurans, triplet state decay times of 20-100µs were measured by radiolysis energy transfer, flash
photolysis, and PAC.38,44For polymers, 92 and 108µs were
reported respectively for MEH-PPV and PFO by using the PAC and radiolysis energy transfer measurements.34The ISC yields
for oligomers of the similar structures with PVDOP have also been reported by Seixas de Melo et al. (∼0.5%-6.2%)22,23and
Candeias et al. (6%).39For polymers, the ISC yields of
MEH-PPV and PFO were reported to be∼1.2% and 3% in benzene solutions by the PAC and pulse radiolysis transfer.34,36The ISC
yields of PVDOP and TSBF are larger than the polymers with the same backbone units, MEH-PPV and PFO. The lifetimes of MEH-PPV and PFO have also been reported to be 330 and 430 ps, respectively.18,40From the above ISC yield and singlet
state decay lifetime, the ISC rates of MEH-PPV and PFO, 36 and 70µs-1, could be calculated. Although the ISC yield is different between PVDOP (TSBF) and MEH-PPV (PFO), both ISC rates are very close to the results shown in Table 1. This reason is that the polymer nonradiative decay rate is faster than that for the oligomer (the intrachain interaction would enhance the electron-phonon interaction), consequently increasing the total decay rate. If the ISC rates are the same in the oligomer and polymer, the ISC yield would be decreased dependence the total rate increase.
From the energy gap law, it may be expected that the molecule with a smaller ES1-T1energy gap should have a larger
ISC rate. However, from the results listed in Table 1, it is not the case. The ES1-T1energy gap of PVDOP was found to be
about half the value for TSBF, and the ISC rate of PVDOP was nearly a third compared to that of TSBF. On the other hand, as pointed out in the literature,45 the approximate form for
radiationless transition rate depends on the coupling to the vibration modes: the exponential energy dependence is derived from the weak coupling limit, and for the strong coupling limit, the radiationless transition rate has a Gaussian energy depen-dence that increases in a small energy gap and then decreases. The latter is very similar to the rate expressions for electron transfer46,47 and excitation energy transfer,48 both describe
transition between two states under the Golden rule with strong electron-lattice coupling by the nature of the problems. In the spectra shown in Figure 2, the PVDOP are seen to possess very different vibronic characters between the fluorescence and phosphorescence spectra. The phosphorescence spectrum has virtually no vibronic progression, and there is a larger distance between the onset of phosphorescence and the maximum position compared to that of fluorescence. Both characters indicate a nontrivial shift in their energy minima in the vibrational degrees of freedom between the S1and T1states, or
TABLE 1a
k
(µs-1)b (µskISC-1) (µsk-1f ) (µsk1-1) E(eV)S1-S0 E(eV)S1-T1
T1-S0 decay ratec (ms-1) PVDOP 855 26 (∼3%) 735 (∼86%) 94 3.04 0.42 17 (60µs) TSBF 1408 84 (∼6%) 1197 (∼85%) 127 3.11 0.78 21 (47µs) aAll the measurements were performed in toluene solution.bFrom
the TCSPC.cThe T
1- S0decay rate had been calculated by the PBD
signal deconvolution.
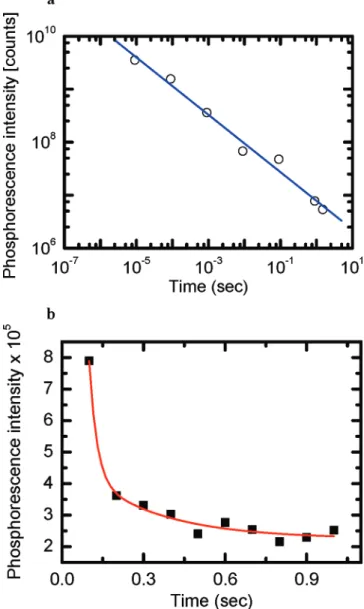
Figure 4. Phosphorescence of TSBF at (a) higher (OD∼ 2.4) (open circles) and (b) lower (OD∼ 0.06) (filled square) concentrations at 77K. In (a), the log-log plot shows a power law decay with a slope of -0.54. In (b), the linear-linear plot shows a two-exponential decays with decay times of∼27 and ∼300 ms with a fitting χ2) 0.990.
Downloaded by NATIONAL TAIWAN UNIV on September 2, 2009 | http://pubs.acs.org
a sign of a relatively strong electron-lattice coupling. In this case a small energy gap may not always lead to a large transition rate in the Gaussian energy gap law. Our present results cannot be conclusive without a more systematic study. Nevertheless, we feel that the slower ISC rate observed in the smaller-energy gap PVDOP may imply the validity of the strong-coupling Gaussian energy gap law in intersystem crossing.
Time-Resolved Phosphorescence Kinetics. Parts a and b of Figure 4 are the plots of the decay of the gate time window versus integrated Ph intensity at 77 K for high (O.D.∼ 2.4) and low (O.D.∼ 0.06) concentrations of TSBF solutions. The spectra were taken with an initial time delay of 500 ns after optical excitation and the subsequent increased gate widths are 1-10µs, 10-100 µs, 100 µs to 1 ms, 1-10 ms, 10-100 ms,
100 ms to 1 s, and 1-1.5 s in the high concentration measurements (time gate windows are 1-100 ms, 100-200 ms, 200-300 ms, ..., and 900 ms to 1 s in the low concentration measurements). The Ph decays revealed different behaviors in the two different concentrations of solutions. In Figure 4a, the time dependent intensity is fitted by a power law formula I∼ t-n, where n ) 0.5. In a high concentration of TSBF in MTHF, fluorescence and phosphorescence are simultaneously presented at the long time delay. However, if the triplet-triplet annihila-tion dominates the triplet state decay, the Monte Carlo simula-tion shows that n should be equal to 1.41Therefore, the power
law decay in phosphorescence is presumably related to the triplet-triplet annihilation. The n ) 0.5 exponent might be from the isolated oligomers in the 77 K MTHF solvent being extremely heterogeneously distributed, resulting from the fast cooling process. Thus, different from the room temperature solution, aggregations exist in the solution at 77 K. Even if the concentration decreases to O.D.∼ 0.06, the delay fluorescence could still be detected but the signal is greatly reduced. This indicates that the decay of triplet states is no longer dominated by the triplet-triplet annihilation. Two exponential decays, with time constants∼27 and 300 ms, could be used to fit the data shown in Figure 4b. The faster decay is related to the triplet-triplet annihilation effect, and the slower decay refers to the T1
to S0decay lifetime. There is 4 orders of magnitude difference
in the triplet state decay lifetime for the solutions at 77 K (300 ms) and 293 K (47µs). This implies that at room
temperature the Ph intensity is only∼0.01% of that at 77 K. Note that the Baessler group has shown that Ph decay dynamics in MeLPPP followed t-0.5in solution.49 For films, the decay
kinetic follows power laws that can range from t-0.8to t-2.50,51
We believe the power law behavior of the concentrated solution, shown in Figure 4a, is due to the heterogeneity of the samples, resulting in a broad distribution of triplet-triplet annihilation rates. This could mask the triplet to singlet decay observed in Figure 4b, the low concentration case.
Conclusion
In this work we combined various spectroscopic methods to measure the quantum yield, ISC yield, and the T1triplet decay
rate of the two typical oligomers. The ISC yields of PVDOP and TSBF are similar to the polymers with the same backbone structure (PV and fluorene based structure). The triplet state lifetime of PVDOP and TSBF (60 and 47µs) are faster than
that of the corresponding polymers.42The Ph decay at 77 K
shows that triplet states lifetime is 4 orders of magnitude longer than room temperature.
Acknowledgment. Financial support from the Ministry of Education (Grant Number 91-E-FA04-2-4A) and NSC is gratefully acknowledged.
References and Notes
(1) Jaiswal, M.; Menon, R. Polym. Int. 2006, 55, 1371.
(2) Zhang, M.; Tsao, H. N.; Pisula, W.; Yang, C. D.; Mishra, A. K.; Mullen, K. J. Am. Chem. Soc. 2007, 129, 3472.
(3) Mcculloch, I.; Heeney, M.; Bailey, C.; Genevicius, K.; Macdonald, I.; Shkunov, M.; Sparrowe, D.; Tierney, S.; Wagner, R.; Zhang, W. M.; Chabinyc, M. L.; Kline, R. J.; Mcgehee, M. D.; Toney, M. F. Nature Mater. 2006, 5, 328.
(4) Kanibolotsky, A. L.; Berridge, R.; Skabara, P. J.; Perepichka, I. F.; Bradley, D. D. C.; Koeberg, M. J. Am. Chem. Soc. 2004, 126, 13695. (5) Wang, H. Q.; Song, N.; Li, H. Y.; Li, Y. F.; Li, X. Y. Synth. Met. 2005, 151, 279.
(6) Sun, H. H.; Tong, H.; Hu, Y. F.; Su, G. P.; Cheng, Y. X.; Ma, D. G.; Wang, L. X.; Jing, X. B.; Wang, F. S. Synth. Met. 2003, 137, 1121. (7) Huynh, W. U.; Dittmer, J. J.; Alivisatos, A. P. Science 2002, 295, 2425.
(8) Granstrom, M.; Petritsch, K.; Arias, A. C.; Lux, A.; Andersson, M. R.; Friend, R. H. Nature 1998, 395, 257.
(9) Fuckel, B.; Hinze, G.; Diezemann, G.; Nolde, F.; Mullen, K.; Gauss, J.; Basche, T. J. Chem. Phys. 2006, 125, 144903.
(10) Smith, T. M.; Hazelton, N.; Peteanu, L. A.; Wildeman, J. J. Phys.
Chem. B 2006, 110, 7732.
(11) Nguyen, T. P.; Yang, S. H.; Gomes, J.; Wong, M. S. Synth. Met. 2005, 151, 269.
(12) Chi, C. Y.; Im, C.; Wegner, G. J. Chem. Phys. 2006, 124, 024907. (13) Ng, M. F.; Sun, S. L.; Zhang, R. Q. J. Appl. Phys. 2005, 97, 103513. (14) Kwasniewski, S. P.; Francois, J. P.; Deleuze, M. S. J. Phys. Chem.
A 2003, 107, 5168.
(15) Chang, R.; Hsu, J. H.; Fann, W. S.; Liang, K. K.; Chiang, C. H.; Hayashi, M.; Yu, J.; Lin, S. H.; Chang, E. C.; Chuang, K. R.; Chen, S. A.
Chem. Phys. Lett. 2000, 317, 142.
(16) Yang, L.; Feng, J. K.; Ren, A. M. J. Mol. Struct. (THEOCHEM) 2006, 758, 29.
(17) Beljonne, D.; Shuai, Z.; Pourtois, G.; Bredas, J. L. J. Phys. Chem.
A 2001, 105, 3899.
(18) King, S. M.; Rothe, C.; Dai, D.; Monkman, A. P. J. Chem. Phys. 2006, 124, 234903.
(19) Ford, T. A.; Avilov, I.; Beljonne, D.; Greenham, N. C. Phys. ReV.
B 2005, 71, 125212.
(20) Liao, H. H.; Yang, C. M.; Wu, C. H.; Horng, S. F.; Lee, W. S.; Meng, H. F.; Shy, J. T.; Hsu, C. S. Appl. Phys. Lett. 2007, 90, 013504.
(21) Hayer, A.; Khan, A. L. T.; Friend, R. H.; Kohler, A. Phys. ReV. B 2005, 71, 241302(R).
(22) de Melo, J. S.; Pina, J.; Burrows, H. D.; Brocke, S.; Herzog, O.; Thorn-Csanyi, E. Chem. Phys. Lett. 2004, 388, 236.
(23) de Melo, J. S.; Pina, J.; Burrows, H. D.; Di Paolo, R. E.; Macanita, A. L. Chem. Phys. 2006, 330, 449.
(24) Kohler, A.; Wilson, J. Org. Electron. 2003, 4, 179.
(25) Huang, Y. F.; Chen, H. L.; Ting, J. W.; Liao, C. S.; Larsen, R. W.; Fann, W. J. Phys. Chem. B 2004, 108, 9619.
(26) Poston, P. E.; Harris, J. M. J. Am. Chem. Soc. 1990, 112, 644. (27) Yeh, S. R.; Falvey, D. E. J. Photochem. Photobiol. AsChem. 1995,
87, 13.
(28) Larsen, R. W.; Miksovska, J. Coord. Chem. ReV. 2007, 251, 1101. (29) Chen, R. P. Y.; Huang, J. J. T.; Chen, H. L.; Jan, H.; Velusamy, M.; Lee, C. T.; Fann, W. S.; Larsen, R. W.; Chan, S. I. Proc. Nat.l Acad.
Sci. U.S.A. 2004, 101, 7305.
(30) Gensch, T.; Viappiani, C. Photochem. Photobiol. Sci. 2003, 2, 699. (31) Wong, K. T.; Hwu, T. Y.; Balaiah, A.; Chao, T. C.; Fang, F. C.; Lee, C. T.; Peng, Y. C. Org. Lett. 2006, 8, 1415.
(32) Rudzki, J. E.; Goodman, J. L.; Peters, K. S. J. Am. Chem. Soc. 1985, 107, 7849.
(33) Kong, F.; Wu, X. L.; Huang, G. S.; Yuan, R. K.; Yang, C. Z.; Chu, P. K.; Siu, G. G. Appl. Phys. AsMater. Sci. Proc. 2006, 84, 203.
(34) Burrows, H. D.; de Melo, J. S.; Serpa, C.; Arnaut, L. G.; Miguel, M. D.; Monkman, A. P.; Hamblett, I.; Navaratnam, S. Chem. Phys. 2002,
285, 3.
(35) Burrows, H. D.; Arnaut, L. G.; Pina, J.; de Melo, J. S.; Chatto-padhyay, N.; Alcacer, L.; Charas, A.; Morgado, J. Chem. Phys. Lett. 2005,
402, 197.
(36) Burrows, H. D.; de Melo, J. S.; Serpa, C.; Arnaut, L. G.; Monkman, A. P.; Hamblett, I.; Navaratnam, S. J. Chem. Phys. 2001, 115, 9601.
(37) Osterbacka, R.; Wohlgenannt, M.; Chinn, D.; Vardeny, Z. V. Phys.
ReV. B 1999, 60, 11253(R).
(38) Fonseca, S. M.; Pina, J.; Arnaut, L. G.; de Melo, J. S.; Burrows, H. D.; Chattopadhyay, N.; Alcacer, L.; Charas, A.; Morgado, J.; Monkman, A. P.; Asawapirom, U.; Scherf, U.; Edge, R.; Navaratnam, S. J. Phys. Chem.
B 2006, 110, 8278.
(39) Candeias, L. P.; Wildeman, J.; Hadziioannou, G.; Warman, J. M.
J. Phys. Chem. B 2000, 104, 8366.
(40) Samuel, I. D. W.; Rumbles, G.; Collison, C. J. Phys. ReV. B 1995,
52, 11573.
Downloaded by NATIONAL TAIWAN UNIV on September 2, 2009 | http://pubs.acs.org
(41) Hayer, A.; Bassler, H.; Falk, B.; Schrader, S. J. Phys. Chem. A 2002, 106, 11045.
(42) Monkman, A. P.; Burrows, H. D.; Hartwell, L. J.; Horsburgh, L. E.; Hamblett, I.; Navaratnam, S. Phys. ReV. Lett. 2001, 86, 1358.
(43) Lee, Y. J.; Kim, D. Y.; Grey, J. K.; Barbara, P. F. ChemPhysChem 2005, 6, 2404.
(44) de Melo, J. S.; Silva, L. M.; Arnaut, L. G.; Becker, R. S. J. Chem.
Phys. 1999, 111, 5427.
(45) Englman, R.; Jortner, J. Mol. Phys. 1970, 18, 145.
(46) Marcus, R. A. J. Chem. Phys. 1956, 24, 966. (47) Marcus, R. A. Discuss. Faraday Soc. 1960, 29, 21. (48) Fo¨rster, T. Ann. Phys. (Leipzig) 1948, 2, 55.
(49) Romanovskii, Y. V.; Gerhard, A.; Schweitzer, B.; Scherf, U.; Personov, R. I.; Bassler, H. Phys. ReV. Lett. 2000, 84, 1027.
(50) Hertel, D.; Romanovskii, Y. V.; Schweitzer, B.; Scherf, U.; Bassler, H. Synth. Met. 2001, 116, 139.
(51) Hertel, D.; Bassler, H.; Guentner, R.; Scherf, U. J. Chem. Phys. 2001, 115, 10007.
Downloaded by NATIONAL TAIWAN UNIV on September 2, 2009 | http://pubs.acs.org