P
ROBABILISTIC
F
AILURE
A
NALYSIS OF
T
RANSVERSELY
L
OADED
L
AMINATED
C
OMPOSITE
P
LATES
U
SING
F
IRST
-O
RDER
S
ECOND
M
OMENT
M
ETHOD
By S. C. Lin
1and T. Y. Kam
2ABSTRACT: A method for the probabilistic failure analysis of laminated composite plates with random system parameters subject to transverse loads is presented. System parameters such as material properties, plate thick-ness, and lamina strengths of a laminated composite plate are treated as baseline random variables. The statistics of the baseline random variables obtained from experiments are used in a stochastic finite-element analysis for computing the statistical moments of stresses in the laminated composite plate. An appropriate failure criterion from which the statistical moments of first-ply failure load are derived via a first-order second moment method is used to construct the limit state equation of the plate in the probabilistic failure analysis. The reliability of the laminated plate is then computed using an assumed probability distribution function of the first-ply failure load. The feasibility and accuracy of the present method are validated by the experimental data of centrally loaded laminated composite plates with different layups. The suitability of several commonly used failure criteria for reliability analysis of laminated composite plates is also investigated by means of several examples.
INTRODUCTION
Laminated composite panels/plates have found broad appli-cations in the construction of automobile, mechanical, space, and marine structures in recent years. The use of laminated composite panels/plates in fabricating these structures has re-sulted in a significant increase in payload, weight reduction, speed, maneuverability, and durability. In pursuing these achievements, the reliability analysis of laminated composite panels/plates has thus become an important topic of research. Recently, a number of researchers have studied the reliability of composite laminates composed of various random param-eters subjected to different types of loads. For instance, Sun and Yamada (1978) and Cederbaum et al. (1990) studied the failure probability of composite laminates with random strength parameters subjected to in-plane loads. Cassenti (1984) studied the first-ply failure probability and failure lo-cation of laminated composite beams and plates on the basis of the Weibull weakest link hypothesis. Kam and his associates (1992, 1993) and Engelstad and Reddy (1993) studied the re-liability of linear or nonlinear laminated composite plates with random material properties subjected to deterministic or ran-dom transverse loads. Gurvich and Pipes (1995) used a mul-tistep failure approach to study the failure probability of lam-inated composite beams subjected to bending. Lin et al. (1998) presented a procedure for reliability analysis of laminated composite plates with random material constants and uncertain stacking sequences subject to the failure modes of buckling and/or first-ply failure. In their study, the variabilities of ma-terial strength parameters were not considered and neither was the analytical method for reliability assessment validated by experimental results. On the other hand, Kam and Chang (1997) presented different methods, which were formulated on the basis of either dependent or independent failure criteria, to predict the failure probability of laminated composite plates with random strength parameters subjected to transverse loads. In their study, however, the variabilities of material constants
1
Assoc. Prof., Dept. of Power Mech. Engrg., Nat. Hu-wei Inst. of Tech-nol., Yunlin 632, Taiwan, Republic of China.
2Dept. of Mech. Engrg., Nat. Chiao Tung Univ., Hsin Chu 300, Taiwan,
Republic of China.
Note. Associate Editor: Ross B. Corotis. Discussion open until January 1, 2001. To extend the closing date one month, a written request must be filed with the ASCE Manager of Journals. The manuscript for this paper was submitted for review and possible publication on June 1, 1998. This paper is part of the Journal of Engineering Mechanics, Vol. 126, No. 8, August, 2000. 䉷ASCE, ISSN 0733-9399/00/0008-0812–0820/ $8.00⫹ $.50 per page. Paper No. 18484.
and geometric parameters were not considered, and thus in some cases significant differences between the theoretical and experimental reliabilities had been observed (e.g., percentage difference greater than 11%). Though much work has been performed in this area, more efforts are still needed; in partic-ular, the combined effects of uncertainties in lamina strengths, material properties, and plate thickness on the reliability of composite laminates should be studied thoroughly if highly reliable composite structures are to be designed.
In this paper, a method is developed for the reliability anal-ysis of laminated composite plates with random system eters. Material properties, plate thickness, and strength param-eters are treated as baseline random variables in a stochastic finite-element analysis for determining the statistics of stresses in a laminated composite plate. First-ply failure is chosen as the limit state and a phenomenological failure criterion is used to construct the limit state equation of the laminated composite plate in the reliability analysis. Experimental first-ply failure load data of centrally loaded laminated composite plates with different lamination arrangements are used to verify the ac-curacy of the proposed method. The suitability of the failure criterion adopted in constructing the limit state equation is investigated via the comparative study between the theoretical and experimental reliability predictions.
UNCERTAINTY IN COMPOSITE LAMINATES
A composite laminate is a stack of layers of fiber-reinforced laminae. The fiber-reinforced laminae are made of fibers and matrix that are of two different materials. The way in which the fibers and matrix materials are assembled to make a lam-ina, as well as the layup and curing of laminae, are compli-cated processes and may involve a lot of uncertainty. There-fore, the material properties of a composite laminate are random in nature. In the present stochastic finite-element method (SFEM), the elastic moduli (E1, E2,12, G12, G13, G23)
of the material are treated as independent baseline random var-iables, and their statistics are used to predict the mechanical behavior of the composite laminate. In the first-ply failure analysis of the laminated composite plate, the lamina strengths (XT, Xc, YT, Yc, R, S ) of the material are also treated as
inde-pendent baseline random variables. It is worth noting that, since the determination of the degree of dependence among the baseline random variables is a difficult though not intrac-table task, the adoption of the independence assumption can greatly simplify the reliability assessment procedure. In fact, the results obtained from the following reliability assessment
will show that the independence assumption is acceptable. Fur-thermore, fiber orientations and thicknesses of laminae may fluctuate in the vicinity of the prescribed values depending on the manufacturing process. In the previous study (Lin et al. 1998), it has been shown that the small variations of fiber orientations have insignificant effects on the variation of the laminate strength. Hence, without loss of generality, fiber ori-entations are treated as constants while laminate thickness h is considered to be random. Herein, all the lamina thicknesses in the plate model are taken to be equal and the uncertainty of each lamina can be expressed in the following form:
¯h
t = (1⫹ ) (1)
N
where stands for the zero mean random variable for h; =¯h
mean value of h; and N = number of layers.
From now on,␣i (i = 1, 2, . . . , 13) will be used to denote
the baseline random variables in which ␣i (i = 1, 2, . . . , 6)
are the material properties E1, E2, 12, G12, G13, and G23,
re-spectively;␣i(i = 8, . . . , 13) are the lamina strengths XT, Xc,
YT, Yc, R, and S, respectively; and␣7= h. The aforementioned
uncertainties in the mechanical properties and the thicknesses of composite laminae can cause variations in the elements of the constitutive matrix of the laminate, H, where
Aij Bij
H =
冋 册
(2)Bij Dij
The elements Aij, Bij, and Dijare given by h/2 (q) 2 (A , B , D ) =ij ij ij
冕
Q (1, z, z ) dzij (i, j = 1, 2, 6) (3) ⫺h/2 h/2 (q) ¯ ¯ A = k k A , A =ij l r ij ij冕
Qij dz (l = 6⫺ i, r = 6 ⫺ j; i, j = 4, 5) ⫺h/2 (4)The stiffness coefficients, (q) depend on the material
prop-Q ,ij
erties and orientation of the qth layer. The parameters k1 and
k2are the shear correction factors. Definitions and descriptions
of the aforementioned elastic moduli, lamina strengths, and stiffness coefficients can be found in Appendix I. Since the stiffness of the laminated plate is uncertain, the stresses in-duced in the laminated plate are also random variates of which the statistical moments will be derived from those of the base-line random parameters in a stochastic finite-element analysis.
STOCHASTIC FINITE-ELEMENT ANALYSIS
The present stochastic finite-element analysis of laminated composite plates with random parameters if formulated on the basis of the first-order shear deformation theory (Mindlin 1951) and the mean-centered second-order perturbation tech-nique. It is noted that the spatial variability of composite lam-inates made with prepreg tapes and fabricated via the auto-clave molding approach is generally small and can be neglected in the reliability analysis. Therefore, spatial vari-ability is not considered in the following stochastic finite-el-ement formulation. The shear deformable finite elfinite-el-ement de-veloped by Kam and Chang (1992a,b) is used to derive the stochastic finite element. The element can be applied to the analyses of both thin and moderately thick laminated compos-ite plates, and it contains five degrees of freedom (three dis-placements and two slopes, i.e., shear rotations) per node. In evaluating the terms in the element stiffness matrix, a quad-ratic (8 nodes) element of the serendipity family (Cook et al.
1989) with a reduced integration of 2⫻ 2 Gauss rule is used
in the finite-element formulation. The load-displacement re-lation of a laminated composite plate is expressed as
KD = P (5)
where K = structural stiffness matrix; D = vector of nodal displacements; and P = vector of nodal forces. Detailed deri-vation of the stochastic finite-element method has been ported in the literature (e.g., Lin and Kam 1992). A brief re-view of the method is given as follows.
Based on the mean-centered second-order perturbation tech-nique, the stiffness matrix, K, is expanded in terms of the random variables␣i (i = 1, 2, . . . , 7), which represent
struc-tural uncertainty in the plate, as
7 7 7 1 (0) (1) (2) K = K ⫹
冘
K,i␦␣ ⫹i冘冘
K,ij␦␣ ␦␣i j (6) 2 i =1 i =1 j =1where␦␣i = ␣i ⫺ ␣¯i with␣¯i denoting the mean value of the
random variable␣i; K
(0)
= zeroth-order structural stiffness ma-trix, which is identical to the deterministic structural stiffness matrix; (1)= first-order structural stiffness matrix with respect
K ,i
to random variables␣i; = second-order structural stiffness
(2) K ,ij
matrix with respect to random variables␣i and␣j; subscripts
,i denote the derivative of a function with respect to ␣i. The
nodal displacements are also influenced by the structural un-certainty; thus, the displacement vector possesses the similar expression 7 7 7 1 (0) (1) (2) D = D ⫹
冘
D,i␦␣ ⫹i冘冘
D,ij␦␣ ␦␣i j (7) 2 i =1 i = 1 j =1Substituting (6) and (7) into (5), truncating the third- and fourth-order terms, and equating equal order terms, the zeroth-, first-, and second-order equations are obtained, re-spectively, as (0) (0) K D = P (8) 7 (0) (1) (1) (0) [K D,i ⫹ K D ]␦␣ = 0,i i (9)
冘
i =1 7 7 1 (0) (2) (1) (1) 1 (2) (0) K D,ij ⫹ K D ⫹ K D,j ,i ,ij ␦␣ ␦␣ = 0i j (10)冘冘冋
i =1 j =1 2 2册
The zeroth- and first-order displacement vectors are evaluated from (8) and (9), respectively, as
(0) (0)⫺1
D = [K ] P (11)
and
(1) (0)⫺1 (1) (0)
D,i = [K ] [⫺K D ],i (12)
The expected value of the second-order displacement vector, is obtained by taking the expected value on both sides of
(2) D ,,ij (10): 7 7 1 (2) (0)⫺1 (1) (1) (2) (0) E [D ] =⫺[K ]
冘冘冋
K,jD,i ⫹ K D,ij册
E [␦␣ ␦␣ ]i j 2 i =1 j =1 (13a) where 7 7 1 (2) (2) D =冘冘
D,ij␦␣ ␦␣i j (13b) 2 i =1 j =1In view of (11) – (13), the mean value vector and the covari-ance matrix of the nodal displacements of (7) are obtained, respectively, as (0) (2) E [D]⬵ D ⫹ E[D ] (14) and 7 7 t (1) (1) t E [(D⫺ E[D])(D ⫺ E[D]) ] ⬵
冘冘
[D ][D ] E [,i ,j ␦␣ ␦␣ ]i j i =1 j =1 (15)where⬵ denotes an approximate equality.
Once the statistical moments of the nodal displacements have been obtained from (14) and (15), the stress statistics can be evaluated using the stress-strain and strain-displacement re-lations. The second-order approximation of the expected value of the stress vector is
(0) (2)
E [] ⬵ ⫹ E[ ] (16)
and the covariance matrix of the stresses is
7 7
t (1) (1) t
E [( ⫺ E[])( ⫺ E[]) ] ⬵
冘冘
[ ][ ] E[␦␣ ␦␣ ],i ,j i j i =1 j =1(17)
where (0)
, ,(1) and (2) = zeroth-, first-, and second-order
,i ,ij
stress vectors, respectively.
FIRST-PLY FAILURE LOAD
A composite laminate is assumed to fail when any ply in the laminate fails. The first-ply failure load of the laminate is determined in the first-ply failure analysis in which an
appro-priate failure criterion is adopted. Let p be defined as the
strength ratio, which is the ratio of the failure stress to the corresponding applied stress. The failure criterion (Tsai and Hahn 1980) at any point in the laminate can be written as
2 2 2 2 2 2
(F ⫹ 2F ⫹ F ⫹ F ⫹ F ⫹ F )p 11 1 12 1 2 22 2 44 4 55 5 66 6
⫹ (F ⫹ F ) ⫺ 1 = 0p 1 1 2 2 (18)
where strength parameters Fij and Fi = functions of lamina
strengths; 1 and2 = normal stresses in directions 1 and 2,
respectively; and4,5, and6 = shear stresses in planes 23,
13, and 12, respectively. The point that possesses the maxi-mum strength ratio in the laminate is defined as the most crit-ical point. The strength ratio of the most critcrit-ical point denotes a quantitative measure of the safety margin of the laminate, i.e., if the ratio is two, it means that the applied load can be doubled before failure occurs. Therefore, it is obvious that the strength ratio of the most critical point in the laminated com-posite plate subjected to a unit load is equivalent to the first-ply failure load of the plate. In the probabilistic failure anal-ysis, it is assumed that failure only initiates at the most critical point in the laminate. For a laminated composite plate with random system parameters, the first-ply failure load of the plate is also random in nature and its statistical moments can be inferred from those of the baseline random variables using the mean-centered second-order perturbation technique and the stochastic finite-element method. Following the same proce-dure as described in the previous section, the mean and vari-ance of the strength ratio at the most critical point in the lam-inated plate can then be expressed, respectively, as
13 13 1 (0) (2) E [ ] ⬵ ⫹p p
冘冘
E[␦␣ ␦␣ ]p kl, k l (19) 2 k =1 l =1 and 13 13 2 (1) (1) E [( ⫺ E[ ]) ] ⬵p p冘冘
E[␦␣ ␦␣ ]p k, p l, k l (20) k =1 l =1Since all the baseline random variables are independent, (20) can be rewritten as
13
2 (1)2 2
SP=
冘
SP i, i (21)i =1
where and = variance and standard deviation of P,
2
SP Sp
respectively; and = variance of␣i. The zeroth-, first-, and
2 Si
second-order strength ratios in the above equations can be
de-termined from the truncated Taylor series form of (18) follow-ing the same procedure as described in the previous section.
Define the limit state function⌽ as
2 ⌽ = ⍀ ⫹ ⌳ ⫺ 1p p (22a) with 2 2 2 2 2 ⍀ = F ⫹ 2F ⫹ F ⫹ F ⫹ F ⫹ F 11 1 12 1 2 22 2 44 4 55 5 66 6 (22b) and ⌳ = F ⫹ F 1 1 2 2 (22c)
In view of (18), (22a) can be rewritten as
⌽ = 0 (23)
Expansion of⌽ in the truncated Taylor series gives
13 13 13 1 (0) (1) (2) ⌽ = ⌽ ⫹
冘
⌽ ␦␣ ⫹,i i冘冘
⌽ ␦␣ ␦␣,ij i j (24) 2 i =1 i =1 j =1where the zeroth-, first-, and second-order limit state function, i.e.,⌽(0),⌽ ,(1) and⌽ ,(2) are expressed, respectively, as
,i ,ij 2 (0) (0) (0) (0) (0) ⌽ = ⍀ ⫹ ⌳ ⫺ 1 = 0p p (25) 2 (1) (1) (0) (0) (0) (0) (1) (0) (1) ⌽ = (⌳ ⫹ 2 ⍀ ) ⫹ ( ⌳ ⫹ ⍀ ) = 0,i p i, p p ,i p ,i (26) (2) (2) (0) (0) (0) (1) (1) (0) ⌽ = (⌳ ⫹ 2 ⍀ ) ⫹ 2 ⍀,ij p ij, p p i, p j, (1) (1) (0) (1) (0) (2) (2) ⫹ (⌳ ⫹ 2 ⍀ ) ⫹ (⌳ ⫹ ⍀ )p i, ,j p ,j p ,ij ,ij (1) (1) (1) ⫹ (⌳ ⫹ 2⍀ ) = 0p j, ,i ,i (27)
It is noted that the zeroth-, first-, and second-order stress vec-tors obtained in the stochastic finite-element analysis have
been used in the evaluation of those of⍀ and ⌳. Herein the
zeroth-order strength ratio is obtained from (25) via the solu-tion of the following quadratic equasolu-tion:
2 (0) (0) (0) ⫺⍀ ⫹兹⍀ ⫹ 4⌳ (0) =p (0) (28) 2⌳
The first- and second-order strength ratios, (1) and ,(2) are
, ,
p i p ij
determined directly from (26) and (27), respectively. Finally the substitution of , ,(0) (1) and(2) into (19) and (20) gives
, ,
p p i p ij
the statistical moments (mean E [P] and standard deviation
of the first-ply failure load.
S )P
Herein, different failure criteria, namely, the Hoffman, Tsai-Hill, polynomial type maximum stress, and Tsai-Wu failure criteria, will be adopted in the above probabilistic failure anal-ysis of laminated composite plates. Expressions for
determin-ing the strength parameters Fij and Fi can be found in the
literature (Reddy and Pandey 1987). Since sensitivity analysis is an important part of structural reliability assessments, the effects of uncertainties of the baseline random parameters on the variation of first-ply failure load are studied using the fol-lowing sensitivity measure:
⭸Sp Si
=i (29)
⭸S Si p
whereiis defined as the relative sensitivity coefficient, which
is a measure of the fractional change of SP with respect to a
fractional change in Si; and ⭸ is the differential operator. In
view of (21), the above equation can be rewritten as
2
Si
(1)2
= i P i, S2 (30)
p
Based on the above equation, the baseline random variables that have significant effects on the variation of first-ply failure load can be identified.
TABLE 2. Experimental Statistics of First-Ply Failure Load of Composite Plates with Various Lamination Arrangements
Layup (1) Statistics 95% confidence intervals for mean (2) COV (%) (3) Chi-Squared Test Statistica Nor-mal (4) Lognor-mal (5) Weibull (6) 0 0 [0 /90 ]6 6 S 1,218.9⫾ 33.9 N 5.95 10.28 9.45 13.49 0 0 [45 /6⫺45 ]6 S 1,296.9⫾ 38.8 N 6.40 7.94 7.22 11.12 0 0 0 [0 /90 /0 ]2 9 S 1,841.1⫾ 40.4 N 4.69 13.40 12.51 18.13 0 0 0 [45 /⫺45 /45 ]2 9 S 2,092.6⫾ 65.2 N 6.47 7.26 6.59 10.44 a
For k = 5, m = 2, and the␣ risk at 0.005, 2
(1⫺ ␣; k ⫺ m ⫺ 1) = 10.6.
TABLE 1. Statistics of Random Parameters
Parameters (1)
95% confidence interval for mean
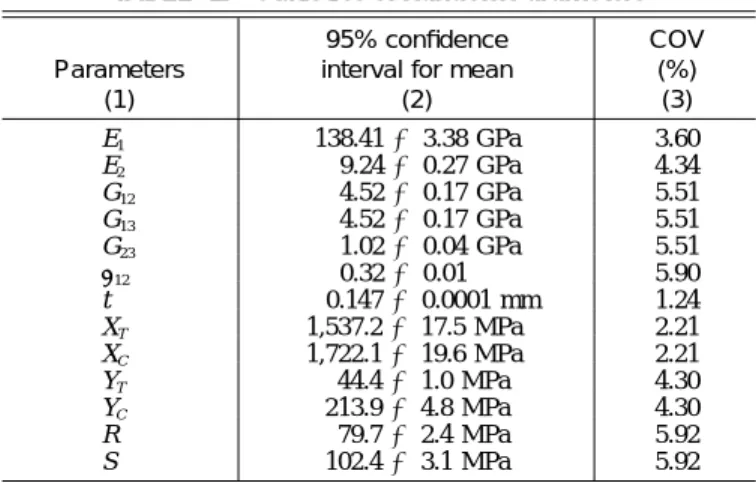
(2) COV (%) (3) E1 138.41⫾ 3.38 GPa 3.60 E2 9.24⫾ 0.27 GPa 4.34 G12 4.52⫾ 0.17 GPa 5.51 G13 4.52⫾ 0.17 GPa 5.51 G23 1.02⫾ 0.04 GPa 5.51 12 0.32⫾ 0.01 5.90 t 0.147⫾ 0.0001 mm 1.24 XT 1,537.2⫾ 17.5 MPa 2.21 XC 1,722.1⫾ 19.6 MPa 2.21 YT 44.4⫾ 1.0 MPa 4.30 YC 213.9⫾ 4.8 MPa 4.30 R 79.7⫾ 2.4 MPa 5.92 S 102.4⫾ 3.1 MPa 5.92 RELIABILITY ANALYSIS
In the present reliability study of a laminated composite plate, it is assumed that the plate is composed of identical laminae that possess the same material properties and fault size. The adoption of the material uniformity assumption in the reliability analysis excludes the consideration of size effect and ensures that the plate always fails at the most critical point where the failure probability is treated as that of the plate. The reliability assessment of a composite structure in general re-quires information on the probability distribution and not just on the statistical moments of the strength of the structure. In the above stochastic finite-element analysis of the composite laminate, however, only statistical moments of the strength ratio can be determined, while the type of probability distri-bution of the above strength ratio is indeterminate. Therefore, it is worth studying the effects of various probability distri-butions on the prediction of laminate reliability before any attempt in choosing the type of probability distributions for the strength variables is made. Letf (u)p and fp(v) be the
prob-ability density functions (pdf ) of the first-ply failure load of the plate and applied load P, respectively. The failure
proba-bility Pf of the laminated plate subject to first-ply failure is
determined from the following equation:
⬁ v
P =f
冕 冕
f (u)f (v) du dvp p (31)0 0
If P is deterministic and of magnitude Pc, then failure will
occur whenp< Pcand the above equation can be simplified
as
Pc
P =f
冕
f (u) dup (32)0
In the following analysis, three types of probability distribu-tions, namely, normal, lognormal, and Weibull distribudistribu-tions, will be adopted in (31) or (32) to evaluate the failure proba-bilities of a number of laminated composite plates.
EXPERIMENTAL INVESTIGATION
The statistics of material properties, laminate thickness, and lamina strength parameters required in the present analytical method were obtained from experimental measurements and testing. The material used in the present study was graphite/ epoxy (Q-1115) prepreg tapes supplied by the Toho Co.,
Ja-pan. A number of 30⫻ 30 cm composite laminates were made
using the vacuum bag molding method, in which the vacuum bagged laminate was cured by a hot press machine. Each cured laminate was then cut to make different types of specimens used for material characterization. The material properties and lamina strengths were determined from experiments conducted in accordance with the relevant ASTM standards (1990). The statistics of each lamina material parameter were determined from a set of 17 specimens that were prepared from 17 dif-ferent laminates. Thicknesses of difdif-ferent laminated plates were measured and the results used to determine the statistics of plate thickness as well as those of lamina thickness. The experimentally determined statistics of material properties, lamina strengths, and lamina thickness as well as the confi-dence intervals for their means with 95% conficonfi-dence level are tabulated in Table 1. Spatial variabilities of the baseline ran-dom variables within a laminated plate were also studied ex-perimentally. Thicknesses at different locations on a laminate were measured and a number of specimens cut from a laminate were used to determine each of the lamina parameters. The experimental results showed that, for the present composite laminates, the variabilities of the baseline random variables
within each laminate were usually small [coefficient of varia-tion (COV) less than 1%].
Tests of centrally loaded square 10⫻ 10 cm laminated
com-posite plates of various lamination arrangements, 0 0
[0 /90 ] ,6 6 S
and were performed
0 0 0 0 0 0 0 0
[45 /6⫺45 ] , [0 /90 /0 ] ,6 S 2 9 S 45 /⫺45 /45 ] ,2 9 S
to study the probability distribution of first-ply failure load for the plates. The laminate orientation code adopted herein has been reported in the composite literature (Tsai and Hahn 1980). The basis of the code is that ply angles, separated by slashes, are listed in order from the top surface to the bottom surface and enclosed in square brackets. The subscript S out-side the bracket denotes symmetric lamination, and the nu-merical subscript on a ply angle means the number of plies having the same orientation. In preparing the plate specimens,
each 20⫻ 20 cm laminate fabricated by the vacuum bag
mold-ing method was trimmed along the edges to make a 15⫻ 15
cm plate specimen for which the width of the clamped edges is 2.5 cm. Herein, around twenty specimens for each specific lamination arrangement were tested. The experimental appa-ratus for the first-ply failure testing consisted of a 10 ton In-stron testing machine, an acoustic emission (AE) system (AMS3 Vallen Systeme GmbH, Germany) with two AE sen-sors, a displacement gauge (LVDT), a data acquisition system, a steel load applicator with a spherical head of radius r = 5 mm, and a fixture for clamping the specimen. Detailed de-scription of the experimental setup and the testing procedure can be found in the literature (Kam et al. 1996, 1998). During testing, the stress waves measured by the AE system were used to identify the first-ply failure load of the laminated composite plates and the failure locations identified by the AE system were at the center of the laminated plates.
The variabilities of the experimental first-ply failure loads of the above laminated composite plates have been modeled by normal, lognormal, or Weibull distributions. The common features of the adopted probability distributions are that they
TABLE 3. Theoretical Statistics of First-Ply Failure Load Determined on Basis of Different Failure Criterion (1) 0 0 [0 /90 ]6 6 S Mean value (N) (2) COV (%) (3) 0 0 [45 /6⫺45 ]6 S Mean value (N) (4) COV (%) (5) 0 0 0 [0 /90 /0 ]2 9 S Mean value (N) (6) COV (%) (7) 0 0 0 [45 /⫺45 /45 ]2 9 S Mean value (N) (8) COV (%) (9) Maximum stress 1,156.1 (⫺5.1%) 5.99 (0.7%) 1,251.4 (⫺3.5%) 5.89 (⫺7.9%) 1,789.5 (⫺2.8%) 5.03 (7.2%) 1,967.0 (⫺6.0%) 5.95 (⫺8.0%) Tsai-Wu 1,213.2 (⫺0.5%) 6.31 (6.1%) 1,302.6 (0.4%) 6.15 (⫺3.9%) 1,892.6 (2.8%) 5.30 (13.0%) 2,097.0 (0.2%) 6.38 (⫺1.4%) Hoffman 1,147.3 (⫺5.9%) 5.99 (0.7%) 1,243.3 (⫺4.1%) 5.90 (⫺7.9%) 1,773.7 (⫺3.7%) 5.06 (7.8%) 1,947.5 (⫺6.9%) 6.00 (⫺7.2%) Tsai-Hill 1,179.7 (3.2%) 6.17 (3.7%) 1,279.6 (⫺1.3%) 6.09 (⫺4.8%) 1,934.9 (5.1%) 6.11 (30.1%) 2,042.7 (⫺2.4%) 6.33 (⫺2.2%)
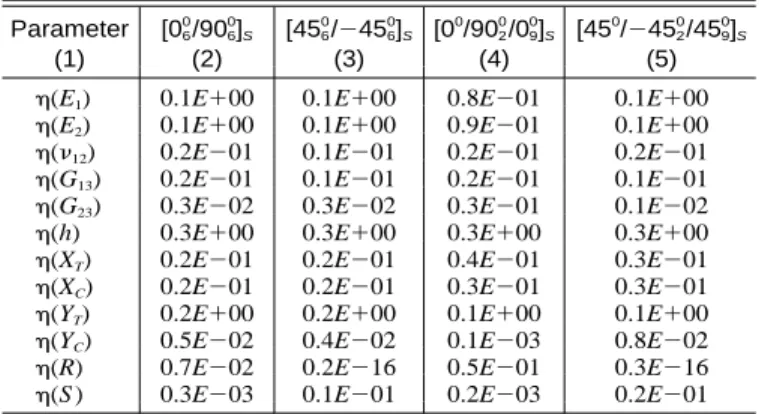
TABLE 4. Relative Sensitivity Coefficients Determined on Ba-sis of Tsai-Wu Criterion
Parameter (1) 0 0 [0 /90 ]6 6 S (2) 0 0 [45 /6⫺45 ]6 S (3) 0 0 0 [0 /90 /0 ]2 9 S (4) 0 0 0 [45 /⫺45 /45 ]2 9 S (5)
(E1) 0.1E⫹00 0.1E⫹00 0.8E⫺01 0.1E⫹00
(E2) 0.1E⫹00 0.1E⫹00 0.9E⫺01 0.1E⫹00
(12) 0.2E⫺01 0.1E⫺01 0.2E⫺01 0.2E⫺01
(G13) 0.2E⫺01 0.1E⫺01 0.2E⫺01 0.1E⫺01
(G23) 0.3E⫺02 0.3E⫺02 0.3E⫺01 0.1E⫺02
(h) 0.3E⫹00 0.3E⫹00 0.3E⫹00 0.3E⫹00
(XT) 0.2E⫺01 0.2E⫺01 0.4E⫺01 0.3E⫺01
(XC) 0.2E⫺01 0.2E⫺01 0.3E⫺01 0.3E⫺01
(YT) 0.2E⫹00 0.2E⫹00 0.1E⫹00 0.1E⫹00
(YC) 0.5E⫺02 0.4E⫺02 0.1E⫺03 0.8E⫺02
(R) 0.7E⫺02 0.2E⫺16 0.5E⫺01 0.3E⫺16
(S) 0.3E⫺03 0.1E⫺01 0.2E⫺03 0.2E⫺01
are tractable, smooth functions commonly used by practicing engineers and able to produce reasonable results for reliability assessments of mechanical/structural components. The statis-tics of the first-ply failure loads, the confidence intervals for the mean first-ply failure loads with 95% confidence level, and the chi-squared test statistics determined from the goodness-of-fit tests of different expected distributions of the first-ply failure loads for the laminated composite plates are listed in
Table 2. Furthermore, the critical value of the2
statistic for
a significance level of ␣ = 0.5%, which is 10.6, is also
tabu-lated in Table 2 for comparison. In general, both the confi-dence intervals for the means and the variations (COV less than 7%) of the first-ply failure loads of the laminated plates are small. When comparing the chi-squared test statistics listed in Table 2, it is obvious that among the adopted distributions the lognormal model is the best representation of the sample data for the plates because it always yields the smallest value of the test statistic. By engineering judgment, it seems reason-able to treat the lognormal distribution as the ‘‘true’’ distri-bution of the first-ply failure load of the laminated composite plates. Nevertheless, it is worth mentioning that the values of the chi-squared test statistics of the adopted probability distri-butions are quite large when compared with the critical value of 2
= 10.6 for␣ = 0.5%. The above hypothesis test results
imply that without the expense of engineering judgment, it is difficult to determine the true distribution for the first-ply load of the laminated plates. Therefore, it is recommended that ex-tensive tests of laminated composite plates and more sophis-ticate statistical analysis of the test data be performed in the future studies if a higher confidence level on the identified distribution of the first-ply failure load of the laminated com-posite plates is desired. The parameters of the experimental distributions of the first-ply failure loads of the laminated com-posite plates were determined from the sample data using the maximum likelihood method (Neter et al. 1988). Visual in-spection of the failed specimens was performed. A large matrix crack was always observed at the center of the lower surface of each specimen. The fact that all the plate specimens failed at the center of the plates validated the assumptions that these laminated plates only failed at the most critical point in the plates and that spatial variability was insignificant.
RESULTS AND DISCUSSION
The aforementioned probabilistic method for first-ply failure analysis is used to study the strength distribution and reliability of the laminated composite plates that have been tested. A 6 ⫻ 6 mesh in a full plate and clamped conditions at all edges are adopted in the stochastic finite-element analysis of the plates. The accuracy of the adopted stochastic finite-element method and the convergence of the finite-element mesh for first-ply failure analysis have been verified previously (Lin and Kam 1992; Kam et al. 1996). Different failure criteria are first used in turn to construct the limit state equation of the lami-nated plates in the probabilistic failure analysis. The theoreti-cally predicted statistical moments for the first-ply failure load of the laminated composite plates are listed in Table 3 for comparison. The negative signs ahead of the percentage
dif-ferences between the experimental and theoretical statistics specified within parentheses indicate that the theoretical pre-dictions are less than the experimental ones. It is noted that, irrespective of the type of failure criterion adopted in the prob-abilistic failure analysis, the present stochastic finite-element method can predict reasonably accurate mean first-ply failure loads of the laminated composite plates when compared with the experimental results. In particular, the differences between the theoretical and experimental mean first-ply failure loads for the cases using the Tsai-Wu criterion are less than 3%. Conversely, the differences between the theoretical and ex-perimental coefficients of variation may be small or large de-pending on the layup of the laminated composite plate and the type of failure criterion adopted in the analysis. In general, the polynomial type maximum stress criterion and Hoffman fail-ure criterion can yield reasonably accurate coefficients of var-iation (error less than or equal to 8%) for the laminated com-posite plates. At this point, it is not clear which failure criterion is the most suitable one to be used in the reliability analysis. Next consider the sensitivity analysis of the variation of the first-ply failure load for the laminated composite plates. The relative sensitivity coefficients derived from (30) are listed in Table 4. It is noted that the random parameters E1, E2, h, and
YT have more significant effects on the variation of the
first-ply failure load for the laminated composite plates than the other random parameters. Therefore, it is important to have tight control on the Young’s modulus of fiber, matrix proper-ties, plate thickness, and tensile strength of the matrix if higher reliability for the laminated composite plates is desired.
The probability distribution of first-ply failure load and the suitability of the failure criterion adopted in the reliability analysis of laminated plates are studied using the experimental first-ply failure load data. Based on the theoretically deter-mined statistical moments of the first-ply failure loads in Table 3, different probability density functions, namely, normal, log-normal, and Weibull, are adopted to simulate the distributions of the first-ply failure loads of the plates. The theoretically determined probability distributions of the first-ply failure loads of the plates are shown in Figs. 1 – 16 in comparison with the experimental results. It is noted that, irrespective of the type of probability distribution assumed for the first-ply
FIG. 1. Theoretical Probability Distributions of First-Ply Fail-ure Load of 0 0 Plate (Polynomial Type Maximum Stress
[0 /90 ]6 6 S
Criterion)
FIG. 2. Theoretical Probability Distributions of First-Ply Fail-ure Load of[0 /90 ]0 0 Plate (Tsai-Wu Criterion)
6 6 S
FIG. 3. Theoretical Probability Distributions of First-Ply Fail-ure Load of[0 /90 ]0 0 Plate (Hoffman Criterion)
6 6 S
FIG. 5. Theoretical Probability Distributions of First-Ply Fail-ure Load of[45 /0 0 Plate (Polynomial Type Maximum Stress
ⴚ45 ]
6 6 S
Criterion)
FIG. 6. Theoretical Probability Distributions of First-Ply Fail-ure Load of[45 /0 0 Plate (Tsai-Wu Criterion)
ⴚ45 ]
6 6 S
FIG. 7. Theoretical Probability Distributions of First-Ply Fail-ure Load of[45 /0 0 Plate (Hoffman Criterion)
ⴚ45 ]
6 6 S
FIG. 8. Theoretical Probability Distributions of First-Ply Fail-ure Load of 0 0 Plate (Tsai-Hill Criterion)
[45 /6ⴚ45 ]6 S
FIG. 4. Theoretical Probability Distributions of First-Ply Fail-ure Load of 0 0 Plate (Tsai-Hill Criterion)
[0 /90 ]6 6 S
FIG. 9. Theoretical Probability Distributions of First-Ply Fail-ure Load of 0 0 0 Plate (Polynomial Type Maximum Stress
[0 /90 /0 ]2 9 S
Criterion)
FIG. 10. Theoretical Probability Distributions of First-Ply Fail-ure Load of 0 0 0 Plate (Tsai-Wu Criterion)
[0 /90 /0 ]2 9 S
FIG. 11. Theoretical Probability Distributions of First-Ply Fail-ure Load of 0 0 0 Plate (Hoffman Criterion)
[0 /90 /0 ]2 9 S
FIG. 14. Theoretical Probability Distributions of First-Ply Fail-ure Load of 0 0 0 Plate (Tsai-Wu Criterion)
[45 /ⴚ45 /45 ]2 9 S
FIG. 13. Theoretical Probability Distributions of First-Ply Fail-ure Load of 0 0 0 Plate (Polynomial Type Maximum
[45 /ⴚ45 /45 ]2 9 S
Stress Criterion)
FIG. 12. Theoretical Probability Distributions of First-Ply Fail-ure Load of[0 /90 /0 ]0 0 0 Plate (Tsai-Hill Criterion)
2 9 S
failure load, the experimental first-ply failure load data of the plates with different layups can be well fitted by the theoretical probability distributions if the Tsai-Wu criterion is used in the first-ply failure analysis of the plates. As has been manifested in Table 3, the suitability of the Tsai-Wu criterion is attributed to the fact that it can accurately predict the mean-first-ply
fail-ure loads of the plates. As for the 0 0 and 0
[45 /6⫺45 ]6 S [45 /⫺
plates, the use of the Tsai-Hill criterion can also
pre-0 0
45 /45 ]2 9 S
dict reasonably accurate probability distributions of the first-ply failure load when compared with the experimental data.
Next consider the suitability of the assumed probability dis-tributions for reliability analysis. For real structures, the reli-ability of the structures is usually high, i.e., greater than 0.9. Since the addition of reliability and failure probability is equal to 1, it is thus worth studying the lower tails of the theoretical distributions in Figs. 1 – 16. It is noted that in general the
dif-ferences among the assumed probability distributions in reli-ability prediction are small. Nevertheless, the Weibull distri-bution always produces the lowest reliability (or highest failure probability) for the laminated plates when the case of a plate reliability greater than 0.9 is considered. This can be further illustrated by comparing the numerical values of the reliability of the laminated plates. Tables 5 – 7 list the reliabilities of the laminated plates determined on the basis of different failure criteria and various assumed probability distributions for the first-ply failure load. The experimental reliabilities given in these tables were determined from the experimental distribu-tions listed in Table 2. It is noted that, irrespective of the type of the assumed probability distribution, the use of the Tsai-Wu criterion can produce very accurate reliabilities for the plates with absolute difference less than 0.008 when compared with
TABLE 5. Reliabilities of Laminated Composite Plates Predicted by Different Failure Criteria Based on Normal Distribution Layup (1) Load (N) (2) PLATE RELIABILITY Theoretical Maximum stress (3) Tsai-Wu (4) Hoffman (5) Tsai-Hill (6) Experiment (7) 0 0 [0 /90 ]6 6 S 1,050 0.937 (0.053) a 0.983 (0.007) 0.922 (0.068) 0.963 (0.027) 0.990 0 0 [45 /6⫺45 ]6 S 1,110 0.972 (0.016) 0.992 (⫺0.004) 0.965 (0.023) 0.973 (0.015) 0.988 0 0 0 [0 /90 /0 ]2 9 S 1,650 0.939 (0.048) 0.992 (⫺0.005) 0.916 (0.071) 0.992 (⫺0.005) 0.987 0 0 0 [45 /⫺45 /45 ]2 9 S 1,800 0.923 (0.062) 0.987 (⫺0.002) 0.897 (0.088) 0.970 (0.015) 0.985 a
Difference between experimental and theoretical reliability.
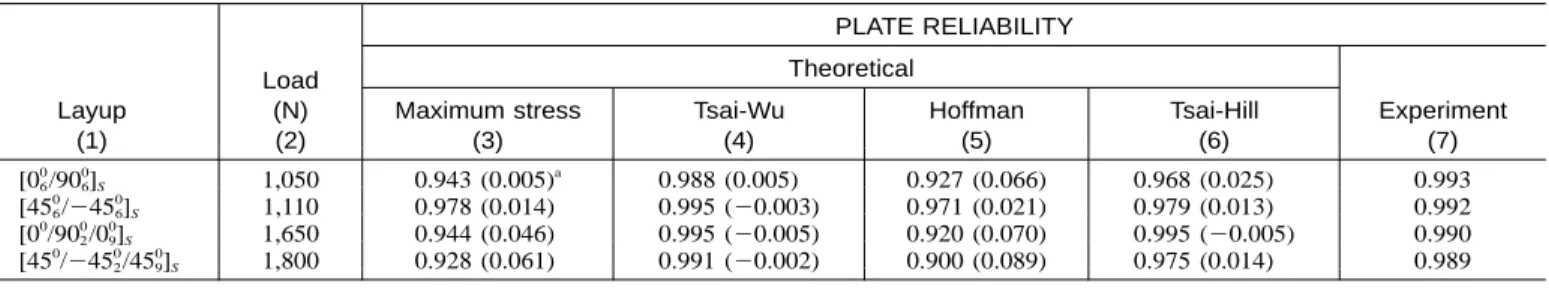
TABLE 6. Reliabilities of Laminated Composite Plates Predicted by Different Failure Criteria Based on Lognormal Distribution
Layup (1) Load (N) (2) PLATE RELIABILITY Theoretical Maximum stress (3) Tsai-Wu (4) Hoffman (5) Tsai-Hill (6) Experiment (7) 0 0 [0 /90 ]6 6 S 1,050 0.943 (0.005) a 0.988 (0.005) 0.927 (0.066) 0.968 (0.025) 0.993 0 0 [45 /6⫺45 ]6 S 1,110 0.978 (0.014) 0.995 (⫺0.003) 0.971 (0.021) 0.979 (0.013) 0.992 0 0 0 [0 /90 /0 ]2 9 S 1,650 0.944 (0.046) 0.995 (⫺0.005) 0.920 (0.070) 0.995 (⫺0.005) 0.990 0 0 0 [45 /⫺45 /45 ]2 9 S 1,800 0.928 (0.061) 0.991 (⫺0.002) 0.900 (0.089) 0.975 (0.014) 0.989 a
Difference between experimental and theoretical reliability.
FIG. 17. Coordinate Systems for Composite Lamina FIG. 16. Theoretical Probability Distributions of First-Ply
Fail-ure Load of 0 0 0 Plate (Tsai-Hill Criterion) [45 /ⴚ45 /45 ]2 9 S
FIG. 15. Theoretical Probability Distributions of First-Ply Fail-ure Load of 0 0 0 Plate (Hoffman Criterion)
[45 /ⴚ45 /45 ]2 9 S
the experimental results. The other failure criteria, however, may produce results for the plates with absolute difference up to 0.09. In the previous section, it has shown that the lognor-mal model can well fit the experimental first-ply failure load data. Here, it is also shown that the combined use of lognormal distribution and the Tsai-Wu criterion in the probabilistic
fail-ure analysis can well simulate the distribution of the first-ply failure loads of the plates, as shown in Figs. 2, 6, 10, and 14, and produce reasonably accurate reliabilities for the plates, as given in Table 6. On the other hand, it is again noted that amongst the assumed probability distributions, the Weibull dis-tribution usually produces the most conservative results for the plate reliability. For purpose of comparison, failure probabil-ities at other ponts in the laminated composite plates have been computed in this study. It has been found that, except at the most critical point, the failure probabilities at other locations are insignificant and have no eminent effect on the reliability of the plates. It is also worth noting that the theoretical reli-abilities in Tables 5 – 7 may vary slightly (less than 0.5%) if first-order rather than second-order approximations to the mean values of the displacements, stresses, and first-ply failure load are used in the reliability analysis.
CONCLUSIONS
A method was presented for probabilistic failure analysis and reliability assessment of laminated composite plates with random system parameters. The stochastic finite-element method, the first-order second moment methods, and a phe-nomenological failure criterion were used in the formulation of the present method, which only required statistical infor-mation on the material properties, lamina strengths, and plate thickness in the probabilistic failure analysis of composite lam-inates. Statistical moments of the baseline random variables and probability distributions of first-ply failure loads of
TABLE 7. Reliabilities of Laminated Composite Plates Predicted by Different Failure Criteria Based on Weibull Distribution Layup (1) Load (N) (2) PLATE RELIABILITY Theoretical Maximum stress (3) Tsai-Wu (4) Hoffman (5) Tsai-Hill (6) Experiment (7) 0 0 [0 /90 ]6 6 S 1,050 0.924 (0.050) a 0.966 (0.008) 0.911 (0.063) 0.945 (0.029) 0.974 0 0 [45 /6⫺45 ]6 S 1,110 0.954 (0.017) 0.977 (⫺0.006) 0.948 (0.023) 0.954 (0.017) 0.971 0 0 0 [0 /90 /0 ]2 9 S 1,650 0.925 (0.044) 0.977 (⫺0.008) 0.907 (0.062) 0.977 (⫺0.008) 0.969 0 0 0 [45 /⫺45 /45 ]2 9 S 1,800 0.912 (0.056) 0.970 (⫺0.002) 0.891 (0.077) 0.952 (0.016) 0.968
aDifference between experimental and theoretical reliability.
nated composite plates with different layups were determined from experiments. The experimental results were then used to verify the accuracy of the proposed method, to study the prob-ability distribution of first-ply failure load, and to investigate the suitability of the commonly used failure criterion. It was shown that the present method could produce reasonably ac-curate predictions of reliability for the laminated composite plates. This implies that the present method may have the po-tential to become a useful tool for the reliability design or assessment of laminated composite structures. Furthermore, it was found that, irrespective of the type of the failure criterion adopted in the reliability analysis, amongst the adopted prob-ability distributions, the use of the Weibull distribution in sim-ulating the distribution of first-ply failure load would yield a conservative prediction of reliability for the laminated com-posite plates. In contrast, irrespective of the types of the prob-ability distribution used for modeling the distribution of the first-ply failure load, the use of the Tsai-Wu criterion would yield excellent reliability predictions for the laminated com-posite plates. Since amongst the adopted probability distribu-tions the lognormal distribution can fit the experimental first-ply failure load data well, it seems appropriate to choose both the lognormal distribution and the Tsai-Wu failure criterion in the reliability analysis of laminated composite plates. Never-theless, it is recommended that extensive tests of laminated composite plates and more sophisticated statistical analysis of the test data be performed so that the suitability of the use of lognormal distribution in simulating the distribution of the first-ply failure load can be further validated. In the present study, a sensitivity analysis of the variation of the first-ply failure load was also performed. It was found that Young’s moduli of fiber and matrix, plate thickness, and the tensile strength of the matrix had significant effects on the variation of the first-ply failure load. Tight control on these parameters is required if high reliability of laminated plates is desired.
APPENDIX I. PROPERTIES OF COMPOSITE LAMINA
The material coordinate (1-2-3) system in Fig. 17 is used to describe the properties of a composite lamina.
1. Material constants:
• Ei = modulus of elasticity associated with the i
direc-tion
• ij= Poisson’s ratio
• Gij= shear modulus associated with the ij plane
2. Strengths:
• XT, XC= tensile and compressive strengths associated
with direction 1
• YT, YC= tensile and compressive strengths associated
with direction 2
• R = shear strength associated with planes 12 or 13 • S = shear strength associated with plane 23
3. Stiffness coefficients: • Q11= E1/(1⫺ 1221) • Q12= 12E2/(1⫺ 1221) = Q21 • Q22= E2/(1⫺ 1221) • Q44= G23 • Q55= G12= Q66 ACKNOWLEDGMENT
This research was supported by the National Science Council of the Republic of China under Grant No. NSC 87-2218-E009-021. Their sup-port is gratefully acknowledged.
APPENDIX II. REFERENCES
Cassenti, B. N. (1984). ‘‘Probabilistic static failure of composite mate-rial.’’ AIAA J., 22, 103–110.
Cederbaum, G., Elishakoff, I., and Librescu, L. (1990). ‘‘Reliability of laminated plates via the first-order second moment method.’’ J.
Com-pos. Struct., 15, 161–167.
Cook, R. D., Malkus, D. S., and Plesha, M. E. (1989). Concepts and
applications of finite element analysis, Wiley, New York.
Engelstad, S. P., and Reddy, J. N. (1993). ‘‘Probabilistic nonlinear finite element analysis of composite structures.’’ AIAA J., 31(2), 362–369. Gurvich, M. R., and Pipes, R. B. (1995). ‘‘Probabilistic analysis of
multi-step failure process of a laminated composite in bending.’’ Compos.
Sci. and Technol., 55, 413–421.
Kam, T. Y., and Chang, R. R. (1992a). ‘‘Finite element analysis of shear deformable laminated composite plates.’’ J. Energy Resour. Technol., 115, 41–46.
Kam, T. Y., and Chang, R. R. (1992b). ‘‘Buckling analysis of shear de-formable laminated composite plates.’’ J. Compos. Struct., 22, 223– 234.
Kam, T. Y., and Chang, E. S. (1997). ‘‘Reliability formulation for com-posite laminates subject to first-ply failure.’’ J. Compos. Struct., 38(1– 4), 65–70.
Kam, T. Y., and Sher, H. F. (1995). ‘‘Nonlinear and first-ply failure anal-ysis of laminated cross-ply plates.’’ J. Compos. Mat., 29, 463–482. Kam, T. Y., Sher, H. F., Chao, T. N., and Chang, R. R. (1996).
‘‘Predic-tions of deflection and first-ply failure load of thin laminated composite plates via the finite element approach.’’ J. Solids and Struct., 33, 375– 398.
Lin, S. C., and Kam, T. Y. (1992). ‘‘Reliability analysis of laminated composite plates.’’ Proc., NSC, Part A, 16, 163–171.
Lin, S. C., Kam, T. Y., and Chu, K. H. (1998). ‘‘Evaluation of buckling and first-ply failure probabilities of composite laminates.’’ J. Solids and
Struct., 35(13), 1395–1410.
Lin, S. C., Kam, T. Y., and Hsiao, K. M. (1993). ‘‘Reliability analysis of nonlinear laminated composite plate structures.’’ J. Compos. Struct., 25, 503–510.
Mindlin, R. D. (1951). ‘‘Influence of rotary inertia and shear on flexural motions of isotropic elastic plates.’’ J. Appl. Mech., 18, 31–38. Neter, J., Wasserman, W., and Whitmore, G. A. (1988). Applied statistics,
3rd Ed., Allyn and Bacon, Newton, Mass.
Reddy, J. N., and Pandey, A. K. (1987). ‘‘A first-ply failure analysis of composite laminates.’’ Comp. and Struct., 25, 371–393.
Sun, C. T., and Yamada, S. E. (1978). ‘‘Strength distribution of a unidi-rectional fiber composite.’’ J. Compos. Mat., 12, 169–176.
Tsai, S. W., and Hahn, H. T. (1980). Introduction to composite materials, Technomic Publishing, Lancaster, Pa.
![FIG. 12. Theoretical Probability Distributions of First-Ply Fail- Fail-ure Load of [0 /90 /0 ]000 Plate (Tsai-Hill Criterion)](https://thumb-ap.123doks.com/thumbv2/9libinfo/7775612.150513/7.918.498.831.864.1089/theoretical-probability-distributions-fail-fail-load-plate-criterion.webp)
![TABLE 7. Reliabilities of Laminated Composite Plates Predicted by Different Failure Criteria Based on Weibull Distribution Layup (1) Load(N)(2) PLATE RELIABILITYTheoreticalMaximum stress(3)Tsai-Wu(4)Hoffman(5) Tsai-Hill(6) Experiment(7) 0 0 [0 /90 ]6 6 S 1](https://thumb-ap.123doks.com/thumbv2/9libinfo/7775612.150513/9.918.80.853.73.217/reliabilities-laminated-composite-predicted-different-distribution-reliabilitytheoreticalmaximum-experiment.webp)
