This content has been downloaded from IOPscience. Please scroll down to see the full text.
Download details:
IP Address: 140.113.38.11
This content was downloaded on 28/04/2014 at 16:17
Please note that terms and conditions apply.
Observation of the suppression of the stimulated hyper-Raman scattering (3S1/2-4P3/2) near
the sodium 4D two-photon resonance
View the table of contents for this issue, or go to the journal homepage for more 1994 J. Phys. B: At. Mol. Opt. Phys. 27 5089
(http://iopscience.iop.org/0953-4075/27/20/022)
Observation of the suppression of the stimulated hyper-Raman
scattering (3Sl12-4P3/2)
near the sodium
4D
two-photon
resonance
Mao-hong Lu and Yu-mei Liu
Institute of Electro-optical Engineering, National Chaio-Tung University, Hsinchu, Taiwan
300, Republic of China
Received 26 April 1994, in h a 1 form 2 August 1994
Abstract. The stimulated hyper-Raman scattering (SHRS) emissions associated with the excitation of the PI;, state in sodium vapour have been observed in both the forward and backward directions as the pumping laser was tuned near the 3 M D two-photon resonance. The results show that though the forward SHRS process is greatly reduced by a destructive interference between it and the four-wave mixing (FWM) process induced by itself, the forward SHRS emission has a positive gain and can still be observed under a certain condition.
1. Introduction
The stimulated hyper-Raman scattering (SHRS) associated with the excitation of the 4P states in sodium vapour was first observed by Cotter et a1 (1977) by using a circularly polarized laser tuned near the 3s-4D two-photon resonance. Recently, a destructive interference between the SHRS process and the four-wave mixing (FWM) process induced
by the SHRS itself was discussed by Moore et a1 (1988), Wunderlich et ai (1990) and Garrett el ai (1992). They also observed the SHRS in sodium vapour, using a linearly
polarized pumping laser tuned near the 3s-3D or 3s-4D two-photon resonance. According to their observations and analysis, they generally pointed out that the SHRS
emission associated with the excitation of a state which is also dipole-coupled to the ground state is almost totally suppressed by the destructive interference with the self- induced FWM if the pumping laser is linearly polarized and the following condition in
SI units (Garrett et a1 1992) is satisfied,
where
r
is the larger of the laser bandwidth or the pressure-broadened width of thelO)+l
j ) transition, z is the pathlength in the medium, No is the number density of the resonant species,.ti,
is the oscillator strength of the 0 - j transition, so and c are the permittivity and the fight velocityin
vacuum respectively, and e and m are the charge and mass of an electron, respectively. Obviously this condition is independent of the laser intensity. Since FWM emission only occurs in the forward direction due to phase-matching considerations, only the forward SHRS emission is completely suppressed, but 0953-4075/94/205089+08$19.50 8 1994 IOP Publishing Ltd 5089
5090
the backward SHRS emission is not influenced. It means that the interference effect only yields backward-propagating SHRS emission, as demonstrated in their Na vapour experiments.
This
destructive interference effect was also studied theoretically by Malakyan (1989). According to her analysis, the SHRS emission in the forward direction will still have a positive gain if the following condition is satisfied,Mao-hong Lu and Yu-mei Liu
R = w ~ ~ & @ / L % ~ : I A2~f,2Q:/fi3A2> 1 (2) where o2 and a ) 3 are the frequencies of SHRS and the self-induced field in a F\NM process, respectively; pii andf;, are the dipole matrix element and the oscillator strength of the
i+j transition, respectively; A =2w,- w2, denotes the detuning from the two-photon
4s
3s
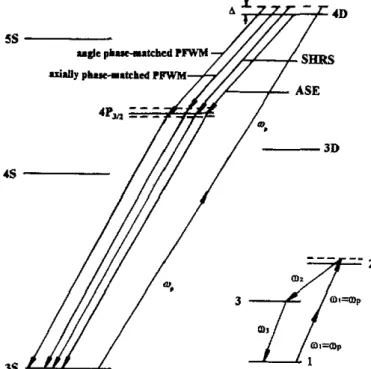
Figure 1. Partial diagram of the sodium atomic energy levels. Here the processes expected to be observed are illustrated. A sketch or the SUR process is shown in lhe lower right part. resonance w2, (see figure 1) and 0, is the two-photon Rabi frequency defined in SI
units by
Here Ip and
wp
are the laser intensity and frequency respectively, h = 2afi is the Planck constant, and fog is the transition frequency from the i state to the j state, n is the refractive index. The result means that the sms in the forward direction could be observed in the experiment where the condition given by equation (2) is met.From
equation (3) it is found that the condition given by equation (2) is dependenton
t k laser intensity. Obviously this prediction contradicts that of Moore et d (1988), Wunderlich et ai (1990) and Garrett et ai (1992).Most recently we observed the SHRS emissions associated with the 2s-2P and 2S-
tuned near the
2s-3s
and 2 S 4 S two-photon resonances (Lu and Liu 1993). It was found that as the laser was tuned near the 2s-4s two-photon resonance, the forwardSHRS emission associated with the 2s-3P transition was observed. In this case, a calcula-
tion shows that the condition given by equation (2) was nearly satisfied. However, the forward SHRS emission associated with the 2s-2P transition was not observed as the laser was tuned near the 2S-3s or 2s-4s two-photon resonance. The calculations show that in these cases the
R
in equation (2) is much smaller than one, i.e. the condition given by equation (2) can not be met.It is interesting for us to observe the forward SHRS emission associated with the 3S-
4P transition in sodium vapour, pumped with a Iinearly polarized laser which is tuned near the 3s-4D two-photon resonance, under circumstances where both the conditions
given by equations (1) and (2) are satisfied.
All
the results presented here verify that the condition given by equation (2) is correct.2. The experiment
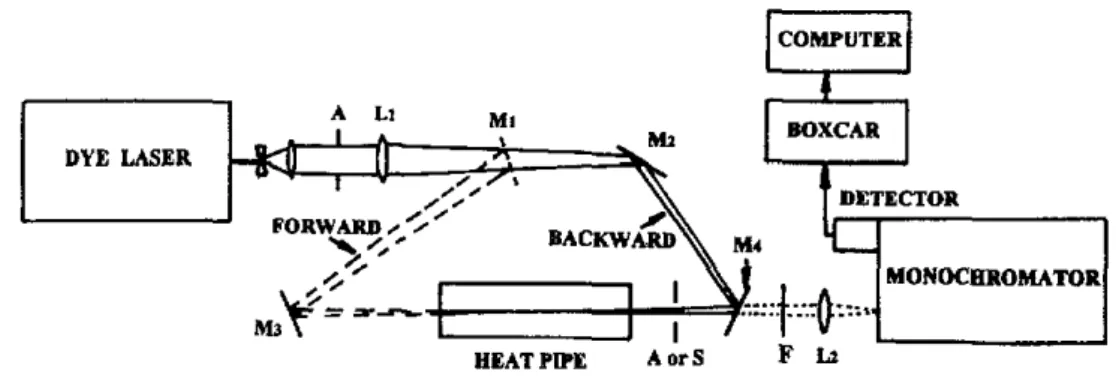
The experimental set-up is shown in figure 2. A pulsed R590 (Exciton) dye laser (Quanta-Ray, PDL-I) was used as a pumping source. The operating parameters of the dye laser were: 20 ns pulse duration, 2-8 mJ energy per pulse, 0.25 cm-' linewidth and 10 Hz repetition rate. In this experiment a linearly polarized pumping light was used.
A conventional heat pipe with a 30cm heated zone was operated with sodium vapour. Argon at 1.5 mbar was used as a buffer gas. The laser beam was directed along the axis of the heat pipe and focused by an 80 cm focal-length lens to a spot with a diameter of 0.25 mm at the centre of the heat pipe. A 4 mm aperture was placed in the forward output beam from the heat pipe to discriminate against the conical emission produced by angle phase-matched FWM. Instead of this aperture a 5 mm beam stop was used to block the axial part of emission in order to observe the angle phase-matched
FWM emission. For the forward measurement
a
colour filter (RG780) was used againstthe strong pumping laser. The output emissions were detected in both the forward and backward directions by a photomultiplier (Hamamasu R928) in the visible region and by a Si/PbS two-colour IR detector (Spex 1429C) in the infrared region after 1 m
monochromator (Spex 1704). In this experiment the forward and backward SHRS emis-
sions were not measured on the same scale.
COMPUTER
D
A Li DYE LASER
MONOCBBOMAMR
Figure 2. Experimental set-up. The mirrors Mt and M, are used for the forward measwe- ment, and the mirrors M I and M d for the backward measurement.
5092
3. Results and discussion
As the pumping laser was tuned near the sodium 3s-4D two-photon resonance
(578.89 nm), the emission spectra in both the forward and backward directions were measured in the 2.3 pm wavelength region. Here the fine structure of the 4D state is ignored since the splitting (0.03 cm-’) of the 4D3/2 and 4D5,, is much smaller
than
the laser linewidth 0.25 cm-’. In the measured wavelength region, at small detuning from the two-photon resonance, four spectral lines related to the 4P3,2 state could be expected in the forward direction, as shown in figure 1, corresponding to four processes: ASE (4D3/2,5,&P3p), SHRS (3Sl/r4P3,z), angle phase-matched and axially phase-matchedFWM ( 2 m u , = ~ , I f6.1~). However, only two spectral lines corresponding to the ASE and
SHRS processes could occur in the backward direction due to the phase-matching consid-
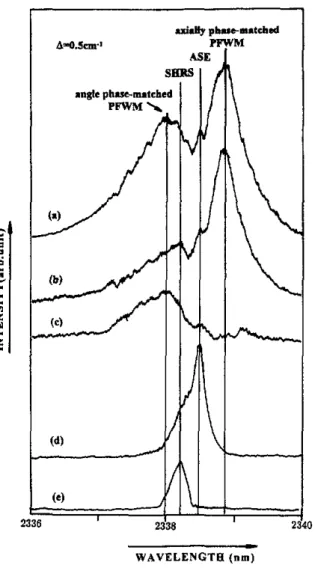
eration. Indeed, at 0.5 cm-’ detuning to the high energy side of the two-photon reson- ance we observed all the spectral lines mentioned above. The results are shown in figures
3(a)-(d). Figure 3(a) shows the emission spectrum measured in the forward direction without any beam stop or aperture. Figures 3(6) and (c) show the spectra measured with a 4 mm aperture and a 5 mm beam stop, respectively. Since most of the emission generated by the angle phase-matched FWM process can be eliminated by the aperture,
from figure 3(b) it can be seen that there are three peaks which correspond to the SHRS
(3Si12-4P3,2), ASE (4D3~.r,2-4P3,z) and axially phase-matched FWM enhanced by near
resonance of the 4P3,z state. However, the axial part of the forward emission can be
blocked by the 5 mm beam stop, so figure 3(c) shows the spectrum which is only from the conical part of the forward emission, corresponding to the angle phase-matched
FWM process. In this case, though the spectral lines corresponding to the angle phase-
matched and axially phase-matched FWM processes are widely spreading, very strong
and very close to the ASE and SHRS spectral lines, all the lines still can be resolved in
evidence by using the aperture and beam stop. Figure 3(d) shows the backward emission spectrum produced by the SHRS and ASE processes only. Here the ASE signal is much
stronger than the SHRS signal. In order to clarify the backward SHRS signal, we subtract
the ASE signal from the backward emission spectrum by using a simple data processing,
in which a symmetric lineshape for the ASE is assumed. Figure 3(e) shows the spectrum
corresponding to the backward SHRS after the processing. Comparing figure 3(e) with
figure 3(b), we find that the backward SHRS peak wavelength is exactly the same as the forward. For comparison, the observed and calculated IR wavelengths for the ASE, SHRS, axially phase-matched and angle phase-matched FWM are listed in table 1. The
IR wavelength of the axially phase-matched FWM was calculated in the same way as we
did for potassium vapour (Lu and Liu 1992). The refractive indices of sodium vapour at different wavelengths were given by the Sellmeier formula. The angle phase-matched
FWM in sodium vapour has been well analysed by Krasinski et al(1985). In a similar
way we calculated the I R wavelength of the angle phase-matched FWM with the Sellmeier formula and found that the phase matching could be satisfied in a wavelength range from 2.3382 to 2.3544pm, corresponding to a cone half angle range from a/2 rad to
zero. It can be expected that the spectrum of the angle phase-matched FWM could be broad band and the peak should occur near 2.3382pm, where the phase-matching point is closer to the 3P312 level and therefore the process has a larger gain due to the resonant enhancement. Actually we observed the peak at 2.3380 pm. According to the calculation, the cone half angle at this wavelength is 0.05 rad (3”). In all the calculations, a pure sodium vapour was assumed. Usually the vapour is a mixture of sodium and argon. A sodium vapour mixed with some argon is less dispersive than pure sodium
WAVELENGTE
(k)
Fwe 3. Emission spectra measured in the forward direction (U) without aperture or beam stop, (6) with a 4 mm aperture, and (c) with a 5 mm stop; and ( d ) measured in the backward direction. The spectrum (e) is the result from the spectrum ( d ) minus the ASE signal. Here the detuning from the 4D two-photon resonance is A = O S a-' and the vapour pressure is -2.4 mbar.
Table 1. Calculated and observed IR wavelengths for various processes at the detuning A = O S cm-' from the 3 S 4 D two-photon resonance.
Calculated Observed (umf (um) AS€ 2.3385 2.338.5 SHRS 2.3382 2.3382 Axially phase-matched FWM 2.3391 2.3389 Angle phase-matched FWM 23382t 2.3380
5094
vapour at the wavelengths we observed in this experiment. So the phase-matching points calculated for pure sodium vapour will move to the 4P3,* level if a mixed vapour is considered. Table 1 shows good agreement between the predicted and the observed wavelengths.
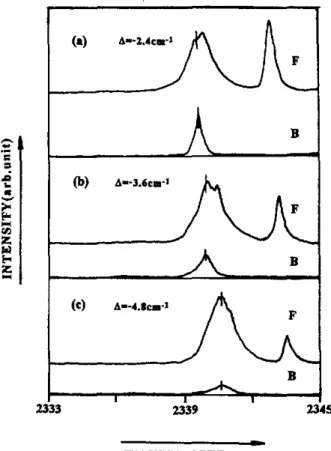
We also measured the forward and backward emission spectra in the wavelength range 2.333-2.345 pm at different detunings. At 2.4, 3.6 and 4.8 cm-' detunings to the
low energy side of the resonance the results measured without any aperture and beam Mao-hang
Lu
and Yu-mi LiuA
BI 1 I
2333 2339 2345
I
WAVELENGTH (om)
Figure 4. Emission spectra measured in both the forward (upper traa) and backward (lower trace) directions at detunings (U) A = - 2 4 c m - ' , ( b ) A=-3,6cm-' and (c) A =
-4.8 cn-' from the 4D two-photon resonance. Here the vapour pressure is -2.4 mbar. stop are shown in figures 4(u)-(c), respectively, where the upper trace is for the forward emission and the lower trace for the backward. At the same detunings
as
above, the results measured with a 4 mm aperture or a 5 mm beam stop in the forward direction are shown in figures 5(u)-(c). Note that in figures 4(a)-(c) the peak at -2.342pm onthe right-hand side of each upper trace should be generated by another parametric
process because it only appears in the forward direction. This line was also observed by Hartig (1978). The mechanism generating this line is not yet clear. We also note that for detuning to the low energy side of the resonance the ASE can not be observed and only the SHRS exists in the backward measurement, as shown in figures 4(u)-(c).
In figures 4(u)-(c) the broad-band signal on the short wave side of each upper trace should be considered to be from the SHRS and F W M processes.
From
figures 5(u)-(c) it can be seen that the broad-band signal is slightly reduced by the 4 m m aperture butI 2342
-
WAVELENGTH (nm)
Flgure 5. Forward emission spectra measured without any aperture or beam stop, with a
4mmaperture,andwithaSmmbeamstopatdduning(n)A=-2.4cm,(b)A--3.6cm.'
and (c) A=-4.8 cm-'. The vapour pressure is -2.4 mbar.
almost completely eliminated by the 5 mm beam stop. It means that the signal copropa- gates with the laser beam and no angle phasematched FWM emission exists. From these
figures we also find that the broad-band signal actually contains two peaks. According to the theoretical analysis (see figure I), the left-hand one is produced by the SHRS,
with a wavelength exactly the same as the backward SHRS wavelength, the right-hand
one is from the axially phase-matched FWM process. From these measurements it seems
that by increasing the detuning to the low energy side of the two-photon resonance the
SHRS process becomes dominant, namely, the gain of the axially phasematched W M
process decreases more rapidly than that of the SHRS process. The reason for the absence of the angle phase-matched FWM signal is that it could be considered to be too weak to be detected, or due to the large phasematching angle, which can not be accepted by the monochromator in this experiment.
In this experiment the laser intensity Ip is 5.6 x
IO8
W an-'. The sodium oscillator strengths &,,,4~,~, f4p,fl-4~I,I and f 4 ~ , ~ - 4 ~ , ~ are taken from Wiese et a1 to be 0.0094,0.82 and 0.091, respectively. The two-photon Rabi frequency for the 3 S 4 D transition is calculated with equation (3) and we have Cl,=4121p. If the detuning, A, from the
3S-4D two-photon resonance is taken to be 2.4 an-', from equation (2) we have
R =
25, that is much larger than one. This calculation confirms that the forward SHRS should
be observed if the condition given by equation (2) is satisfied. Equation
(I)
is evaluated in the circumstance of this experiment, where the laser linewidth of 0.25 cm-' is domi- nant. The number density of sodium and the pathlength are taken to be 10'4-10'6 and 30 cm, respectively. We find that the condition given by equation( I ) is
also well satisfied.5096
4. Conclusion
In this experiment the SHRS emission associated with the excitation
of
the 4P,,2 state of sodium has been observed in both the forward and backward directions as the pumping laser was detuned from the 3s-4D two-photon resonance. The results lead to the conclusion that though the forward SHRS emission is greatly reduced by the destruc- tive interference effect, it can still occur with a positive gain and be observed if the condition given by equation (2) is satisfied. The angle phase-matched FWM emission, whose wavelength is expected to be very close to that of the SHRS emission and difficult to resolve spectrally, can be well distinguished spatially from the SHRS emission with an aperture or a beam stop. Actually, we find that at large detuning to the low energy side of the two-photon resonance the angle phase-matched FWM is not observed and the SHRS process becomes dominant. Our results verify that the condition given by equation (2) works well though it is derived with some approximations.Mao-hong Lu and Yu-mi Liu
Acknowledgments
This project was supported by National Science Council of the Republic of China under grant no NSC 83-0208-M-009-064.
References
Cotter D, Hanna D C, Tuttlebee W H W and Yuratich M A 1971 Opt. Commun. 22 1 9 0 4
Garrett W R, Moore M A, Hart R C, Payne M G and Wunderlich R K 1992 Phys. Rev A 45 6681-709 Hartig W 1978 Appl. Phys. 15 421-32
Krasinskj I, Gauthier D 3, Malcuit M Sand Boyd R W 1985 Opt. Commun. 54 241-5
Lu M H and Liu Y M 1992 Appl. Phys. B 45 288-94
-
1993 Appl. Phys. B 57 167-76Malakyan Yu P 1989 Opt. Commun. 69 315-8
Moore M A , Garrett W R and Payne M G 1988 Opt. Commm. 68 310-6
Wiese W L, Smith M W and Miles B M AIomic Tronririon Probabiliries vol 2 (NSRDS-NBS No 4) Wunderlich R K, Garretl W R, Hart R C, Moore M A and Payne M G 1990 Phys. Rev. A 41 6345-60