I
IEEE TRANSACTIONS ON ClRCUlTS AND SYSTEMS, VOL. 38, NO. IO, OCTOBER I 9 Y 1 1221
REFERENCES
A. Korpel, “A simple description and demonstration of parametric echoes”, J . Appl. Phys., vol. 49, pp. 6125-6131, 1978.
M. R. Chatterjee and A. Korpel, “Simulating nonlinear circuits with SPICE to demonstrate dynamic and static memory storage and applications,” in Proc. 30th MWSCAS, pp. 583-586, 1987. M. R. Chatterjee, “Investigation of electronic holography using SPICE computer simulation experiments,” Ph.D. dissertation. Univ. Iowa, 1985.
I . D. Abella, N. A. Kurnit, and S. R. Hartmann. “Photon echoes,” Phys. Rer., vol. 141, pp. 391-405, 1966.
Y. Y. Asadullin, V. M. Berezov, V. D. Korepanov, and V. S. Romanov, “Anomalous relaxation of stimulated echo in piezoelectric crystals,” JETP Lett., vol. 22, pp. 132-133, 1975.
R. L. Melcher and N. S. Shiren, “Polarization echoes and longtime storage in piezoelectric powders,” Phys. Rei,. Lett ., vol. 36, pp. 888-891, 1976.
R. Penrose, Bull. Inst. Math. Appl., vol. 10, p. 266, 1974. J. Maynard and S. He, “Eigenvalue spectrum, density of states and eigenfunctions of a two-dimensional quasicrystal,” Phys. Rei.. Lett.,
M. R. Chatterjee, “Phenomenological description of dynamic and static coherent optical effects using triple products,” A p p l . Opt., vol. 28, pp. 1856-1861, 1989.
vol. 62, pp. 1888-1891, 1989.
Enhancement of Image Quality for
Low
Bit Rate Video CodingKing N. Ngan, David W. Lin, and Ming L. Liou
Abstract -CCI’lT Recommendation H.261 on coding for visual tele- phony is applicable to bit rates of p X 64 kbits/s, where p = 1,2, . . ,30. It generally performs well over the intended hit rates. However, at the very low rates of 64 and 128 kbits/s, it suffers from visual degradation due to coarse quantization. In this paper, we studied the various approaches or combinations of them to improve the image quality. Methods studied include reducing the quantizer step size, randomized scanning of the macroblocks, and/or nonuniform quantization of the transform coefficients.
I. INTRODUCTION
Efforts have been going on within the International Telegraph and Telephone Consultative Committee (CCITT) to standardize the coding and transmission of video information independent of the local national television standard. The recommendation that ensued is contained in the document CCI’IT Recommcnda- tion H.261. This recommendation describes the video coding and decoding techniques for audiovisual services at the rates of p X 64 kbits/s, where p = 1,2,. . . ,30. For simulation studies, a series of reference models was established, the latest of which is Reference Model (RM) 8 [l].
RM8 is designed to work for a wide range of bit rates, from as low as 64 kbits/s to as high as 1.92 Mbits/s. Its performance is satisfactory at bit rates higher than 128 kbits/s. At bit rates below 128 kbits/s, it suffers from significant visual degradation. In this paper, we propose a number of improvements based on the RM8 algorithm aimed at enhancing the visual quality of the reconstructed images, especially at the low rates of 64 and 128
Manuscript received May 21, 1990; revised April 10, 1991. This paper
K. N. Ngan is with the National University of Singapore, Singapore
D. W. Lin is with National Chiao Tung University, Hsinchu, Taiwan,
M. L. Liou is with Bellcore, Red Bank, NJ 07701. IEEE Log Number 9102171.
was recommended by Associate Editor T. R. Hsing.
051 1, Republic of Singapore.
ROC.
kbits/s. It must be pointed out that the enhancements are not nccessarily compatible to the RM8 algorithm but intended to serve as options in a proprietary system.
Following this section, an overview and the inherent short- comings of RMX are outlined. In Section 111, some proposals to improve thc RM8 algorithm are described. The results and discussion arising from there are contained in Section IV. Fi- nally, we conclude in Section V.
11. RM8
RM8 is a novel approach to defining a coding standard for video communications at p X64 kbits/s. It is a hybrid DPCM/ transform coder where a simple first-order differential pulse code modulation (DPCM) is performed in the temporal domain (interframc) and the transform coding using discrete cosine transform (DCT) is then applied to the DPCM samples. Two picture formats are specified: common intermediate for- mat (CIF), having 288 linesx352 pixels per line, and quarter CIF (QCIF), having 144 lines X 176 pixels per line. Each video frame is divided into macroblocks (MAC’S) of 16X 16 pixels each. Thirty-three MAC’S form a group of blocks (GOB).
To increase coding efficiency, a two-dimensional variable length code (2-D VLC) is used, in which the runlength of the number of zero coefficients preceding a nonzero quantized coefficient and the magnitude of the nonzero coefficient (collec- tively tcrmcd an EVENT), are coded.
Quantization of the coefficients is by means of a 32-level uniform quantizer with adjustable step size controlled by the buffer level. A variable threshold is applied to the coefficients to increase the number of zero coefficients. A detailed description of RM8 can be found in [l], while various aspects of the coding algorithm have been studied in [2]-[4].
The poor performance of RMX at low bit rates can be attributed to the use of uniform quantizer and the adaptation of the quantizer step size to the buffer level. It is well known that D C T coefficients are not uniformly distributed [5]. Even though the quantizer step size in RM8 varies with the buffer level, the change is uniform throughout the entire quantizer range. There- fore, the reconstructed level of the quantizer does not take into account the nonuniform nature of the coefficient distribution.
A study of the buffer fullness for several test sequences revcaled that the buffer is always at less than the half-full level, which suggests that it has not been optimally utilized, with the consequence that the image is coded with fewer bits than the buffer can handle. This is the result of thresholding to increase the runlength of zero coefficients so as to make the 2-D VLC more efficient.
Also, the adaptation of the quantizer step size is rather slow, especially at scene cuts, e.g., at the beginning of a new sequence. As a result, the picture quality builds up gradually over a number of frames (typically 20-30 frames) making the scene cuts very obvious, if not objectionable.
111. P K O P O s t D ENHANCEMF NTS
Arising from the discussion in the previous section, we pro- pose the following enhancements.
A . Reducing the Quantizer Step Size (RQSS)
As noted earlier, the buffer level is likely to be below half-full most of the time. which means that one can increase the
IEEE TRANSACTIONS ON CIRCUITS AND SYSTEMS, VOL. 38, NO. 10, OCTOBER 1991
0
-80 6 0 -40 -20 0 20 40 60 80
Magnitude
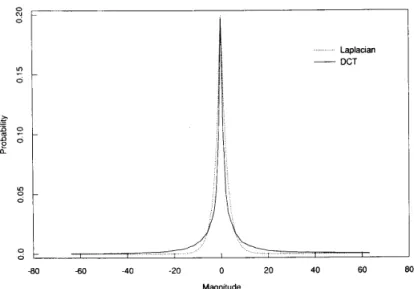
Fig. 1 . Probability distribution of DCT coefficients.
instantaneous bit rate without the buffer being overflowed. One simple way is to reduce the quantizer step size. In RM8, the quantizer step size ranges from 4 to 64 in steps of 2, with the initial step size fixed at 32. Instead of having a step size increment of 2, it is changed to 1 with the initial step size at 16. B. Randomized Scanning (RS)
The quantizer step size in RM8 is proportional to the buffer level and the scanning of the MAC‘S is sequential from left to right, top to bottom. Therefore, in regions of high activity or complicated background, the buffer level remains high, making the step size large. The reverse is true in regions of low activity or plain background. This exacerbates the “blocking” and “mosquito” effects by further reducing the bit rate in regions which require higher bit rates. If the scaning pattern is random- ized, the buffer level will be evened out since the regions of contiguous activity are broken up. This should lead to smaller quantizer step sizes in high activity regions and vice versa. The randomized pattern is generated according to the equation
+
mc X sp1
m o d ( 3 3 x g b ) (1) bk = INTwhere
bk = randomized MAC number, f r = frame number,
sp = spacing between randomized MAC’s,
mc = sequential MAC number, gb = GOB number,
and INT[x] denotes integer value of x . The row and column numbers, TW and cl, of the randomized MAC’s are thus given by
bk n
T W = -
cl = bk mod ( n ) (2b)
where n = 11 for QCIF and n = 22 for CIF.
Randomization of the MAC scanning pattern renders the updating of the quantizer step size every MAC necessary be- cause adjacent MAC’s are less correlated. This represents a
TABLE I
32-LEVEL LAPLACIAN QUANTIZER
0.0000 0.1368 0.2821 0.4366 0.6007 0.7777 0.9712 1.1828 1.4143 1.6748 1.9759 2.3288 2.7533 3.2874 4.0091 5.1425 0.0666 0.2070 0.3574 0.5159 0.6856 0.8698 1.0726 1.2931 1.5356 1.8139 2.1378 2.5197 2.9870 3.5877 4.4305 5.8545
slight increase in overhead information. The increase is insignifi- cant as the buffer level that determines the quantizer step is incremental, thereby smoothing out the fluctuations.
C. Nonuniform Quantization (NQ)
To design a nonuniform quantizer, we studied the probability distribution of the AC coefficients to be quantized. It is plotted in Fig. 1 for a sequence of 150 QCIF images called “Salesman” at a frame rate of 10 Hz. Superimposed on the coefficient distribution curve is a Laplacian distribution curve (dashed line) with the same variance. It is observed that the distribution of the coefficients can be approximated to be Laplacian.
A nonuniform quantizer modeled on the Laplacian distribu- tion is then designed using the Max-Lloyd algorithm [6]. Table I shows the decision levels, d , , and reconstruction levels, r k , of a 32-level quantizer. As in the case of RM8, the step size of the quantizer, q , is adjusted according to the buffer level, i.e.,
where bf is the buffer level.
IEEE TRANSACTIONS ON CIRCUITS AND SYSTEMS, VOL. 38, NO. 10, OCTOBER 1991
0 64 128 192 256 320 Bll Rate (kbWs)
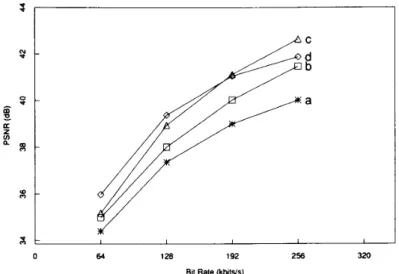
Luminance PSNR curves for different bit rates. (a) RM8. (b) RQSS. ( c ) RS
+
RQSS. (d) N Q+
RS. Fig. 2. RM8 - NQ+RSw c
I I 1 I 1 1 I 0 20 40 60 eo 100 120 140 160 Frame Number (a) RM8 - NO+RSa C
I I 1 I I I I 0 20 40 60 eo 100 120 140 160 Frame Number (b)Fig. 3. Luminance PSNR’s of individual frames of the Salesman sequence at (a) 64 kbits/s and (b) 128 kbits/s.
1224 IEEE TRANSACTIONS ON CIRCUITS AND S Y S T ~ M S . VOL. 38, NO. in, OCTOBER 1991
The use of nonuniform Laplacian quantizer results in a more accurate quantizer, which in turn generates more data bits. This can cause the buffer to overflow at the very low bit rates of 64 and 128 kbits/s. To alleviate the problem, coarser quantization is introduced by increasing q by a factor a , where a is between 1 and 2, inclusive. (Y is calculated as follows:
T o further ensure that the buffer will not overflow at 64 kbits/s, the quantizer outputs are judiciously set to zero whenever the mean square error between the MAC’S of the current and previous frames exceeds a certain threshold. This indicates active region or fast movement, which requires high bit rate and therefore is likely to cause buffer overflow.
The adoption of nonuniform quantization means that the 2-D VLC table for the transform coefficients has to be redesigned to ensure good coding efficiency. The design of the 2-D VLC table involves exhaustive study of the EVENT’S of an ensemble of image sequences, which will be the subject of further work. In this paper, the 2-D VLC table was obtained based on only three test sequences.
IV. RESULIS A N D DISCUSSION
Simulation studies were carried out using the Salesman se- quence consisting of 150 QCIF images at a frame rate of 10 Hz. This sequence is used because it contains rapid movements and complicated background. The peak signal-to-noisc-ratio (PSNR) curves of the luminance component for different bit rates are plotted in Fig. 2. Curve a (RM8) shows the results for RM8. Curve b (RQSS) shows the results when the quantizer step size
was reduced to 1 and its initial value sct to 16, as in Scction 111-A. Randomized scanning described in Section 111-B was then applied to the scheme in Section 111-A to obtain the results plotted in curve c (RS+RQSS). Finally, curve d ( N Q + R S ) shows the results of nonuniform quantization of Section 111-C combined with randomized scanning. However, in this case, the initial step size was reset to 32.
From Fig. 2, it can be seen that in tcrms of PSNR, all the enhancement techniques described above produced results bet- ter than that of RM8. The region of most interest is the ISDN rates of 64 and 128 kbits/s, where the subjective improvement is significant although the increase in PSNR is not high (1.6-1.9 dB). Of the three techniques, N Q + R S performed the best. RQSS raised the PSNR values but not significantly. However, when combined with randomized scanning as in RS - RQSS, its
performance is better.
T o see the improvement more objectively, we plotted the luminance PSNR’s of individual frames of the Salesman se- quence at 64 and 128 kbits/s in Fig. 3(a) and (b), respectively. T h e dashed curve shows the results of RM8, while the solid curve shows that for N Q + R S . One can observe quite clearly that in both cases the improvement is quite substantial, espe- cially during the initial 20 frames where the PSNR increased by as much as 11 dB in frame 2. This is important as scene cuts may occur frequently during a video transmission. The enhanced image quality will make the transitions a t scenc cuts less objec- tionable. Beyond the initial 20 frames, the improvement is reduced but still significant.
T h e improvement is even more pronounced subjectively. Figs.
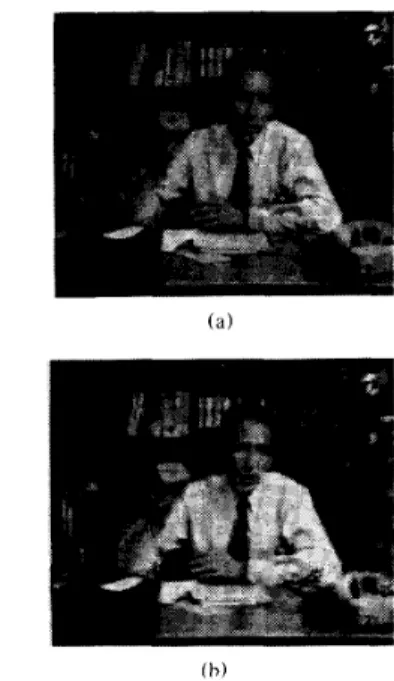
4 and 5 show the subjective results for frame 3 of the Salesman sequence at 64 and 128 kbits/s, respectively. This particular
Fig. 4. Frame
Fig. 5. Frame
( h )
3 of the Salesman sequence coded at 64 kbits/s using (a) RM8 and (b) NQ
+
RS.( b )
3 of the Salesman sequence coded at 128 kbits/s using (a) RM8 and (b) NQ
+
RS.frame was chosen because it contains fast motion and compli- cated background. Fig. 4(a) and (b) show the results using RM8, and N Q + R S , respectively, at 64 kbits/s. Fig. 5 shows the same for 128 kbits/s. The subjective quality of Figs. 4(b) and 5(b) is evidently better than that of Figs. 4(a) and 5(a). In both cases, the complicated background is reproduced with higher fidelity. The “blocking” artifacts which arc so apparent in Figs. 4(a) and
IEEE TRANSACTIONS ON CIRCUITS AND SYSTEMS, VOL. 38, NO. 10, OCTOBER 1991 1225
5(a) have largely been removed. The outline of the moving object is also much clearer, in contrast to blurring in RM8.
V. CONCLUSIONS
Proposals to improve the visual quality of images coded using RM8 were made, especially at the low bit rates of 64 and 128 kbits/s. Reducing the quantizer step size did improve the codec performance, but only marginally. Nonuniform quantization coupled with randomized scanning of the macroblocks was found to be effective in improving the image quality, both objectively and subjectivcly. Improvement is particularly marked in the initial 20 frames of a sequence. This is especially useful at scene cuts. Overall, enhancement in image quality can be found in areas of complicated background and fast motion.
R E F E R ~ N C E S
111 “Description of reference model 8 (RM8),” Document 525, CCITT Study Group XV, Working Party XV/4, Specialists Group on Cod- ing for Visual Telephony, June 9, 1989.
[2] R. C. Nicol and N. Mukawa, “Motion video coding in CCITT SG XV-The coded picture format,” IEEE Global Telecomm. Conf. Rec., pp. 992-996, 1988.
[31 R. Plompen, Y. Hatori, W. Geuen, J. Guichard, M. Guglielmo, and H. Brusewitz, “Motion video coding in CCITT SG XV-The video source coding,” IEEE Global Telecomm. Conf. Rec., pp. 997-1004, 1988.
[41 M. Carr, J. Guichard, K. Matsuda, R. Plompen, and J. Speidel, “Motion video coding in CCITT SG XV-The video multiplex and transmission coding,” IEEE Global Telecomm. Conf. Rec., pp. [51 R. C. Reininger and J. D. Gibson, “Distribution of the two-dimen-
1005-1010, 1988.
I
nputr---l
I r--- I]Output
1 - OI
0I-
I+I
W
If
’
i
Z
’
I
G(zA
F(ziI
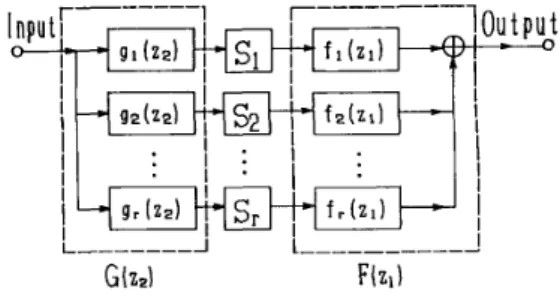
Fig. 1. 2DDF realization based on the ISVD.
and then the design is performed [1]-[3]. In the frequency- domain design, the desired 2-D magnitude characteristics are usually given as design specifications. In decomposing 2-D mag- nitude specifications into 1-D ones, the conventional matrix decomposition method such as the SVD cannot avoid the prob- lem that the 1-D magnitude specifications resulting from the decompositions are often negative. Since negative values can not be viewed as magnitude responses, the l D D F design problems become intricate [ 2 ] , [ 3 ] .
In this paper, the proposed iterative singular value decomposi-
tion (ISVD) guarantees all its decomposition results to be always non-negative. Therefore, it is more suitable for 2DDF designs than other conventional decomposition methods.
11. ISVD OF 2-D MAGNITUDE MATRIX sional DCT coefficients for images,” IEEE Trans. Commun., vol.
COM-31, pp. 835-839, June 1983.
for minimum distortion,,, IRE Trans, I,,form, Theory, vol. IT-6, pp. 7-12, Mar. 1960.
this section, we first give the outline of the ISVD of a 2 - ~ magnitude specification matrix, and then relate the ISVD with the 2DDF design. Finally, we explain the ISVD algorithm in
[61 J , Max,
some detail. Frequency-Domain Design of 2-D Digital Filters
Using the Iterative Singular Value Decomposition Tian-Bo Deng and Masayuki Kawamata
2.1. Outline of the
ISVD
and ZDDF DesignUsing the desired 2-D magnitude samples H d ( w l m , we form a 2-D magnitude specification matrix A as
Abstract -This paper proposes a new technique for designing 2-D digital filters (2DDF’s) with specified magnitude and constant group delay characteristics. The method is based on the proposed iterative singular value decomposition of a 2 - 0 magnitude specification matrix. By using the ISVD, 2-D magnitude specifications can be decomposed into a pair of 1-D ones, and thus the problem of designing a ZDDF can be reduced to the one of designing a pair of IDDF’s or even only one IDDF. Consequently, the original design problem is significantly simplified.
I. INTRODUCTION
The problem of designing 2-D digital filters (2DDF’s) can be simplified as the one of designing 1DDF’s. In such cases, 2-D design specifications have to be decomposed into 1-D ones first,
The ISVD decomposes the matrix A into the form
r
A
=
S,FiG, (2)i = l
but all the elements of F, and G , are non-negative and the decomposition error
(3)
Il2
II
A -*Il
S,F,G, is relatively small, where Si = 1 or - 1.Manuscript received April 2, 1990; revised February 8, 1991. This paper was recommended by Associate Editor K. H. Tzou.
T. Deng is with the Department of Information and Computer Sci- ences, Toyo-hashi University of Technology, Tempaku-cho, Toyohashi,
By using Fi and G ; , we can construct matrices
(4)
441 Japan. G = I G ‘ ,
c;
. ‘ . G : ] ‘ (5)F = [ F , F2
. . .
F r ]-~
M. Kamawata is with the Department of Electronic Engineering, IEEE Log Number 9102169.
where F E R ( M + * ) x r , G E R r x ( N + l ) . Since all elements of F and G are non-negative, they can be regarded as magnitude Tohoku University, Aoba, Aramaki, Sendai 980, Japan.