Y. Shi et al. (Eds.): MCDM 2009, CCIS 35, pp. 789–796, 2009. © Springer-Verlag Berlin Heidelberg 2009
Method: Using the Maximum Mean
De-Entropy Algorithm
Li Chung-Wei1 and Tzeng Gwo-Hshiung1,2
1 Institute of Management of Technology, National Chiao Tung University, Hsinchu, Taiwan
samli0707@gamil.com 2
Department of Business and Entrepreneurial Management & Department of Banking and Finance , Kainan University, Taoyuan, Taiwan
ghtzeng@mail.knu.edu.tw
Abstract. To deal with complex problems, structuring them through graphical
representations and analyzing causal influences can aid in illuminating complex issues, systems, or concepts. The DEMATEL method is a methodology which can be used for researching and solving complicated and intertwined problem groups. The end product of the DEMATEL process is a visual representation— the impact-relations map—by which respondents organize their own actions in the world. The applicability of the DEMATEL method is widespread, ranging from analyzing world problematique decision making to industrial planning. The most important property of the DEMATEL method used in the multi-criteria decision making (MCDM) field is to construct interrelations between criteria. In order to obtain a suitable impact-relations map, an appropriate threshold value is needed to obtain adequate information for further analysis and decision-making. In this paper, we propose a method based on the entropy approach, the maximum mean de-entropy algorithm, to achieve this purpose. Using real cases to find the interrelationships between the criteria for evaluating effects in E-learning programs as an examples, we will compare the results ob-tained from the respondents and from our method, and discuss that the different impact-relations maps from these two methods.
Keywords: DEMATEL, Multiple Criteria Decision Making (MCDM), entropy,
Maximum Mean De-Entropy (MMDE) Algorithm.
1 Introduction
The DEMATEL (Decision Making Trial and Evaluation Laboratory) method, devel-oped by the Science and Human Affairs Program of the Battelle Memorial Institute of Geneva between 1972 and 1976, was used to research and solve complicated and intertwined problem groups [1, 2]. The applicability of the DEMATEL method is widespread, ranging from analyzing world problematique decision making to indus-trial planning [3-6]. The most important property of the DEMATEL method used in
the multi-criteria decision making (MCDM) field is to construct interrelations be-tween criteria. After the interrelations bebe-tween criteria were determined, the results derived from the DEMATEL method could be used for fuzzy integrals to measure the super-additive effectiveness value or for the Analytic Network Process method (ANP) [7, 8] to measure dependence and feedback relationships between certain criteria.
There are four steps in the DEMATEL method: (1) calculate the average matrix, (2) calculate the normalized initial direct-influence matrix, (3) derive the total rela-tion matrix, and (4) set a threshold value and obtain the impact-relarela-tions map. In Step 4, an appropriate threshold value is necessary to obtain a suitable impact-relations map as well as adequate information for further analysis and decision-making. The traditional method followed to set a threshold value is conducting discussions with experts. The results of the threshold values may differ among different researchers.
In contrast to the traditional method, which confronts the loop from a “set a thresh-old value” to obtain “the needed impact-relations-map”, we propose the Maximum Mean De-Entropy (MMDE) algorithm to obtain a unique threshold value for delineat-ing the impact-relations map. In the numerical examples, real cases are used to dis-cover and illustrate the intertwined effects of a structural multi-criteria decision making model.
The rest of this paper is organized as follows: Section 2 briefly describes the DE-MATEL method. The steps of the maximum mean entropy algorithm will be de-scribed, explained, and discussed in Section 3. In Section 4, numerical examples are shown in order to explain the proposed algorithm and discuss the results. Finally, in Section 5, we draw conclusions.
2 DEMATEL Method
The end product of the DEMATEL process—the impact-relations map—is a visual representation of the mind by which the respondent organizes his or her own action in the world. This organizational process must occur for the respondent to keep inter-nally coherent and to reach his or her personal goals. The steps of the DEMATEL method [6] are described as follows:
Step 1: Find the average matrix.
Suppose there are h experts available to solve a complex problem and there are n factors to be considered. The scores given by each expert give us a n × n non-negative answer matrix Xk, with 1 ≤ k ≤ h. Thus X1, X2,…, Xh are the answer matrices for each of the h experts, and each element of Xk is an integer denoted by
x
ijk. The diagonal elements of each answer matrix Xk are all set to zero. We can then compute the n × n average matrix A by averaging the h experts’ score matrices. The (i, j) element of matrix A is denoted by aij , 1 1 h k ij ij k a x h = =∑
(1)Step 2: Calculate the normalized initial direct-relation matrix.
We then create a matrix D by using a simple matrix operation on A. Suppose we cre-ate matrix D and
D
= ⋅
s
A
wheren n 1 1 1 1
1
1
,
max
ijmax
ij i n j n j is
Min
a
a
≤ ≤ = ≤ ≤ =⎡
⎤
⎢
⎥
=
⎢
⎥
⎢
⎥
⎣
∑
∑
⎦
(2)Matrix D is called the normalized initial direct-relation matrix. The (i, j) element dij denotes the direct influence from factor x i to factor xj. Suppose di• denotes the row
sum of the i-th row of matrix D.
1 n i i j j d• d = =
∑
(3)The di• shows the sum of influence directly exerted from factor xi to the other
fac-tors. Suppose d•j denotes the column sum of the j-th column of matrix D.
1 n j i j i d• d = =
∑
(4)Then d•j shows the sum of influence that factor xj received from the other factors.
We can normalize di• and d•j as
1
( )
i i n i id
w d
d
• • ==
∑
and 1 ( ) j j n j j d v d d • • = =∑
Step 3: Compute the total relation matrix.
A continuous decrease of the indirect effects of problems along the powers of matrix
D, e.g. D2, D3,…, D∞, guarantees convergent solutions to the matrix inversion, similar to an absorbing Markov chain matrix. Note that
lim
m[ ]
0
n nm→∞
D
=
×, where
[ ]
0n n× is the n × n null matrix. The total relation matrix T is an n × n matrix and is defined as follows:2 3 2 3 1 1
...
(
...
)
(
) (
)
i m m m=1 m ∞ − −= +
+
+ +
=
+ +
+
+ +
=
−
−
∑
D
D
D
D
D
D I
D
D
D
D
D I
D
I
D
1 ( )− =D I−D , (5)where I is the identity matrix and T is called the total relation matrix. The (i, j) ele-ment of the matrix T, tij, denotes the full direct and indirect influence exerted from
factor xi to factor xj. Like the formula (3) — (4), we can obtain ti•, t•j, wi(t), and vj(t).
Step 4: Set a threshold value and obtain the impact-relations map.
In order to explain the structural relationship among the factors while keeping the complexity of the system to a manageable level, it is necessary to set a threshold
value p to filter out the negligible effects in matrix T. Only those factors that have an effect in matrix T greater than the threshold value should be chosen and shown in an impact-relations map. In this Step, the threshold value can be chosen by the decision maker or through discussions with experts. If the threshold value is too low, the map will be too complex to show the necessary information for decision-making. If the threshold value is too high, many factors will be presented as independent factors, without showing the relationships with other factors. An appropriate threshold value is necessary to obtain a suitable impact-relations map as well as adequate information for further analysis and decision-making.
3 Maximum Mean De-Entropy Algorithm (MMDE)
As we mentioned above, the threshold value is determined by asking experts or by the researcher (as a decision maker). Choosing a consistent threshold value is time-consuming if the impact-relations maps are similar when threshold values are changed slightly. We propose the Maximum Mean De-Entropy (MMDE) algorithm to find a threshold value for delineating the impact-relations map [9]. In this algorithm, we use the approach of entropy, which has been widely applied in information science, but define another two information measures: de-entropy and mean de-entropy. In addi-tion, the proposed algorithm mainly serves to search for the threshold value by nodes (or vertices). This algorithm differs from the traditional methods through which the threshold value is decided by searching a suitable impact-relations map. In this section, we use the symbol ■ as the end of a definition or a step in the proposed algorithm.
3.1 Information Entropy
Entropy is a physical measurement of thermal-dynamics and has become an important concept in the social sciences [10, 11]. In information theory, entropy is used to measure the expected information content of certain messages, and is a criterion for the amount of "uncertainty" represented by a discrete probability distribution.
Definition 1: Let a random variable with n elements be denoted as X =, with a corre-sponding probability P = {p1, p2, ..., pn}, then we define the entropy, H,
of X as follows:
(
1, 2, , n)
ilg iH p p " p = −
∑
p psubject to constraints (8) and (9):
1
1
n i ip
==
∑
(6)lg
0 if
0
i i ip
p
=
p
=
(7)■Definition 2: For a given finite discrete scheme of X, the de-entropy of X is denoted as HD and defined as:
(
1 1 1)
(
)
1 2 , , , , , , D n n n n H =H " −H p p " p ■By Definition 2, the value of HD is equal to or larger than 0. By Definition 1, Formula (8) can be proven (the proof can be found in [12]:
(
1 1 1)
(
1 1 1)
1 1 1 1, ,
,
,
,
,
n n n n n n n nH
=
H
"
≤
H
+ +"
+=
H
+ (8)Formula (8) explains that when adding a new variable to a system where all vari-ables in the system have the same probability, the entropy of the system will increase. To delineate an impact-relations map, if adding a new factor to the impact-relations map can make the system less uncertain, or lead to more de-entropy, then the new factor provides worthwhile information for a decision maker. In other words, in an existing information system whose variables and corresponding probabilities have been fixed, adding a new variable to the system will change the probability distribu-tion; if D1 D
n n
H + >H exists, then this new variable provides useful information to avoid uncertainty for the decision maker.
3.2 The Dispatch- and Receive-Nodes
In the DEMATEL method, the (i, j) element of the matrix T, tij, refers to the full direct
and indirect influence exerted from factor x i to factor xj. Like the “vertices” and
“edges” in graph theory [13], xi and xj are vertices in the directed graph
impact-relations map, and tij can be considered as a directed edge which connects factors x i
and xj with an influence value.
Definition 3: The (i, j) element of the matrix T is denoted as tij and refers to a directed
influence relations from factor x i to factor xj. For each tij, the factor xi is
defined as a dispatch-node and factor xj is defined as a receive-node
with respect to tij. ■
By Definition 2, an n × n total relation matrix T can be considered as a set (set T) with n2 pair ordered elements. Every subset of set T can be divided into two sets: an or-dered dispatch-node set and an oror-dered receive-node set. For an oror-dered dispatch- node set (or an ordered receive-node set), we can count the frequency of the different elements of the set. If the finite cardinality of an order dispatch-node set (or an or-dered receive-node set) is m and the frequency of element xi is k, we assign the
corre-sponding probability of xi as
i k p
m
= . In this way, for an ordered set, we can assign each different element a probability and follow Definition 1 for
1 1 n i i p = =
∑
.Notation: In this paper, C(X) denotes the cardinal number of an ordered set X and N(X) denotes the cardinal number of different elements in set X.
3.3 Maximum Mean De-Entropy Algorithm
Based on a calculated total relation matrix T, the steps of the proposed Maximum Mean De-Entropy algorithm for determining a threshold value are described as follows:
Step 1: Transforming the n x n total relation matrix T into an ordered set T, {t11, t12,…, t21, t22, …, tnn} , rearranging the element order in set T from large to small, and
transforming to a corresponding ordered triplets (tij, xi, xj) set denotes T*. ■
Step 2: Taking the second element, the dispatch-node, from the ordered triplets of the set T* and then obtaining a new ordered dispatch-node set, TDi. ■ Step 3: Taking the first t elements of TDi as a new set TtDi, assign the probability of
different elements, and then calculate the HD of the set Tt Di
, Ht Di
. We can cal-culate the mean de-entropy by
( ) Di Di t t Di t H MDE N T
= . At first, the t is set as 1, then of value of t is determined by raising the value from 1 to C(TDi) in
in-crements of 1. ■
Step 4: In C(TDi) mean de-entropy values, select the maximum mean de-entropy and its corresponding TtDi. This dispatch-node set, with the maximum mean
de-entropy, is denoted as
T
maxDi . ■Step 5: Similar to Steps 2 to 4, an ordered receive-node set TRe and a maximum mean de-entropy receive-node set
T
maxRe can be derived. ■ Step 6: Taking the first u elements in T* as the subset, TTh, which includes all elements ofT
maxDi in the dispatch-node and all elements ofT
maxRe in the receive-node, the minimum influence value in TTh is the threshold value, and Formula (9) and (10) hold. * 1 ( Th) ( ) C T C T < < (9)■ max max(
Th)
(
Di)
(
Re)
G T
=
G T
∪
G T
(10)4 Numerical Cases of Deciding Intertwined Criteria in Evaluating
E-Learning Program
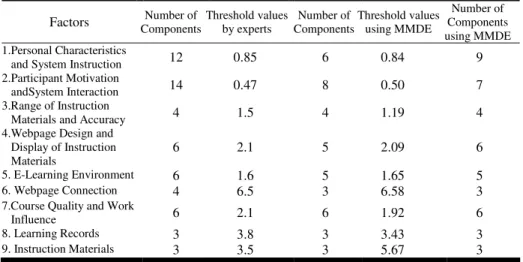
The empirical experiments of this paper are demonstrated with e-learning company-training programs [6]. In [6], they applied the DEMATEL method to illustrate the interrelations among criteria and found the central criteria to represent the effectiveness of factors/aspects. The principle component analysis was used to extract nine factors from fifty-eight criteria and nine factors were chosen. According to factor analysis results, some experts and professionals were invited to discuss and scored the relation between criteria of each factor based on the DEMATEL approach. The threshold value of each factor from factor 1 to factor 9 is 0.85, 0.47, 1.5, 2.1, 1.6, 6.5, 2.1, 3.8 and 3.5.
Based on the subset obtained in Step 6, the threshold value could be determined and then the relations map can be structured. In the E-learning case, the impact-relations maps derived from the MMDE algorithm are similar as that shown in Table 1. We compare the results obtained from the respondents and from our method, and find that there are six factors will be structured by same components. Another three factors,
although the numbers of components are different, have similar threshold values. This means that MMDE is a suitable method to determine a threshold value in the first, or the final, step in order to discuss the adequacy of the impact-relations map.
The proposed MMDE algorithm has some properties that differ from the traditional method to make the threshold value, as discussed below.
Table 1. The results obtained from the respondents and from MMDE method
Factors ComponentsNumber of Threshold values by experts Components Number of Threshold values using MMDE
Number of Components using MMDE 1.Personal Characteristics
and System Instruction 12 0.85 6 0.84 9
2.Participant Motivation
andSystem Interaction 14 0.47 8 0.50 7
3.Range of Instruction
Materials and Accuracy 4 1.5 4 1.19 4
4.Webpage Design and Display of Instruction Materials
6 2.1 5 2.09 6
5. E-Learning Environment 6 1.6 5 1.65 5
6. Webpage Connection 4 6.5 3 6.58 3
7.Course Quality and Work
Influence 6 2.1 6 1.92 6
8. Learning Records 3 3.8 3 3.43 3
9. Instruction Materials 3 3.5 3 5.67 3
1. The MMDE mainly serves to decide the “node” rather than the “map”
In traditional methods, the researcher set a subject adequate threshold to draw the im-pact-relations map and discussed it with experts to obtain a consistent opinion. In the proposed MMDE, the main issue is about whether it is suitable to add a new “node”. If adding a new node can improve the “mean de-entropy”, then adding it can be helpful to understand a problematique by decreasing the uncertainty of information.
2. The MMDE considers the properties of both the dispatch and receive influences of a factor
In the DEMATEL method, after a suitable map is obtained, the focus of the problem can be shown by analyzing the values wi and vi, as Formulas (5)—(6), of the factors in the
map. Using the proposed MMDE, we search the nodes, including dispatch- and receive-nodes, simultaneously. The MMDE not only considers the factors which strongly influ-ence others, but also the factors which are easily influinflu-enced by other factors.
3. The MMDE can obtain a unique threshold value
In the traditional method, the researcher may determine the threshold value by de-creasing the value (this will change the impact-relations map from simple to complex) or by increasing the value (this will change the impact-relations map from complex to simple), so the results of these two methods may different. Using the MMDE, a re-searcher can obtain a unique threshold value, which is helpful to solve the problem a researcher confronts in regards to selecting a consistent threshold value.
5 Conclusions
In the DEMATEL process, an appropriate threshold value is important in order to obtain adequate information to delineate the impact-relations map for further analysis and decision-making. Until now, the threshold value has been determined through discussions with respondents or chosen subjectively by researchers. It is time-consuming to make a consistent decision on the threshold value, especially when the number of factors in the problematique makes it too difficult to discuss the adequacy of an impact-relations map. If the threshold is determined by the researcher alone, it is important to clarify how to choose the specific value. A theoretical method to aid in deciding the threshold value is necessary. This paper proposed an MMDE algorithm to determine the threshold value. With this method, a unique threshold value can be obtained, solving the problem of choosing the threshold value in the traditional way.
References
1. Fontela, E., Gabus, A.: The DEMATEL Observer. Battelle Institute, Geneva Research Center (1976)
2. Fontela, E., Gabus, A.: DEMATEL, Innovative Methods, Report No. 2 Structural Analysis of the World Problematique. Battelle Geneva Research Institute (1974)
3. Chiu, Y.-J., Chen, H.-C., Shyu, J.Z., Tzeng, G.-H.: Marketing strategy based on customer behaviour for the LCD-TV. International Journal of Management and Decision Making 7, 143–165 (2006)
4. Hori, S., Shimizu, Y.: Designing methods of human interface for supervisory control sys-tems. Control Engineering Practice 7, 1413–1419 (1999)
5. Huang, C.-Y., Shyu, J.Z., Tzeng, G.-H.: Reconfiguring the innovation policy portfolios for Taiwan’s SIP Mall industry. Technovation 29, 744–765 (2007)
6. Tzeng, G.-H., Chiang, C.-H., Li, C.-W.: Evaluating intertwined effects in e-learning pro-grams: A novel hybrid MCDM model based on factor analysis and DEMATEL. Expert Systems with Applications 32, 1028–1044 (2006)
7. Liou, J.J.H., Yen, L., Tzeng, G.-H.: Building an effective safety management system for airlines. Journal of Air Transport Management 14, 20 (2008)
8. Saaty, T.L.: Decision Making with Dependence and Feedback: The Analytic Network Process. RWS Publications, Pittsburgh (1996)
9. Li, C.-W., Tzeng, G.-H.: Identification of a Threshold Value for the DEMATEL Method Using the Maximum Mean De-Entropy Algorithm to Find Critical Services Provided by a Semiconductor Intellectual Property Mall. Expert Systems with Applications (in press) (corrected proof)
10. Kartam, N., Tzeng, G.-H., Tzeng, J.-U.: Robust Contigency Plans for Transportation In-vestment Planning. IEEE Transaction on System, Man, and Cybernetics 23, 5–13 (1993) 11. Zeleny, M.: Multiple Criteria Decision Making. McGraw Hill, New York (1981)
12. Khinchin, A.I.: Mathematical Foundations of Information Theory. Dover Publications, New York (1957)
13. Agnarsson, G., Greenlaw, R.: Graph Theory: Modeling, Applications, and Algorithms. Pearson Prentice Hall, New Jersey (2007)