Carrier-carrier scattering in GaAs
ÕAlx
Ga
1ÀxAs quantum wells
K. W. Sun*and T. S. SongDepartment of Electronic Engineering, Feng Chia University, Taichung, Taiwan, Republic of China
C.-K. Sun and J. C. Wang
Department of Electrical Engineering and Graduate Institute of Electro-Optical Engineering, National Taiwan University, Taipei, Taiwan, Republic of China
M. G. Kane
Sarnoff Corporation, Princeton, New Jersey 08543
S. Y. Wang and C. P. Lee
Department of Electronics Engineering and Institute of Electronics, National Chiao Tung University, Hsin Chu, Taiwan, Republic of China
共Received 7 December 1999; revised manuscript received 14 March 2000兲
We have studied carrier dynamics in highly nonequilibrium two-dimensional 共2D兲 carrier distributions generated with femtosecond laser pulses in p-doped GaAs/Al0.32Ga0.68As quantum wells at photoexcited carrier
densities between 109and 1011cm⫺2. The initially nonthermal carrier distribution is quickly broadened due to inelastic carrier-carrier scattering, with the broadening rate increasing as carrier density is increased. Measure-ments of the unrelaxed peak height in the hot electron-neutral acceptor luminescence spectra are compared with calculations of the carrier distribution using integration of the 2D dynamically screened Boltzmann equation. Our results indicate that carrier-carrier scattering becomes as significant a scattering mechanism as LO-phonon emission at density of about 1010cm⫺2.
I. INTRODUCTION
Femtosecond optical spectroscopy has proven to be a very useful tool for the study of fundamental nonequilibrium properties in semiconductors.1–9 Femtosecond excitation of GaAs can generate an initial highly nonequilibrium electron distribution, which then thermalizes to an equilibrium distri-bution by carrier-carrier interactions and phonon emission. Thermalization times of 50 to 300 fsec have been deduced from hole burning in transient absorption spectra for excita-tion below the optical-phonon energy.3–5Luminescence up-conversion experiments reveal the rapid redistribution of electrons and holes over a wide energy range within the first 100 fsec after excitation at densities larger than 1017cm⫺3, demonstrating the dominant role of carrier-carrier scattering at these carrier densities.8Carrier-carrier interactions among highly nonequilibrium photoexcited carriers in GaAs have been studied at injected carrier densities from 1015 to 1017cm⫺3in Refs. 2, 10, and 11. The rate of carrier-carrier scattering within the highly nonequilibrium distribution cre-ated by laser excitation is comparable to the LO-phonon emission rate of approximately 1/共150 fsec兲 共Refs. 12–15兲 at a carrier density of about 1016cm⫺3.
While there are still questions remaining, it appears safe to say that hot electron relaxation in bulk GaAs is relatively well understood. However, in 2D the situation is unclear. Less experimental data on carrier-carrier scattering rates are available for 2D carriers than 3D carriers. Kash has studied the energy loss rate of a hot electron to a thermalized electron-hole plasma in GaAs/AlxGa1⫺xAs quantum wells.16 Knox and co-workers studied scattering among 2D carriers in a nonthermal distribution.4,17,18They found that at an in-jected carrier density of 2⫻1010cm⫺2 in undoped quantum
wells electrons scatter out of the initial distribution in about 100 fsec and form a thermal distribution in about 200 fsec. Kane calculated 2D carrier-carrier scattering rates and found qualitative agreement with the results of Knox and co-workers.19
In this report we have made time-resolved measurements of the electron distribution at densities between 109 and 1011cm⫺2. We excited the sample with an ultrafast optical pulse and measured the time-integrated hot electron to neu-tral acceptor 关hot(e,Å)兴 luminescence spectrum as a func-tion of photoexcited carrier density. We are able to create a highly nonequilibrium distribution of energetic carriers be-cause the 120 fsec laser pulses are shorter than the LO-phonon emission time 共⬃150 fsec兲.20–25 By measuring the height of the first unrelaxed peak in the hot(e,Å) lumines-cence spectra, we are able to sample the electron distribution within an LO-phonon emission time.
II. EXPERIMENTAL RESULTS
The MQW samples studied here were 5 nm GaAs wells with 25 nm thick Al0.32Ga0.68As barriers. The quantum wells
were p-doped with Be at a density of 1018cm⫺3in the central 1 nm of each well. The quantum well samples consisted of a stack of 40 wells and were grown on 关100兴 undoped GaAs substrates. For all experiments reported here, the samples were held in a closed-cycle cryostat refrigerator at T⫽10 K to ensure that virtually all the acceptors were neutral and to reduce the equilibrium LO-phonon occupancy to insignifi-cant levels. The hot(e,Å) luminescence spectra are taken with a SPEX Triplemate spectrometer and a liquid-nitrogen
PHYSICAL REVIEW B VOLUME 61, NUMBER 23 15 JUNE 2000-I
PRB 61
cooled CCD detector. The experiments have employed two excitation sources–an argon ion laser-pumped cw dye laser and a self-mode-locked Ti:sapphire laser. The cw dye laser was operated at an energy of 1.797 eV, and the self-mode-locked Ti:sapphire laser, which generated 120 fsec optical pulses at a 80 MHz repetition rate, was operated at the same energy. An optical multichannel analyzer was used to moni-tor the laser pulse width throughout the experiments.
Figure 1 shows the time-integrated luminescence spec-trum with the dye laser used to excite a low carrier density. The sharp peak at 1.756 eV and shoulder at 1.745 eV in Fig. 1 are first-order Raman peaks from photon scattering with GaAs-like and AlxGa1⫺xAs-like LO phonons. These peaks
will not be analyzed here. In Fig. 1, the peak at 1.73 eV is the unrelaxed peak due to electrons that have been excited by the laser pulse to the lowest conduction subband from the lowest heavy-hole subband by the laser pulse and have re-combined with neutral acceptors. The peak below this one at 1.695 eV is a superposition of a peak due to electrons excited from the heavy-hole subband that have emitted one 37 meV LO phonon, and electrons excited from the lowest light-hole subband. Nevertheless, the well-defined higher peak at 1.73 eV demonstrates that 2D photoexcited electrons relax through successive LO-phonon emission events before re-combining with neutral acceptors.
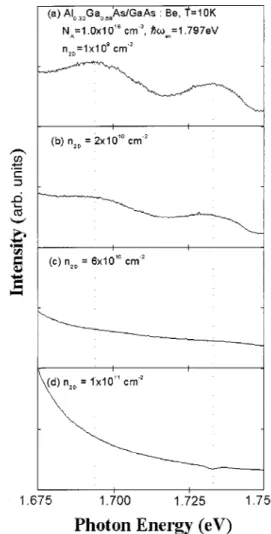
In Fig. 2 we show spectra obtained using a self-mode-locked Ti:sapphire laser as the excitation source. By defocus-ing the laser, the injected carrier density was varied from 109 to 1011cm⫺2. Using a periscope arrangement behind the en-trance slit in the spectrometer, the photoexcited carrier den-sities are determined from the laser spot size on the sample and the absorption coefficient of the QW samples at the ex-citation wavelength. Our detection system is adjusted to sample only the central half of the laser spot, thus minimiz-ing uncertainties associated with non-uniform injection. We have also compared our estimated carrier densities with those obtained in differential-transmission type experiments,4,16–18 in which the absorption depth can be accurately determined, and our estimate of the injected carrier densities agrees within a factor of 2. 共Carrier diffusion can be ignored on a femtosecond time scale.兲
The spectra for injected carrier densities from 109 to 1011cm⫺2are shown in Figs. 2共a兲–2共d兲. The unrelaxed peak begins to decrease at carrier densities above 109cm⫺2. As the injected carrier density is increased to 1011cm⫺2, the peaks disappear. The unrelaxed peak corresponds to the elec-tron distribution near the initial energy during the first 150 fsec 共the LO-phonon emission time兲, convolved with density-independent broadening mechanisms such as acceptor-acceptor interactions. We find no change in the linewidth of the peak, and thus measurements of the inte-grated area under the peak give the same results as measur-ing the peak height. In Fig. 3 we plot the unrelaxed peak intensity relative to the background 共which remains rela-tively constant兲 in each spectrum as a function of injected carrier density. The probability is small that an electron will be scattered out of this peak before emitting a LO phonon if, during a LO-phonon emission time, scattering transfers little energy among carriers relative to the width of the peak. Thus at low densities the unrelaxed peak is unaffected by carrier-carrier scattering. At higher densities, however, the interac-tions among carriers are stronger, and at sufficiently high densities carrier-carrier scattering will reduce the height of the unrelaxed peak. The height of the unrelaxed peak thus allowed us to compare the relative importance of carrier-carrier scattering and LO-phonon emission for the scattering FIG. 1. Time-integrated luminescence spectrum of GaAs
quan-tum wells during cw excitation at 1.797 eV. The carrier density is low. The peak at 1.73 eV corresponds to electrons that have been excited to the lowest conduction subband from the lowest heavy-hole subband, and have recombined with neutral acceptors without emitting an LO phonon.
FIG. 2. Time-integrated luminescence spectrum of GaAs quan-tum wells excited by 120 fsec pulses at varying carrier densities. Carrier-carrier scattering causes the peaks to disappear as the carrier density is increased.
of energetic electrons. We interpret the decrease of the unre-laxed peak height with increasing carrier density as evidence of the increasing importance of carrier-carrier scattering rela-tive to LO-phonon scattering.
III. RESULTS OF CALCULATIONS
The method used for our calculations have been described previously.19Our calculations model a 2D layer of carriers in a single GaAs quantum well. The time evolution of the car-riers is calculated using the 2D dynamically screened Boltz-mann equation. The dynamic dielectric function includes the 2D carrier susceptibility, calculated in the random-phase ap-proximation 共RPA兲, and the Frohlich lattice susceptibility. Both electrons and holes are included. For simplicity we treat all holes as heavy holes, rather than partitioning the holes between heavy- and light-hole valence bands. This is expected to lead to a slight overestimate of the scattering rate in the calculations, since the in-plane effective mass of heavy holes (mhh⫽0.11m0) is more closely matched than the
in-plane effective mass of light holes (mlh⫽0.23m0) to the in-plane electron effective mass (me⫽0.0667m0). 共The terms
‘‘heavy hole’’ and ‘‘light hole’’ refer to the 3D states from which the 2D states are derived; this accounts for the 2D heavy holes being lighter than the 2D light holes.兲 The en-ergy of the incident photon is partitioned appropriately be-tween electrons and heavy holes.
We model the 2D carriers in the quantum limit, as de-scribed in Ref. 19. This means that our calculations are based on a 2D Coulomb matrix element that is, strictly speaking, correct only for infinitely narrow quantum wells. The effect of quantum confinement is to increase the carrier-carrier scattering rate, and corrections to the quantum limit for finite well widths will modify the results in the direction of 3D behavior, i.e., slower scattering. Thus the use of the quantum limit is a second reason why the calculated results are ex-pected to slightly overestimate the scattering rate that occurs in finite-width quantum wells.
The calculated evolution of the electron and hole distribu-tions is followed for 150 fsec, the LO-phonon emission time. The initial and final electron distributions for various
densi-ties are shown in Fig. 4. The final distributions correspond to the unrelaxed peaks measured in our experiments. At higher densities sidebands can be observed in the final distributions, separated from the main peak by the 37 meV LO-phonon energy. These sidebands are rather small and have not been observed experimentally. They are due to resonant enhance-ment of the carrier-carrier scattering by the Frohlich lattice interaction, which yields a large cross section for scattering events that exchange the LO-phonon energy. Our calcula-tions reproduce this effect because they include the dynamic lattice susceptibility in the dielectric function. We have ob-served this resonant enhancement in 3D calculations as well, but have found that it is very weak in 3D because changing an electron’s energy by 37 meV involves a large momentum transfer, which is suppressed in 3D by the 1/q4 dependence of the squared Coulomb matrix element. In 2D, however, the squared matrix element has a 1/q2 dependence, rendering these 37 meV energy transfers more likely. Physically, this corresponds to the fact that lowering the dimensionality re-stricts the space available for glancing collisions, so that a larger fraction of the carrier collisions are close impacts in 2D than in 3D.
Figure 3 presents the results of our 2D scattering calcula-tions with the experimental data. We have normalized the calculated final peak height at 109cm⫺2 to the measured peak height at this density, then applied the same scaling factor to the calculated peak heights at higher densities. The agreement between measured and calculated results is good. At densities higher than 1010cm⫺2 the calculations predict more rapid scattering than is measured. As noted above, the approximations used in the calculations should lead to a slight overestimate in the calculated scattering. However, both measured and calculated results predict that at densities higher than about 1010cm⫺2, carrier-carrier scattering be-comes the dominant scattering process among 2D carriers.
IV. CONCLUSION
Our experimental results and our calculations show that at an injected carrier density of 109cm⫺2the dominant scatter-ing mechanism for photoexcited 2D electrons in GaAs quan-tum wells is LO-phonon emission. As the carrier density is FIG. 3. Unrelaxed peak height vs carrier density as a function of
carrier density. Experimental results are taken from data like that shown in Fig. 3. Calculated results are obtained by integrating the dynamically screened Boltzmann equation for 150 fsec.
FIG. 4. The initial and final electron energy distribution in pho-toexcited 2D plasmas at densities from 109 to 6⫻1010cm⫺2, as calculated by integrating the dynamically screened Boltzmann equation for 150 fsec. All distributions are normalized to the total density.
increased from 109 to 1011cm⫺2, the carrier-carrier scatter-ing rate increases, and at carrier densities greater than 1010cm⫺2, carrier-carrier scattering is the dominant scatter-ing process.
ACKNOWLEDGMENT
This work was supported by the National Science Council of Republic of China under Grant Nos. NSC87-2112-M-035-004 and NSC86-2112-M-035-008.
*Author to whom all correspondence should be addressed. FAX: 886-4-4510405. Electronic address: [email protected]
1D. W. Snoke, W. W. Ruhle, Y. C. Lu, and E. Bauser, Phys. Rev.
Lett. 68, 990共1992兲; Phys. Rev. B 45, 10979 共1992兲.
2A. Leitenstorfer, C. Furst, Alaubereau, and W. Kaiser, Phys. Rev.
Lett. 76, 1545共1996兲.
3J. L. Oudar, D. Hulin, A. Migus, A. Antonetti, and F. Alexandre,
Phys. Rev. Lett. 55, 2074共1985兲.
4
W. Knox, C. Hirlimann, D. A. B. Miller, J. Shah, D. S. Chemla, and C. V. Shank, Phys. Rev. Lett. 56, 1191共1986兲.
5J. P. Foing, D. Hulin, M. Joffre, M. K. Jackson, J. L. Oudar, C.
Tanguy, and M. Combescot, Phys. Rev. Lett. 68, 110共1992兲.
6C. V. Shank, R. L. Fork, R. F. Leheny, and J. Shah, Phys. Rev.
Lett. 42, 112共1979兲.
7J. F. Ryan, R. A. Taylor, A. J. Turberfield, A. Maciel, J. M.
Worlock, A. C. Gossard, and W. Wiegmann, Phys. Rev. Lett.
53, 1841共1984兲.
8T. Elsaesser, J. Shah, L. Rota, and P. Lugli, Phys. Rev. Lett. 66,
1757共1991兲.
9J. Shah, B. Deveaud, T. C. Damen, W. T. Tsang, A. C. Gossard,
and P. Lugli, Phys. Rev. Lett. 59, 2222共1987兲.
10K. W. Sun, M. G. Kane, and S. A. Lyon, Europhys. Lett. 26, 123 共1994兲.
11A. Leitenstorfer, T. Elsaesser, F. Rossi, T. Kuhn, W. Klien, G.
Boehm, G. Traenkle, and G. Weimann, Phys. Rev. B 53, 9876
共1996兲.
12G. Fasol, W. Hackenberg, H. P. Hughes, K. Ploog, E. Bauser, and
H. Kano, Phys. Rev. B 41, 1461共1990兲.
13B. P. Zakharchenya, V. D. Dymnikov, I. Ya. Karlik, and I. I.
Reshina, J. Phys. Soc. Jpn. 49, 573共1980兲.
14J. A. Kash, J. M. Hvam, and J. C. Tsang, Phys. Rev. Lett. 54,
2151共1985兲.
15B. P. Zakharchenya, D. N. Mirlin, V. I. Perel, and I. I. Reshina,
Usp. Fiz. Nauk关Sov. Phys. Usp. 25, 143 共1982兲兴.
16
J. A. Kash, Phys. Rev. B 48, 18336共1993兲.
17W. H. Knox, D. S. Chemla, G. Livescu, J. E. Cunningham, and J.
E. Henry, Phys. Rev. Lett. 61, 1290共1988兲.
18W. H. Knox, Solid-State Electron. 32, 1057共1989兲. 19M. G. Kane, Phys. Rev. B 54, 16345共1996兲.
20B. P. Zakharchenya, P. S. Kop’ev, D. N. Mirlin, D. G. Polakov, I.
I. Reshina, V. F. Sapega, and A. A. Sirenko, Solid State Com-mun. 69, 203共1989兲.
21C. V. Shank, R. L. Fork, R. Yen, J. Shah, B. I. Greene, A. C.
Gossard, and C. Weisbuch, Solid State Commun. 47, 981
共1983兲.
22J. Shah, IEEE J. Quantum Electron. QE-22, 1728共1986兲. 23S. A. Lyon, Superlattices Microstruct. 3, 261共1987兲.
24D. N. Mirlin and V. I. Perel’, Semicond. Sci. Technol. 7, 1221 共1992兲.
25D. Collings, K. L. Schumacher, F. Raksi, H. P. Hughes, and R. T.
Philips, Appl. Phys. Lett. 64, 889共1994兲.