The violation of the Stokes–Einstein relation
in supercooled water
Sow-Hsin Chen*†, Francesco Mallamace*‡, Chung-Yuan Mou§, Matteo Broccio*‡, Carmelo Corsaro‡, Antonio Faraone‡¶, and Li Liu*储
*Department of Nuclear Science and Engineering, Massachusetts Institute of Technology, Cambridge, MA 02139;‡Dipartimento di Fisica and Consorzio Nazionale Interuniversitario per le Scienze Fisiche della Materia, Universita` di Messina, I-98166 Messina, Italy; and§Department of Chemistry, National Taiwan University, Taipei 106, Taiwan
Edited by H. Eugene Stanley, Boston University, Boston, MA, and approved June 27, 2006 (received for review April 21, 2006) By confining water in nanopores, so narrow that the liquid cannot
freeze, it is possible to explore its properties well below its homogeneous nucleation temperature TH⬇ 235 K. In particular, the
dynamical parameters of water can be measured down to 180 K, approaching the suggested glass transition temperature Tg⬇ 165
K. Here we present experimental evidence, obtained from Nuclear Magnetic Resonance and Quasi-Elastic Neutron Scattering spec-troscopies, of a well defined decoupling of transport properties (the self-diffusion coefficient and the average translational relax-ation time), which implies the breakdown of the Stokes–Einstein relation. We further show that such a non-monotonic decoupling reflects the characteristics of the recently observed dynamic cross-over, at⬇225 K, between the two dynamical behaviors known as
fragile and strong, which is a consequence of a change in the hydrogen bond structure of liquid water.
decoupling of transport properties兩 dynamic crossover 兩 MCM-41
D
espite its fundamental importance in science andtech-nology, the physical properties of water are far from completely understood. The liquid state of water is unusual, especially at low temperatures (1–3). For example, contrary to other liquids, water behaves as if there exists a singular temperature toward which its thermodynamical properties, such as compressibility, thermal expansion coefficient, and specific heat, diverge (1). The efforts of scientists from many disciplines to seek a coherent explanation for this unusual behavior, in combination with its wide range of impacts, make water one of the most important open questions in science today. On the other hand, the nature of the glass transition (GT) of water represents another challenging subject for current research (4). Dynamical measurements in glass-forming liquids have shown a dramatic slowdown of both
macroscopic (viscosity and self-diffusion coefficient D) and
microscopic (average translational correlation time)
observ-ables, as temperature is lowered toward the GT temperature
Tg. Accordingly, a comprehension of the GT has been sought
through the study of the dynamics at the molecular level, which, despite all efforts, has not yet been completely under-stood (5– 8). Keeping in mind the ‘‘complexities’’ of both low-temperature water and its GT, we present here direct measurements of two dynamical parameters of water: the self-diffusion coefficient and the average translational relax-ation time, in the temperature range from 280 to 190 K, obtained by NMR and quasi-elastic neutron scattering (QENS) experiments, respectively.
Bulk water can be supercooled below its melting
tempera-ture (TM) down to⬇235 K, below which it inevitably
crystal-lizes; it is just in such supercooled metastable state that the anomalies in its thermodynamical properties are most pro-nounced, showing a power law divergence toward a singular
temperature TS⫽ 228 K. At ambient pressure, water can exist
in a glassy form below 135 K. Depending on T and P, glassy water has two amorphous phases with different structures: a
low (LDA) and a high (HDA) density amorphous ice; thus it shows a polymorphism. LDA can be formed from HDA and vice versa; LDA, if heated, undergoes a glass-to-liquid transi-tion transforming into a highly viscous f luid, then crystallizes
into cubic ice at TX ⬇ 150 K. Thus, an experimentally
inaccessible T region exists in bulk water between THand TX.
Experiments performed within this interval could be of fun-damental interest for understanding the many open questions on the physics of water. For example, the presence of a first order liquid–liquid transition line (LLTL), the precise location
of its Tg, recently suggested at⬇165 K (4, 9), and the existence
of a fragile-to-strong dynamic crossover (FSC) on approaching
Tgfrom the liquid side (10). The existence of a LLTL leads to
conjecture that liquid water possesses a low-temperature
second critical point (predicted to be located at Tc⬇ 220 K, Pc
⬇ 1 Kbar) (2), below which it can switch from one phase, a high-density liquid (HDL), to another phase, a low-density liquid (LDL), whose corresponding vitreous forms are the HDA and LDA, respectively. The difference between the two liquid phases lies in the water structure: in the HDL, the local tetrahedrally coordinated hydrogen-bond network is not fully developed, whereas in the LDL, a more open, locally ice-like,
hydrogen-bond network is fully developed (11). Thus, near Tc,
water is a mixture of both LDL and HDL phases associated with a diverging density f luctuation. At higher temperatures, the two liquid phases are indistinguishable. Lowering temper-ature or increasing pressure will result in an increase of the LDL phase with respect to the HDL phase. The FSC can be identified by the temperature at which transport properties,
like the shear viscosity or the inverse self-diffusion
coeffi-cient 1兾D, cross over from a non-Arrhenius (fragile) to an
Arrhenius (strong) behavior on approaching Tg.
A possibility to enter this inaccessible temperature range of water, named ‘‘no-man’s-land,’’ is now shown by confining water in nano-size pores (12–15). When contained within these pores,
water does not crystallize, and can be supercooled well below TH.
Vycor pores (14, 15) (a porous hydrophilic silica glass), micellar systems, or layered vermiculite clay (12) are examples of con-fining nanostructures. The latter systems have been used to
Conflict of interest statement: No conflicts declared. This paper was submitted directly (Track II) to the PNAS office.
Abbreviations: GT, glass transition; QENS, quasi-elastic neutron scattering; HDL, high-density liquid; LDL, low-high-density liquid; MD, molecular dynamics; SER, Stokes–Einstein relation; VTF, Vogel–Fulcher–Tamman
See Commentary on page 12955.
†To whom correspondence should be addressed. E-mail: sowhsin@mit.edu.
¶Present addresses: Department of Material Science and Engineering, University of
Mary-land, College Park, MD 20742, and National Institute of Standards and Technology Center for Neutron Research, Gaithersburg, MD 20899.
储Present address: Department of Mechanical, Aerospace, and Nuclear Engineering, Rens-selaer Polytechnic Institute, Troy, NY 12180.
explore the Arrhenius behavior of the dielectric relaxation time
(D) of very deeply supercooled water.
The FSC was recently confirmed by a QENS experiment, which measured the T and P dependences of the average
translational relaxation time具T典 for water confined in
nanop-ores of silica glass (16, 17). In particular, as the temperature is
lowered, a 具T典 versus 1兾T plot exhibits a cusp-like crossover
from a non-Arrhenius to an Arrhenius behavior at a temperature
TL(P). This crossover temperature decreases steadily upon
in-creasing P, until it intersects the THline of bulk water at P⬇ 1.6
Kbar. Beyond this point, the FSC can no longer be identified. These results, suggestive of the existence of the two liquid phases, have been explained in a molecular dynamics (MD) simulation study by considering the existence of a critical point. The MD study shows that the FSC line coincides with the line of
specific heat maxima Cpmax, called Widom line. The Widom line
is the critical isochore above the critical point in the one-phase region (18). Moreover, it is observed that crossing this line corresponds to a change in the T dependence of the dynamics. More precisely, the calculated water diffusion coefficient, D(T), changes according to a FSC, whereas the structural and ther-modynamic properties change from those of HDL to those of LDL.
Results and Discussion
In this report, we present a detailed study done by using two different experimental techniques, neutron scattering and NMR, to probe dynamical properties of confined water at low temper-atures, well inside the inaccessible region of bulk water. Our main aim is to clarify the properties of water as a glass forming
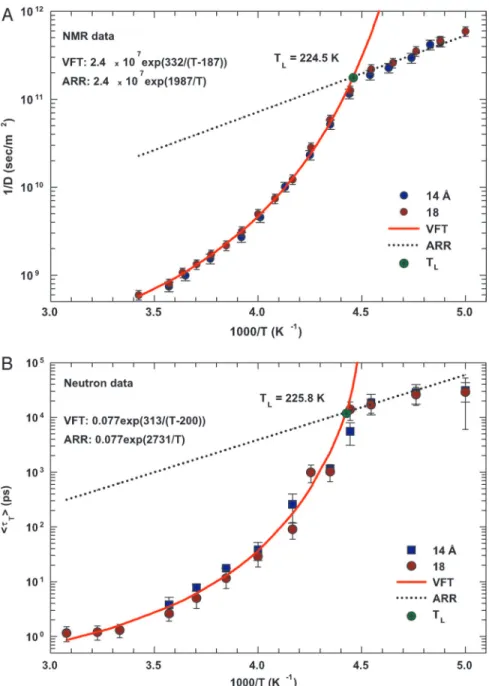
Fig. 1. The temperature dependence of the inverse of self-diffusion coefficient of water and its average translational relaxation time. (A) For the fully hydrated MCM-41-S samples with diameters of 14 and 18 Å, the inverse of the self-diffusion coefficient of water D measured by NMR as a function of 1兾T in a log-linear scale. The solid line denotes the fit of the data to a VFT relation. The short dotted line denotes the fit to an Arrhenius law with the same prefactor 1兾D0. (B) The average translational relaxation time具T典 obtained from QENS spectra in the same experimental conditions of the NMR experiment as a function of 1兾T. The dashed line denotes the VFT law fit, and the dotted line denotes the Arrhenius law fit with the same prefactor0. The values of fitting parameters are shown.
APPLIED
PHYSICAL
SCIENCES
SEE
material, measuring directly, with NMR spectroscopy, the self-diffusion coefficient D as a function of temperature, and com-paring the obtained results with the translational relaxation time
具T典 measured by QENS. 具T典 is a quantity proportional to the
viscosity . These measurements enable one to compare the
proportionality of the transport coefficient 1兾D and viscosity,
and can provide a test for the theoretical description of dynamics at the molecular scale of glass-forming materials. According to Ito et al. (10), the FSC can be intimately connected to the presence of a thermodynamic event in liquid water: i.e., the temperature dependence of the inverse self-diffusion coefficient does not follow that of viscosity or inverse mutual diffusion coefficient. In other words, supercooled water must show, on
approaching Tg, the marked decoupling of translational diffusion
coefficient from viscosity or rotational correlation time, as recently observed in some supercooled liquids (19–21). Here we confirm by means of NMR data the existence of a FSC in supercooled water, as proposed by the QENS and MD studies (16–18) and show that the Stokes–Einstein relation (SER) breaks down in different ways on both the fragile and strong sides of FSC.
Fig. 1A shows a log-linear plot of the inverse of the
self-diffusion coefficient of water 1兾D measured by NMR as a
function of 1兾T for the fully hydrated MCM-41-S samples with
pore diameters of 14 and 18 Å. Fig. 1B shows the average
translational relaxation time具T典, obtained by analyzing QENS
spectra of the same samples, versus 1兾T, using the
Relaxing-Cage Model (RCM) as shown in refs. 16 and 17. As can be
observed from Fig. 1, the measured values of D and具T典 are
independent of the pore size of the samples. This observation indicates that NMR field-gradient measurements, having a length scale larger than the size of the pores, are insensitive to the system geometry. In Fig. 1 A, the solid line denotes the fit of
the data to a Vogel–Fulcher–Tamman (VFT) law 1兾D ⫽
1兾D0exp(BT0兾(T ⫺ T0)), where 1兾D0⫽ 2.4 ⫻ 107(s兾m2), B⫽
1.775, and T0⫽ 187 K. B is a constant providing a measure of
the system fragility, and T0is the ideal GT temperature. The
short dotted line denotes the fit to an Arrhenius law 1兾D ⫽
1兾D0exp(EA兾kBT), where we keep the same 1兾D0value as in the
VFT law fit, and EA⫽ 3.98 Kcal兾mol. Fig. 1B shows the 具T典 data
at ambient pressure. The dashed lines denote the VFT law fit,
and the dotted lines denote the Arrhenius law fit, with the same
prefactor 0. We obtained the following values: EA ⫽ 5.4
Kcal兾mol, T0⫽ 200 K. The consequence of insisting on the same
prefactor in both the VFT and the Arrhenius laws results in an
equation determining the crossover temperature TL in the
following form: 1兾TL⫽ 1兾T0⫺ BkB兾EA. We obtained TL⫽ 224.5
K from the 1兾D data and TL⫽ 225.8 K from the 具T典 data. The
agreement between NMR and QENS results is thus satisfactory,
especially regarding the two relevant quantities EAand TL. Fig.
1 also shows that within the size range of 10–20 Å, the crossover
temperature TL is independent of pore size. As previously
mentioned, a FSC occurring at 228 K has been proposed by Ito et al. (10) for water, which is fragile at room and moderately supercooled temperatures, but has been shown to be a strong liquid by dielectric relaxation measurements near the GT tem-perature (12). The interpretation of this transition as a variant of the structural arrest transition (as predicted by the ideal mode coupling theory) was the essence of the recent QENS study of the structural relaxation time and MD study of the self-diffusion coefficient (16–18). These NMR results presented above con-stitute, by means of a direct measurement of the self-diffusion coefficient of supercooled water, an independent confirmation of the existence of FSC in water.
Let us now focus on the SER that relates the self-diffusion
coefficient D, viscosity, and temperature T as D ⬀ T兾, which,
as it is well known, is usually accurate for normal- and
high-temperature liquids. Because具T典 is proportional to the viscosity,
we examine the relationship between D and具T典 in Fig. 2. In Fig.
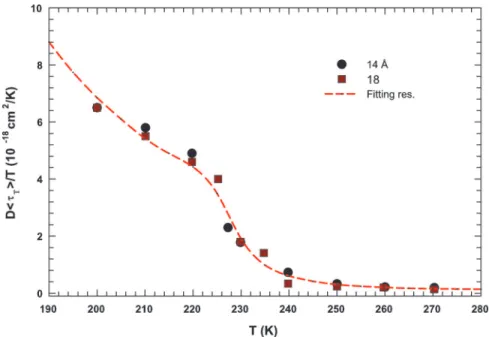
2, the quantity D具T典兾T is reported as a function of T. Dots and
squares represent its values coming from the experimental data of samples with pore diameters of 14 and 18 Å, respectively, whereas the dotted line represents the same quantity obtained by using the corresponding fitted lines reported in Fig. 1. The
temperature dependence of D具T典兾T shows that this quantity is
constant at higher T, but increases steeply as T goes below the FSC temperature. Furthermore, it shows a small bump at the FSC temperature, in accordance with the predictions of a recent theoretical study (22). Therefore, in the supercooled region the
temperature behavior of D and具T典 is inconsistent with SER,
signaling a marked decoupling between these two transport parameters, on decreasing T. In recent experimental studies on
Fig. 2. The quantity D具T典兾T as a function of T. Dots and squares represent its values coming from the experimental data of D and 具T典 in samples with diameters of 14 and 18 Å, respectively. The dotted line represents same quantity obtained by using the fitting values obtained from the data reported in Fig. 1.
some supercooled liquids, it has been reported that SER breaks down as the GT is approached. The self-diffusion coefficient shows, as far as water in the present experiment is concerned, an enhancement of orders of magnitude from what expected from SER (19–21, 23, 24). These decouplings of the transport coef-ficients, observed as a SER violation, have been attributed to the occurrence of dynamical heterogeneities in structural glass form-ers (19, 21, 25, 26). Thus, in supercooled liquids there exist regions of varying dynamics, i.e., fluctuations that dominate their transport properties near the GT. The extent of such decouplings may depend on the material and the microscopic details of the specific transport parameters.
The SER breakdown can be described by using a scaling
concept, in particular, the law D⬇⫺, where ⫽ ␣(T)兾(T),
with␣ and  being temperature-dependent scaling exponents of
D and, respectively (27). Recently, it has been shown that, for
Tris-naphthylbenzene (a fragile glass former), ⫽ 0.77 (21),
whereas an MD simulation of Lennard–Jones binary mixture has
given ⫽ 0.75 (28). By using such an approach, we will discuss
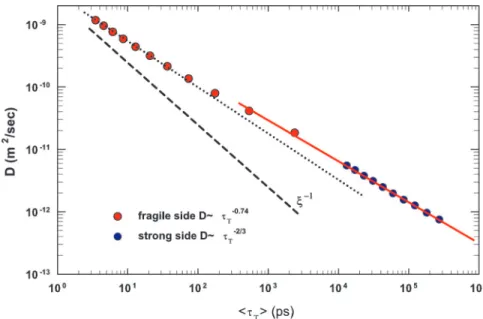
our SER results for confined supercooled water. Fig. 3 shows the D vs.具T典 plot in a log–log scale. The red dots represent data
corresponding to temperatures above TL, where water behaves as
a fragile glass former, and the blue dots pertain to the strong Arrhenius region. As it can be observed, the data clearly show two different scaling behaviors above and below the FSC
tem-perature, in particular ⯝ 0.74 on the fragile side (dotted line)
and ⬇2兾3 on the strong side (solid line). The dashed line
represents the situation in which SER holds, D ⬇⫺1. These
results agree with those obtained in Tris-naphthylbenzene (21) and, more specifically, with those of a recent theoretical study in which the decoupling of transport coefficients in supercooled liquids was investigated by using two class of models, one describing diffusion in a strong glass former, and the other in a fragile one (27). The main result of this study is that, while in the fragile case, the SER violation is weakly dependent on the
dimensionality d, with ⫽ 0.73, in the strong case the violation
is sensitive to d, going as D⬇⫺2/3for d⫽ 1, and as D ⬇⫺0.95
for d⫽ 3. On considering the geometry of the system that we
have used in our experiment to confine water (1D cylindrical tubes, with a length of some micrometers and pore diameters of 14 and 18 Å), the scaling plot shown in Fig. 3 compares
remarkably well with the findings of the theoretical investigation (27) on both fragile and strong sides.
In summary, we explore dynamical properties of water in a deeply supercooled regime (well inside the ‘‘no-man’s land’’) by means of NMR and QENS experiments, which separately give a conclusive proof of the existence of a FSC. This finding supports the hypothesis that liquid water is consisting of a mixture of two different liquid structures (the LDL and HDL phases). Accord-ingly, a liquid–liquid phase separation line exists in the P–T plane with a liquid–liquid critical point as its end point. Remarkably, we give experimental proof of the existence of a violation of SER above and below the FSC in water, i.e., in both the fragile and strong regimes of supercooled water. This result clearly reflects the decoupling of transport coefficients of the liquid when
temperature is lowered toward Tg. This latter result certainly
constitutes an element that serves to clarify one of the most intriguing properties of water.
Methods
Water was confined in micellar-templated mesoporous silica matrices MCM-41-S, which have 1D cylindrical pores with a length of some micrometers arranged in 2D hexagonal arrays, synthesized after a similar method for the previous synthesis of MCM-48-S (29). The MCM-41-S materials are the same as those used in the QENS study of confined water (17). Pore size was determined by using a nitrogen absorption–desorption
tech-nique (16, 17). Investigated samples have hydration levels of H⯝
0.5 (0.5 g of H2O per g of MCM-41-S), obtained by exposing dry
powder samples to water vapor at room temperature in a closed chamber. This water-confining system can be regarded as one of the most suitable adsorbent models currently available (30, 31). High-resolution QENS spectroscopy method was used to
determine the temperature dependence of 具T典 for confined
water. Because neutrons can easily penetrate the wall of sample cell and because they are predominantly scattered by hydrogen atoms in water, rather than by the matrices containing them, incoherent QENS is an appropriate tool for our study. Using two separate high-resolution QENS spectrometers, we were able to measure the translational-relaxation time from 0.2 to 10,000 ps over the whole temperature range under study.
Fig. 3. The scaling plot in a log–log scale of D vs.具T典. Red dots are data corresponding to temperatures above TL, i.e., when water is in the fragile glass phase, whereas blues dots correspond to the strong Arrhenius region. Two different scaling behaviors exist above and below the temperature of the FST. In the fragile region, the scaling exponent is ⯝ 0.74 (dotted line) and ⬇2兾3 in the strong side (solid line). Dashed line represents the situation in which the SER holds, D ⬇ ⫺1.
APPLIED
PHYSICAL
SCIENCES
SEE
The experiments were performed at both the High-Flux Backscattering (HFBS) and the Disk-Chopper Time-of-Flight (DCS) spectrometers in the National Institute of Standards and Technology Center for Neutron Research (NIST NCNR). The two spectrometers have two widely different dynamic ranges (for the chosen experimental setup), one with an energy resolution
of 0.8eV (HFBS) and a dynamic range of ⫾11 eV (32), and
the other with an energy resolution of 20 eV (DCS) and a
dynamic range of⫾0.5 meV (33) to be able to extract the broad
range of relaxation times from the measured spectra. The experiment was done at a series of temperatures, covering both below and above the transition temperature, and the data were analyzed by using Relaxing-Cage Model to extract the average
translational relaxation time具T典.
The NMR experiments on fully hydrated MCM-41-S samples with pore diameters of 18 and 14 Å were performed at ambient pressure by using a Bruker AVANCE NMR spectrometer, operating at 700-MHz proton resonance frequency. The self-diffusion coefficient of water D was measured with the pulsed gradient spin–echo technique (PGSE) (34, 35) in the
tempera-ture range 190–298 K (with an accuracy of ⫾0.2 K). The T
dependence of the chemical shift of methanol was used as a T standard. All details about the NMR experiment and the sample properties are reported elsewhere (36). The reported D values were derived from the measured mean square displacement
具r2(t)典 of molecules diffusing along the NMR pulsed-field
gra-dients direction r, during the time interval t.
We thank Chun-Wan Yen (National Taiwan University) for preparing MCM-41-S samples. Technical supports in QENS measurements from E. Mamontov and J. R. D. Copley (National Institute of Standards and Technology Center for Neuron Research) are greatly appreciated. The research at MIT is supported by Department of Energy Grants DE-FG02-90ER45429 and 2113-MIT-DOE-591. The research in Messina is supported by the MURST-PRIN2004. The research at National Taiwan University is supported by the National Science Council of Taiwan. This work used facilities supported in part by the National Science Foundation under Agreement No. DMR-0086210 and facilities of the Messina SCM-HR-NMR Center of Consiglio Nazionale delle Ricerche– L’Istituto Nazionale per la Fisica della Materia. We benefited from affiliation with European Union Marie-Curie Research and Training Network on Arrested Matter.
1. Angell, C. A. (1982) in Water: A Comprehensive Treatise, ed. Franks, F. (Plenum, New York), Vol. 7, pp. 1–81.
2. Debenedetti, P. G. & Stanley, H. E. (2003) Phys. Today 56, 40–46. 3. Mishima, O. & Stanley, H. E. (1998) Nature 396, 329–335.
4. Velikov, V., Borick, S. & Angell, C. A. (2001) Science 294, 2335–2338. 5. Sokolov, A. P. (1996) Science 273, 1675–1676.
6. Go¨tze, W. & Sjo¨lander, L. (1992) Rep. Prog. Phys. 55, 241–376.
7. Angell, C. A. (1997) in Complex Behavior of Glassy Systems, eds. Rubı´, M. & Pe´res-Vicente, C. (Springer, Berlin).
8. Angell, C. A. (1995) Science 267, 1924–1935.
9. Poole, P. H., Sciortino, F., Essmann, U. & Stanley, H. E. (1992) Nature 360, 324–328.
10. Ito, K., Moynihan, C. T. & Angell, C. A. (1999) Nature 398, 492–495. 11. Soper, A. K. & Ricci, M. A. (2000) Phys. Rev. Lett. 84, 2881–2884. 12. Bergman, R. & Swenson, J. (2000) Nature 403, 283–286. 13. Koga, K., Tanaka, H. & Zeng, X. C. (2000) Nature 408, 564–567. 14. Webber, B. & Dore, J. (2004) J. Phys. Condens. Matt. 16, S5449–S5470. 15. Dore, J. (2000) Chem. Phys. 258, 327–347.
16. Faraone, A., Liu, L., Mou, C.-Y., Yen, C.-W. & Chen, S.-H. (2004) J. Chem.
Phys. 121, 10843–10846.
17. Liu, L., Chen, S.-H., Faraone, A., Yen, C.-W. & Mou, C.-Y. (2005) Phys. Rev.
Lett. 95, 117802-1–117802-4.
18. Xu, L. Kumar, P., S. Buldyrev, V., Chen, S.-H., Poole, P. H., Sciortino, F. & Stanley, H. E. (2005) Proc. Natl. Acad. Sci. USA 102, 16558–16562.
19. Ediger, M. D. (2000) Annu. Rev. Phys. Chem. 51, 99–128.
20. Fujara, F., Geil, B., Sillescu, H. & Fleishcer, G. (1992) Z. Phys. B 88, 195–204. 21. Swallen, S. F., Bonvallet, P. A., McMahon, R. J. & Ediger, M. D. (2003) Phys.
Rev. Lett. 90, 015901-1–015901-4.
22. Pan, A. C., Garrahan, J. P. & Chandler, D. (2005) Chem. Phys. Chem. 6, 1783–1785.
23. Chang, J. & Sillescu, H. (1997) J. Phys. Chem. B 101, 8794–8801. 24. Cicerone, M. T. & Ediger, M. D. (1996) J. Chem. Phys. 104, 7210–7218. 25. Xia, X. Y. & Wolynes, P. G. (2001) J. Phys. Chem. B 105, 6570–6573. 26. Ngai, K. L., Magill, J. H. & Plazek, D. J. (2000) J. Chem. Phys. 112 1887–1892. 27. Jung, Y.-J., Garrahan, J. P. & Chandler, D. (2004) Phys. Rev. E 69, 061205-1–
061205-7.
28. Yamamoto, R. & Onuki, A. (1998) Phys. Rev. Lett. 81, 4915–4918. 29. Shih, P.-C., Lin, H.-P. & Mou, C.-Y. (2003) Stud. Surf. Sci. Catal. 146, 557–560. 30. Schreiber, A., Ketelsen, I. & Findenegg, G. H. (2001) Phys. Chem. Chem. Phys.
3,1185–1195.
31. Morishige, K. & Nobuoka, K. (1997) J. Chem. Phys. 107, 6965–6969. 32. Meyer, A., Dimeo, R. M., Gehring, P. M. & Neumann, D. A. (2003) Rev. Sci.
Instrum. 74, 2759–2777.
33. Copley, J. R. D. & Cook, J. C. (2003) Chem. Phys. 292, 477–485. 34. Stejskal, E. O. & Tanner, J. E. (1965) J. Chem. Phys. 42, 288–292. 35. Price, W. S. (1998) Concepts Mag. Reson. 10, 197–237.
36. Mallamace, F., Broccio, M., Corsaro, C., Faraone, A., Wanderlingh, U., Liu, L., Mou, C.-Y. & Chen, S.-H. (2006) J. Chem. Phys. 124, 161102-1–161102-4.