The Response of U.S. Natural Gas Futures and Spot Prices to
Storage Change Surprises and the Effect of Escalating Physical
Gas Production
Song Zan Chiou-Wei
Department of Economics, Nan-Hua University, Chia-Yi, Taiwan Scott C. Linn*
Division of Finance, University of Oklahoma, Norman, OK 73019 USA Zhen Zhu
Department of Economics, College of Business, University of Central Oklahoma Edmond, OK 43034 USA
and
C. H. Guernsey and Company, 5555 North Grand Blvd., Oklahoma City, OK 73112 USA
March 16, 2013
* Corresponding author: Scott C. Linn, Division of Finance, Price College of Business,
205 A Adams Hall, University of Oklahoma, Norman, OK 73019 USA; Tel: 1 405 325 3444; E-mail address: slinn@ou.edu
We thank Louis Ederington, Peter Locke and an anonymous referee for their comments on an earlier draft of the paper. The authors gratefully acknowledge financial support for this research from the National Science Council of Taiwan, the University of Oklahoma and the Jackson College of Graduate Studies and Research at the University of Central Oklahoma. We also thank Andrew Stewart of Bloomberg for providing us with the analyst forecast data on natural gas in storage assembled by Bloomberg. An earlier version of this paper circulated under the title ““Fundamental News and the Behavior of Commodity Prices: Price Discovery and Jumps in U.S. Natural Gas Futures and Spot Prices”.
The Response of U.S. Natural Gas Futures and Spot Prices to
Storage Change Surprises and the Effect of Escalating Physical
Gas Production
ABSTRACT
We study the behavior of U.S. natural gas futures and spot prices on and around the weekly announcements by the U.S. Energy Information Administration of the amount of natural gas in storage. Our study spans August 2002 through August 2011. We identify an inverse empirical relation between changes in futures prices and surprises in the change in natural gas in storage and that this relation is not driven by the absolute size of the surprise. We also present direct evidence of price discovery occurring in the futures market for natural gas with that information then flowing to the spot market. We find that post 2005, corresponding to a period of significant increases in the production of natural gas in the United States, the response of prices to storage surprises became more negative. At a more general level our study provides insights into the association between price changes and information about changes in the amount of a commodity or asset held in storage and the implications of these associations for modeling the behavior of commodity prices changes.
1
The Response of U.S. Natural Gas Futures and Spot Prices to
Storage Change Surprises and the Effect of Escalating Physical
Gas Production
I. Introduction
Trading in the spot and derivatives energy markets continues to grow at an
unprecedented rate. At the same time these markets have become increasingly more
tightly integrated through the dependence of some cash market contract prices on futures
prices (Federal Energy Regulatory Commission (FERC), 2006). Not the least interesting
amongst the energy commodity markets is the market for natural gas. Open interest in
the NYMEX natural gas futures contracts grew at a compound annual rate of 13.5%
between January 1998 and January 2012 (http://www.cftc.gov/OCE/WEB/data.htm ). At
the same time extreme fluctuations in natural gas spot and futures prices have become
distinctive characteristics of these markets. Finally, the physical natural gas market has
undergone a significant transformation since 2005 with the ramping up of production
from shale fields such as those located in Texas (Barnett), Oklahoma (Woodford), and
Pennsylvania and surrounding states (Marcellus). Shale gas production now represents
roughly 14-15% of total natural gas production in the United States. To put this in
perspective between 1995 and 2005 annual gas production in the U.S. was fairly flat.
The years 2006-2011 on the other hand saw gross gas withdrawals rise at a compound
annual rate of roughly 4%.
Not surprisingly, natural gas price behavior has become a focal point amongst gas
users as well as investors especially in light of recent credit problems within the industry
2
(e.g. Amaranth Advisors, MotherRock, L.P.). Significant demand for derivative products
useful in the management of energy price risk as well as for pure investment purposes has
arisen as a consequence (Geman, 2005; Leppard, 2005; Eydeland and Wolyniec, 2003).
All told, understanding the nuances in the price behavior of this commodity is a crucial
factor for successfully managing the risks associated with its use either as a factor of
production or an investment. In particular, an understanding of these issues during the
current physical gas regime that has been witnessed since 2005 is an important piece of
the puzzle.
This study examines the relation between surprises in fundamental information,
specifically, changes in the amount of natural gas in storage, and changes in natural gas
futures and spot prices. We find an inverse relation exists between the change in storage
surprise (actual change minus expected change) and natural gas futures price changes on
the day of the EIA storage announcement. The price response is not differentially greater
for larger absolute storage surprises. We find no evidence that futures prices respond
differently to positive surprises as compared with negative surprises or that the market
environment, measured using the level of storage, influences the response. We also find
that storage surprises are not influenced by the dispersion of the predictions of individual
analysts. Finally, we find that the market response was larger in absolute value during
the post 2005 period, a period during which there was a significant ramp up of activity in
the natural gas market.
One ubiquitous feature of natural gas spot and futures prices that complicates risk
management is the proclivity of these prices to exhibit jumps. Figure 1 presents the time
3
NYMEX natural gas futures contract over the period August 30, 2002 through August 30,
2011. The series exhibits what appear to be jumps.1 Excess kurtosis for the daily log
price change series is roughly equal to 8.1, while excess kurtosis values for the time
series of one-week and two-week log price change series based upon the same raw data
are equal to 2.5 and 2.0 respectively.2 Das and Sundaram (1999) show that when excess
kurtosis falls as the time horizon for computing returns increases a jump process may
partially explain the price dynamics. Models of the dynamics of natural gas prices
generally have treated sharp changes in prices as a generalized jump process with a
constant jump parameter (see Clelow and Strickland, 2000; Deng, 2000; Seppi, 2002;
Eydeland and Wolyniec, 2003; Geman, 2005, for examples and the references therein).
Formal studies of the fundamental determinants of these jumps however are largely
absent from the literature. Like Linn and Zhu (2004) we focus on news about natural gas
supply and demand conditions as reflected in the change in the amount of natural gas in
storage. Linn and Zhu focus on the residual volatility in natural gas futures prices
associated with news about the change in gas in storage but do not directly investigate the
impact of storage change news on the change in the level of prices. In contrast we focus
on the relation between price level changes and the storage change surprise, but account
for heteroscedasticity. Our study provides an important compliment to the Linn and Zhu
study. In addition, unlike the studies of Linn and Zhu and Gay, Simkins and Turac
(2009), we also investigate both the relation between storage change surprises and spot
1
Natural gas prices tend to also exhibit a seasonal pattern rising during the winter months and falling during the summer months.
2
The kurtosis of the daily log price change equal to 7.7 is computed excluding the close Friday to close Monday change. If the weekend change is included the kurtosis increases to 11. Technically the term ‘return’ is not appropriate when speaking of a futures contract since there is no initial investment and so we opt for log price change.
4
natural gas price changes as well as the relation between spot price changes and futures
price changes coincident with the release of storage change information.
Understanding the influence of storage information on price changes is important
for several reasons. First, if information about changes in the amount of gas in storage is
predicted with error, then surprises will occur. Documenting whether surprises arise and
the impact they have on prices will provide insights into the distribution of potential
shocks to natural gas prices arising from the release of information about the actual
change in gas in storage. This may have important implications for modeling natural gas
price dynamics as well as for public policy regarding the timing of reports on gas in
storage. Second, information about the change in natural gas in storage is currently
released by the U.S. Energy Information Administration (EIA) at the same time each
week. If there is an association between surprises about the change in storage and price
jumps then it provides a basis for a deterministic timing component in dynamic models of
North American natural gas futures and spot prices. Finally, if market participants
condition their interpretation of storage change surprises on the size or the sign of the
storage surprise, or on the general state of the market environment, then the influence of
surprises may vary across time and market conditions. Knowledge of such conditions
could contribute to refinements of dynamic models of natural gas prices based upon
fundamentals. Our empirical analysis addresses each of these questions.
Our study also contributes to the literature on the quality and impact of analyst
forecasts of fundamental variables on security prices. Our proxy for expectations about
the change in gas in storage is a consensus forecast of analysts’ predictions developed
5
analysts’ forecasts of earnings and the impacts of those forecasts on security prices (for
instance, Kothari, 2001; Bartov, Givoly and Hayn, 2002), little formal research has been
done on forecasts of market specific fundamentals impacting commodities markets.
Finally, our results contribute to the growing literature on asymmetrical responses
of financial market prices to news, extending that investigation to the arena of a
commodity market. Several authors have explored the relation between market price
responses to news conditional on whether the news is released during ‘good’ versus ‘bad’
times. Veronesi (2001) and Conrad, Cornell and Landsman (2002) for instance, suggest
that security prices respond more to bad news in good times. There is evidence from the
foreign exchange market (Anderson, et al., 2003), the equity market (Conrad, et al., 2002)
and the T-bond futures market (Hautsch and Hess, 2002) supporting this thesis.3 We
present new evidence on the responses of futures prices for an economically important
commodity, natural gas, to both the sign and size of the storage change surprise as well as
to the market environment at the time the storage news is released.
In contrast, the spot price of natural gas reacts not on the day the EIA report is
released but on the day after. This lagged response is consistent with the institutional fact
that trading in the spot market is largely concluded prior to the time the EIA report is
released. When we control for the change in the futures price that occurs on the day of
the EIA report we find that the lagged association between the spot price change and the
storage surprise vanishes. Thus, any information revealed to the spot market appears to
3
McQueen and Vorkink (2004) develop a model in which investors become more sensitive to news following unexpected perturbations in stock prices and present evidence consistent with this their thesis. A related literature examines the influence of news on stock prices across the business cycle. McQueen and Roley (1993) examine the relation between equity prices and macroeconomic news and find evidence that stock price reactions to news is related to stages of the business cycle. Boyd, Hu and Jagannathan (2005) present evidence that the impact of news about unemployment on stock prices is conditional on whether the economy is in a contraction or an expansion phase.
6
have been completely impounded in the change in the futures price on the day on which
the EIA report is released.
Transparency is considered a valued trait in futures markets. Our study provides
important facts about the implications of the current system for reporting natural gas in
storage for natural gas price changes. The results should therefore be of interest not only
to academics who follow the energy markets and to risk managers and investors but also
to policy-makers who regulate this aspect of the information flow to natural gas market
participants. Further, our results show that storage change information is first reflected in
the futures market and then impacts the spot price. This result heightens the importance
of careful and thoughtful oversight of the futures market for natural gas.
The remainder of the paper is organized as follows. Section II provides a brief
introduction to the general behavior of natural gas futures prices and some details
regarding the physical natural gas market. Section III provides a description of the
sample data. Section IV presents results on the character and accuracy of the analyst
forecast data obtained from Bloomberg. Sections V and VI present and discusses
empirical results from our study of the relation between surprises in the change in storage
and natural gas futures price changes. Section VII presents results for spot price changes.
The final section presents our conclusions.
II. Natural Gas Price Responses to News about Changes in Natural Gas Storage
The level of natural gas in storage follows a seasonal pattern, rising during slack
demand periods, generally the second and third quarters of the year, and falling during
peak demand periods, generally the fourth and first quarters.4 Natural gas production in
4
Energy Information Administration (EIA):
25
References
Anderson, T., Bollerslev, T, Diebold, F.X., & Vega, C. ”Micro Effects of Macro Announcements: Real Time Price Discovery in Foreign Exchange.” American Economics Review, 93 (2003), 38-62.
Bartov, E., Givoly, D, & Hayn, C. “The Rewards to Meeting or Beating Earnings Expectations.” Journal of Accounting and Economics, 33 (2002), 173-204.
Black, F. “The Pricing of Commodity Contracts.” Journal of Financial Economics, 3 (1976), 167-179.
Boyd, J.H., Hu, J., & Jagannathan, R. “The Stock Market’s Reaction to Unemployment News: Why Bad News is Usually Good for Stocks.” Journal of Finance, 60 (2005), 649-672.
Clewlow, L., & Strickland, C. Energy Derivatives: Pricing and Risk Management. London, UK: Lacima Publications (2000).
Conover, W. J. Practical Nonparametric Statistics, 2nd Ed., New York: John Wiley & Sons (1980).
Conrad, J., Cornell, B., & Landsman, W.R. “When is Bad News Really Bad News?” Journal of Finance, 57 (2002), 2507-2532.
Das, S.R., & Sundaram, R.K. “Of Smiles and Smirks: A Term Structure Perspective. Journal of Financial and Quantitative Analysis, 34 (1999), 211-239.
Deaton, A., & Laroque, G. “On the Behavior of Commodity Prices.” Review of Economic Studies, 59 (1992), 1-23.
Deaton, A., & Laroque, G. “Competitive Storage and Commodity Price Dynamics.” Journal of Political Economy, 104 (1996), 826-923.
Deng, S. “Stochastic Models of Energy Commodity Prices and Their Applications: Mean-Reversion with Jumps and Spikes.” Working paper PWP-073, University of California Energy Institute, Berkeley, CA (2000).
Eydeland, A., & Wolyniec, K. Energy and Power Risk Management. Hoboken, NJ: John Wiley & Sons Publishers (2003).
Federal Energy Regulatory Commission. 2006 State of the Markets Report (2006).
26
Gay, G.D., Simkins, B.J. & Turac, M. “Analyst forecasts and price discovery in futures markets: The case of natural gas storage.” Journal of Futures Markets, 29 (2009), 451-477.
Geman, H. Commodities and Commodity Derivatives, Modeling and Pricing for Agriculturals, Metals and Energy. Hoboken, NJ: John Wiley & Sons Publishers (2005).
Greene, W.H. Econometric Analysis, 6th Ed.. Upper Saddle River, NJ: Prentice Hall Publishers (2008).
Hautsch, N., & Hess, D. “The Processing of Non-Anticipated Information in Financial Markets: Analyzing the Impact of Surprises in the Employment Report.” European Finance Review, 6 (2002), 133-161.
Jones, C.M., Lamont, O.A., & Lumsdaine, R. “Macroeconomic News and Bond Market Volatility.” Journal of Financial Economics, 47 (1998), 315-317.
Kothari. S.P. “Capital Markets Research in Accounting.” Journal of Accounting and Economics, 31 (2001), 105-231.
Leppard, S. Energy Risk Management: A Non-technical Introduction to Energy Derivatives. London, Risk Books (2005).
Linn, S.C., & Zhu, Z. ”Natural Gas Prices and the Gas Storage Report: Public News and Volatility in Energy Futures Market.” Journal of Futures Markets, 24 (2004), 282-313.
McDonald, R.L. Derivatives Markets, 2nd Ed.. Boston, MA: Addison-Wesley (2006). McQueen, G., & Roley, V.V. “Stock Prices, News and Business Conditions.” Review of
Financial Studies, 6 (1993), 683-707.
McQueen, G., & Vorkink, K. “Whence GARCH? A Preference Based Explanation for Conditional Volatility.” Review of Financial Studies, 17 (2004), 915-949.
Murry, D., & Zhu, Z. “Enron-online and Efficiency in the U.S. Natural Gas Market.” Energy Journal, 25 (2004), 57-74.
Muth, J.F. “Rational Expectations and the Theory of Price Movements.” Econometrica, 29 (1961), 299-306.
Newey, W., & West, K. "A Simple Positive Semi-Definite, Heteroskedasticity and Autocorrelation Consistent Covariance Matrix," Econometrica, 55 (1987) 703-708.
27
Platts. Methodology and Specifications Guide: North American Natural Gas. New York, NY: McGraw-Hill Publishers (2007).
Seppi, D. (2002). “Risk-Neutral Stochastic Processes for Commodity Derivative Pricing: An Introduction and Survey.” In E. Runn, ed., Real Options and Energy Management. London, UK: Risk Books.
Stanford, M., Barron, O., & Yu, Y. (2009). “Further Evidence on the Relation between Analysts’ Forecast Dispersion and Stock Returns.” Forthcoming, Contemporary Accounting Research.
Theil, H. (1966). Applied Economic Forecasting. Amsterdam, NV: North Holland.
Veronesi, P. (1999). “Stock Market Overreaction to Bad News in Good Times: A Rational Expectations Equilibrium Model.” Review of Financial Studies, 12, 975-1007.
Villar, J.A., & Joutz, F.L. (2006). « The Relationship Between Crude Oil and Natural Gas Prices.” Working paper, Energy Information Administration and George Washington University.
Williams, J.C., & Wright, B.D. (1991). Storage and Commodity Markets. Cambridge, MA: Cambridge University Press.
Working, H. (1949). “The Theory of Price of Storage.” American Economic Review, 39, 1254 -1262.
28 -.3 -.2 -.1 .0 .1 .2 .3 .4 1/1/04 2/1/06 1/1/08 1/1/10 Figure 1
Change in ln futures price for the near month NYMEX natural gas contract August 2002 - August 2011 (Source: U.S. Energy Information Administration)
29
TABLE 1
Accuracy of the Natural Gas Storage Forecast Data
The U.S. Energy Information Administration compiles data on natural gas in storage in North America as of Friday of each week and releases the information in the form of a report the following Thursday at 10:30 AM Eastern Time. Panel A: Error = (Actual Change in Gas in Storage minus Consensus Average Forecast as reported by Bloomberg). Panels B, C: St: actual change in the storage level reported on date t by the Energy Information Administration (EIA); SBt,: average of analysts’ forecasts of the change in the storage level from Bloomberg (these data are a forecast of the change in the amount of gas in storage over the week covered by the EIA report); StdDev: the cross-sectional standard deviation of analysts’ forecasts of the change in the storage level associated with the date t report; Dummy variables take the values 1 or 0 depending upon whether the report date falls within a specific calendar subperiod - Winter: November to March; Summer: June to August; Shoulder1: April to May; Shoulder2: September to October. Sample period August 30, 2002 – August 18, 2011. DW: Durbin Watson Statistic. P-values for tests are shown in parentheses. Newey-West standard errors.
Panel A Forecast versus Actual Change in Gas in Storage Descriptive Data Whole
Period Summer Winter Shoulder1 Shoulder2
Average Absolute Value Actual Storage Change (Bcf) 82.48 64.52 101.88 75.06 64.07 Average AbsoluteForecast Error (Bcf) -7.98 6.15 10.56 6.03 6.34 % Absolute Error 12.5% 1.4% 20.9% 7.0% 10.8% Error Standard Deviation (Bcf) 11.12 10.05 13.89 7.91 8.02 Average of the Standard Deviation of Analysts’ Forecasts (Bcf) 10.09 6.31 13.59 7.71 8.78 Average Number of Analysts 21.89 21.40 22.0 22.11 21.281
30
TABLE 1 – continued
Panel B Test Of Whether the Analysts’ Consensus Forecast Is An Unbiased Prediction of The Actual Change
t t, B 1 0 t S S α0 α1 DW Adj R2 F(0=0 and 1 = 1.0 ) Estimate 0.858 1.020 1.86 0.987 9.46 p-value (0.115) (<0.001) (0.0001) F(1 = 1.0 ) 12.17 (.0005
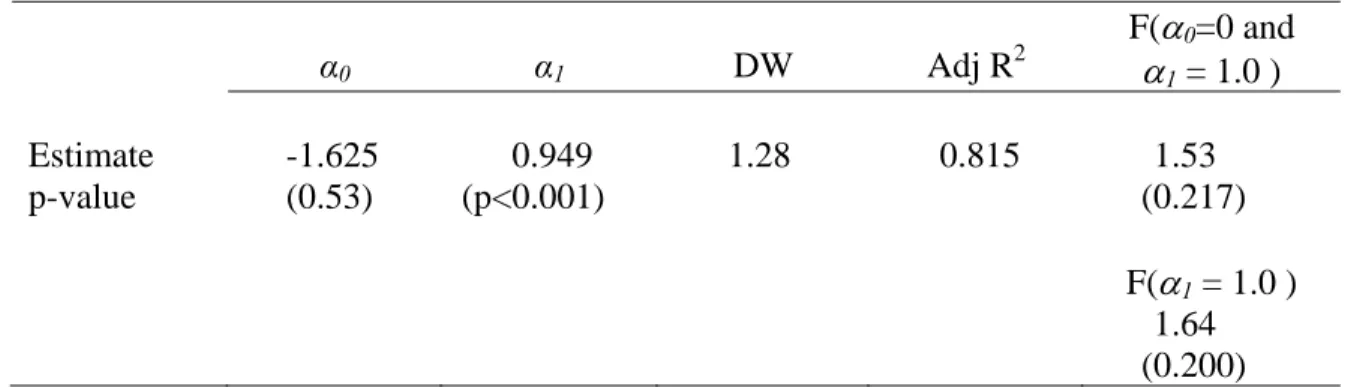
Test Of Whether the Five-Year Average Change Is An Unbiased Prediction of The Actual Change yr 5 , t yr 5 1 0 t S S α0 α1 DW Adj R2 F(0=0 and 1 = 1.0 ) Estimate -1.625 0.949 1.28 0.815 1.53 p-value (0.53) (p<0.001) (0.217) F(1 = 1.0 ) 1.64 (0.200)
31 TABLE 2
Change In The Log Price For The Front Month Natural Gas Futures Contract and the Henry Hub Natural Gas Spot Price Surrounding The EIA Natural Gas Storage Survey Release
Log price changes are calculated based on the closing settlement prices of the NYMEX front month contracts traded during the period August 30, 2002 – August 18, 2011. The U.S. Energy Information Administration compiles data on natural gas in storage in North America as of Friday of each week and releases the information in the form of a report the following Thursday at 10:30 AM Eastern Time. In those cases when a national holiday falls on Thursday the report is released on Wednesday. Day 0 represents the day of the EIA report release while Days -1 and +1 are the prior and subsequent days respectively. The spot price is the volume-weighted daily spot price for natural gas from Platts. J-B is the Jarque-Bera test statistic for a test of the null hypothesis that the sample distribution of log price changes for a given day is a drawing from a Normal Distribution. All values except J-B are in percent form.
Natural Gas Futures Prices Natural Gas Spot Prices
Mean (Median) Log Price Change Mean (Median) Absolute Log Price Change StdDev J-B (p-value) Mean (Median) Log Price
Change Mean (Median) Absolute Log Price Change StdDev J-B (p-value) Day -1 0.134 (0.139) 2.262 (1.687) 3.10 264.14 (0.000) 0.20 (0.254) 2.637 (1.801) 4.51 70143.93 (0.000) Day 0 (EIA Report Released) -0.3554 (-0.542) 3.071 (2.40) 4.19 502.95 (0.000) -0.296 (-0.237) 2.666 (1.889) 3.97 1184.06 (0.000) Day +1 0.042 (-0.197) 2.192 (1.795) 2.83 19.25 (0.000) -1.49 (-1.125) 3.34 (2.639) 4.48 427.61 (0.000)
32
TABLE 3
Natural Gas Futures Price Responses To Storage Change Surprises On And After The Release Of The EIA Report
The estimated model has the following form
R0f 0 1OilPRET0 2CddDif0 3HddDif0 4S0sur 0 where 0 indicates the day the EIA report is released, the variable R0f is the change in the log of the price for the front month natural gas NYMEX contract, OilPRET is the change in the log of the price of the front month crude oil NYMEX futures contract, CddDif is the difference between the actual Cooling Degree Day measure for the day (actual temperature minus 65 degrees if the temperature is greater than 65 degrees, 0 otherwise) and the 30-year average Cooling Degree Day measure for the day, and HddDif is the difference between the actual Heating Degree Day measure for the day (65 degrees minus the actual temperature if the actual temperature is less than 65 degrees and 0 otherwise) and the 30-year normal Heating Degree Day measure for the day. The variable S0sur represents the difference between the actual change in storage and the expected change proxied by the Bloomberg consensus forecast. P-values for tests that an estimated coefficient is equal to zero (0) are reported in parenthesis. Sample period August 30, 2002 – August 18, 2011. Estimation is by least squares, standard errors for coefficient tests are Newey-West HAC. DW is the Durbin Watson statistic for the estimated regression. Variable R0f R0f OilPRET 0.4272 0.4316 (0.000) (0.000) CddDif 0.0013 0.0011 (0.0666) (0.1155) HddDif -0.0007 -0.0006 (0.1375) (0.1556) sur i t S -0.0012 -0.0009 (0.000) (0.000) Post-2005 Dummy 0.0033 (0.3048)
Post-2005 Dummy x Stsuri -0.0006
(0.0407) 0 -0.0045 -0.0065 (0.0146) (0.0111) Adj R2 0.164 0.168 DW 2.22 2.25
33
TABLE 4
Natural Gas Spot Price Responses To Storage Change Surprises On And After The Release Of The EIA Report
The estimated model has the following form
Ris i 1OilPRETi 2CddDifi 3HddDifi 4S0sur 5R0f 0 where i=0 indicates the day the EIA report is released and i=1 indicates the following day, the variable R0s is the change in the log of the spot price for natural gas on the day of the storage change release and the subscript 1 indicates the day after, OilPRET is the change in the log of the price of the front month crude oil NYMEX futures contract, CddDif is the difference between the actual Cooling Degree Day measure for the day (actual temperature minus 65 degrees if the temperature is greater than 65 degrees, 0 otherwise) and the 30-year average Cooling Degree Day measure for the day, and HddDif is the difference between the actual Heating Degree Day measure for the day (65 degrees minus the actual temperature if the actual temperature is less than 65 degrees and 0 otherwise) and the 30-year normal Heating Degree Day measure for the day. The variable S0sur represents the difference between the actual change in storage and the expected change proxied by the Bloomberg consensus forecast. The log futures price change on the day of the storage change announcement is given by the variable R0f
P-values for tests that an estimated coefficient is equal to zero (0) are reported in parenthesis. Sample period August 30, 2002 – August 18, 2011. Estimation is by least squares, standard errors for coefficient tests are Newey-West HAC. DW is the Durbin Watson statistic for the estimated regression.
Variable R0s R1s R1s OilPRET 0.0969 0.1629 0.1522 (0.0671) (0.0891) (0.074) CddDif 0.0017 0.0018 0.0019 (0.0265) (0.0548) (0.0764) HddDif 0.0009 -0.0002 -0.0002 (0.2306) (0.6917) (0.7604) sur 0 S -0.0002 -0.0006 -0.0001 (0.2119) (0.0005) (0.7888) f 0 R 0.4667 (0.0004) 0 -0.0039 -0.0157 -0.0147 (0.0825) (0.000) (0.000) Adj R2 0.014 0.026 0.199 DW 1.97 1.86 1.57