Macrohabitat Characteristics and Distribution Hotspots of Endemic Bird
Species in Taiwan
Chia-Ying Ko(1*), Ruey-Shing Lin(2) and Pei-Fen Lee(1)
1. Institute of Ecology and Evolutionary Biology, National Taiwan University, 1, Roosevelt Rd., Sec. 4, Taipei 106, Taiwan; equal contribution.
2. Endemic Species Research Institute, 1, Ming-Shen E. Road, Jiji, Nantou 552, Taiwan.
*Corresponding author. Tel: 866-2-3366246; Fax: 886-2-23623501; Email: [email protected] (Manuscript received 24 February 2010; accepted 23 April 2010)
ABSTRACT: Understanding species distributions is essential for developing biodiversity conservation strategies. We combined two bird inventories conducted from 1993 to 2004 and identified specific features of 17 endemic bird species in Taiwan. We used eight environmental variables, including elevation, annual total precipitation, annual mean temperature, warmth index, percentage of forest cover, mean Normalized Difference Vegetation Index (NDVI), percentage of building area, and road density, to define macrohabitat characteristics of each species. All the data were in a 1 × 1 km gird system. The 17 species were classified as common (being present in more than 200 grids), uncommon (100–200 grids) or rare (less than 100 grids). The Mikado Pheasant (Syrmaticus mikado), as a rare species, had the lowest occurrence records, while the Taiwan Barbet (Megalaima nuchalis), as a common species, had the highest. Each species had a specific distribution range and habitat preference. These 17 species occupied heterogeneous elevation and climatic conditions. In general, they favored habitats with high vegetation cover, at almost full forest cover and median to high NDVI. Canonical correspondence analysis (CCA) indicated that elevation had the highest correlations with species distributions, with axis 1 accounting for 57.5% of the variation and axis 2 for 9.8%. The endemic species in Taiwan could be classified into three groups mainly separated by elevation based on the CCA. Potential biodiversity hotspots, in the elevation range of 300 and 1500 m with 45%-100% forest cover, included 33.2% areas of Taiwan. Only 35% of actual hotspots (grid with the number of endemic species ≧7) were located in the potential hotspots. Most of the actual hotspots (65%) occur at higher elevation than the potential hotspots. These data demonstrated the distribution patterns of the endemic bird species in Taiwan, and topography and vegetation are the most important macrohabitat factors associated with these species.
KEY WORDS: biodiversity inventory, macrohabitat, canonical correspondence analysis, endemic bird species, biodiversity hotspot.
INTRODUCTION
Understanding the relationship between a species and its environment provides the foundations for biodiversity conservation. This information provides the basis for early stage conservation programs and can help in the development of possible solutions to specific conservation issues (Goldsmith, 1991; Thomas, 1996; Watson, 2005). Many studies have indicated that qualities of habitats are critical factors affecting the abundance and distribution of species (Harrison and Quinn, 1989; Kindvall, 1996; Franken and Hik, 2004; Armstrong, 2005; Schooley and Branch, 2007). High-quality habitats can not only provide a species with a stable living space in which to maintain its population, but also enable a declining species to recover. In contrast, an unsuitable habitat compromises the survival of a species. By understanding environmental features affecting species distribution, we can determine the preference of a species for a particular habitat, and how it uses that habitat. We could then apply this knowledge to design adequate conservation strategies.
Endemic species are often found in isolated geographical units, such as islands or isolated eco-regions (Gaston, 1994). Because of their limited geographic ranges, endemic species often require specific environments for maintaining healthy populations (Lamoreux et al., 2006; Malcolm et al., 2006). Thus, the identification and conservation of specific habitats are critical issues for conserving endemic species.
Taiwan is located at the junction of the tropical and sub-tropical zones, and thus has diverse ecological environments. Among 560 bird species recorded in Taiwan, 15 are endemic, according to the 6th edition of Clements Checklist of the Birds of the World (Clements et al., 2007). Recent studies by Li et al., (2006) and Feinstein et al. (2008) indicated that two additional species, the Taiwan Barbet (Megalaima nuchalis) and Taiwan Hwamei (Harrulax taewanus), should be included as endemic. Overall, the number of endemic bird species in Taiwan is one of the highest (i.e. a hotspot) in the greater China region (Lei et al., 2003). This study analyzed distribution patterns of the 17 Taiwanese endemic bird species using data from bird
217 surveys in the recent two decades. We investigated
macrohabitat characteristics and evaluated relationship between species distributions and environmental variables by canonical correspondence analysis (CCA). We then mapped the potential biodiversity hotspots of these Taiwanese endemic bird species based on the results of the CCA and compared the map of species’ actual occurrence areas. The aims of the study were (1) to point out specific and numeric ranges of the distributions of the endemic bird species, and (2) to range potential biodiversity hotspots of the endemic bird species by macrohabitat factors.
MATERIALS AND METHODS
Species dataWe compiled bird distribution data from two bird inventory projects conducted from 1993 to 2004 (Hsu et al., 2004; Koh et al., 2006). The data in Koh et al. (2006) were based on transect sampling, while that of Hsu et al. (2004) used road sampling. The transect sampling technique involved a 1500-m-long transect of avian fauna survey with 10 sampling sites 150 m apart. Each sampling site was observed for a 6-minute period. The road sampling technique was to select a fixed route of investigation covering a distance of 3 km at a walking speed of 1.5 km/hour, without stopping at any specific sites. The sampling sites of the transect sampling technique were selected to best represent habitat characteristics of a particular elevation, forest type and eco-region. Since many breeding birds in Taiwan dwell in forests, whenever possible, the forested areas were chosen to obtain potential occurrence records of all species. Each site was sampled, with sufficient duration (Shiu and Lee, 2003), once a year during the breeding season or seasonally during the survey period. Whether the transect or the road sampling technique, both species sighting and hearing records were taken and geographic coordinates of individual record/sampling site were simultaneously recorded. Each record was regarded as a point of a given species. All points/sampled sites were transformed to a 1 × 1 km grid system (Table 1). We ignored the number of points of a species in a grid and defined a grid with at least one point of a given species as a species-present grid for that species. A grid being sampled and having no points of a given species was regarded as a species-absent grid for that species. All sampled sites and fixed routes with surveys more than twice were included to ensure that absence data of species were credible. In total, 4,082 grids had been sampled and had either the complete presence or absence of bird data (Fig. 1).
Statistical analysis
To identify macrohabitat factors associated with species distributions, we focused on eight environmental macro-variables that were also in 1 × 1 km grid system. These variables were separated into four categories: topography, climate, vegetation, and human disturbance. Elevation is the only topographical variable and was derived from digital elevation model with a 40-m resolution. Annual total precipitation, annual mean temperature and warmth index are the climatic variables. The former two were calculated from meteorological monitoring records taken from 1959 to 1985 by the Central Weather Bureau of Taiwan. The warmth index was calculated from the accumulated mean monthly temperature above 5°C in response to plant growth conditions (Liu and Su, 1992). Vegetation variables, including percentage of forest cover and mean Normalized Difference Vegetation Index (NDVI), were generated from a SPOT mosaic image taken in 2002. NDVI, which has been used as a vegetation index for primary productivity and biomass in terrestrial ecosystems, and is highly correlated with green-leaf area and absorbed photosynthetically active radiation (PAR; Tucker, 1979; Box et al., 1989). The percentage of building area and road density were used to represent the level of human disturbance that were published by the Ministry of the Interior, Taipei, Taiwan, in 2000. We used the CCA to evaluate the relationship between distribution of a species, i.e. presence and absence information, and the eight environmental variables we derived. The CCA is a multivariate method that has been used for comparing the relationships between bird species and their environments (ter Braak and Verdonschot, 1995). The CCA diagram optimally displays how bird assemblage varies with environmental conditions by simultaneously combining species and environmental variables into a two-dimensional illustration. In this study, we used information from the 4,082 grids with species presence and absence data in the CCA analysis. Furthermore, we mapped potential biodiversity hotspots of the endemic bird species in the whole Taiwan using important macrohabitat factors chosen by the CCA. All statistical analyses were conducted using SYSTAT 12, except for the CCA, for which the PC-ORD 5.0 software package was used.
RESULTS
A total of 21,264 points were collected for the 17 endemic bird species in Taiwan (Table 1). The number of the points of individual species ranged from 75 to 5,717. After transferring the points into the 1 × 1 km grid system, the number of species-present grids for a
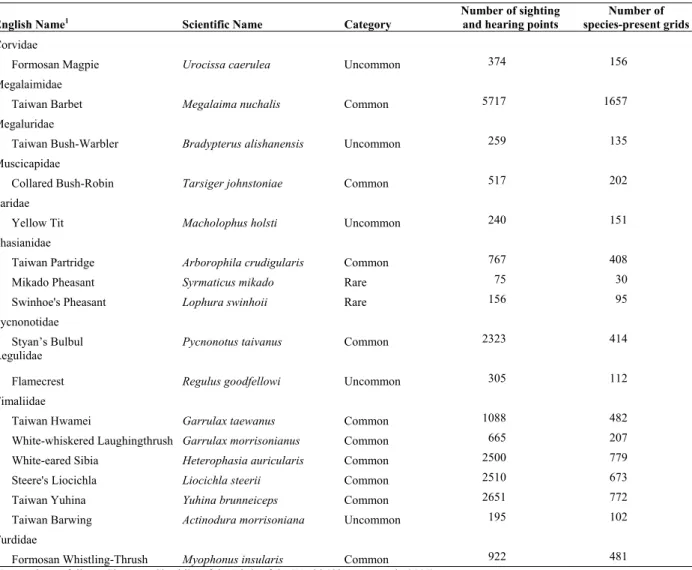
Table 1. List of 17 endemic bird species in Taiwan. These species are categorized as common (being present in more than 200 grids), uncommon (100–200 grids) or rare (less than 100 grids), based on their sighting and hearing records. Each sighting/hearing record of a species is regarded as a point of which geographic coordinates are taken and transferred to a 1×1 km grid system. A grid with at least one point of a given species is defined as a species-present grid for that species.
English Name1 Scientific Name Category Number of sighting and hearing points species-present gridsNumber of
Corvidae
Formosan Magpie Urocissa caerulea Uncommon 374 156
Megalaimidae
Taiwan Barbet Megalaima nuchalis Common 5717 1657 Megaluridae
Taiwan Bush-Warbler Bradypterus alishanensis Uncommon 259 135 Muscicapidae
Collared Bush-Robin Tarsiger johnstoniae Common 517 202 Paridae
Yellow Tit Macholophus holsti Uncommon 240 151 Phasianidae
Taiwan Partridge Arborophila crudigularis Common 767 408 Mikado Pheasant Syrmaticus mikado Rare 75 30 Swinhoe's Pheasant Lophura swinhoii Rare 156 95
Pycnonotidae
Styan’s Bulbul Pycnonotus taivanus Common 2323 414 Regulidae
Flamecrest Regulus goodfellowi Uncommon 305 112 Timaliidae
Taiwan Hwamei Garrulax taewanus Common 1088 482 White-whiskered Laughingthrush Garrulax morrisonianus Common 665 207 White-eared Sibia Heterophasia auricularis Common 2500 779 Steere's Liocichla Liocichla steerii Common 2510 673 Taiwan Yuhina Yuhina brunneiceps Common 2651 772 Taiwan Barwing Actinodura morrisoniana Uncommon 195 102 Turdidae
Formosan Whistling-Thrush Myophonus insularis Common 922 481
1Nomenclature follows Clements Checklist of the Birds of the World (Clements et al., 2007).
given species ranged from 30 to 1,657. The 17 species were classified as common, uncommon or rare, based on their sighting and hearing records. Ten species were classified as common with present records of >200 grids. Five species were uncommon with sighting records of 100–200 grids, and two were rare with <100 grids (Table 1). The Mikado Pheasant had the lowest occurrence, consistent with its current conservation status being categorized as rare and endangered in Taiwan, and was listed in IUCN Red List Category in 2009 as a near-threatened species. The Taiwan Barbet had the highest occurrence.
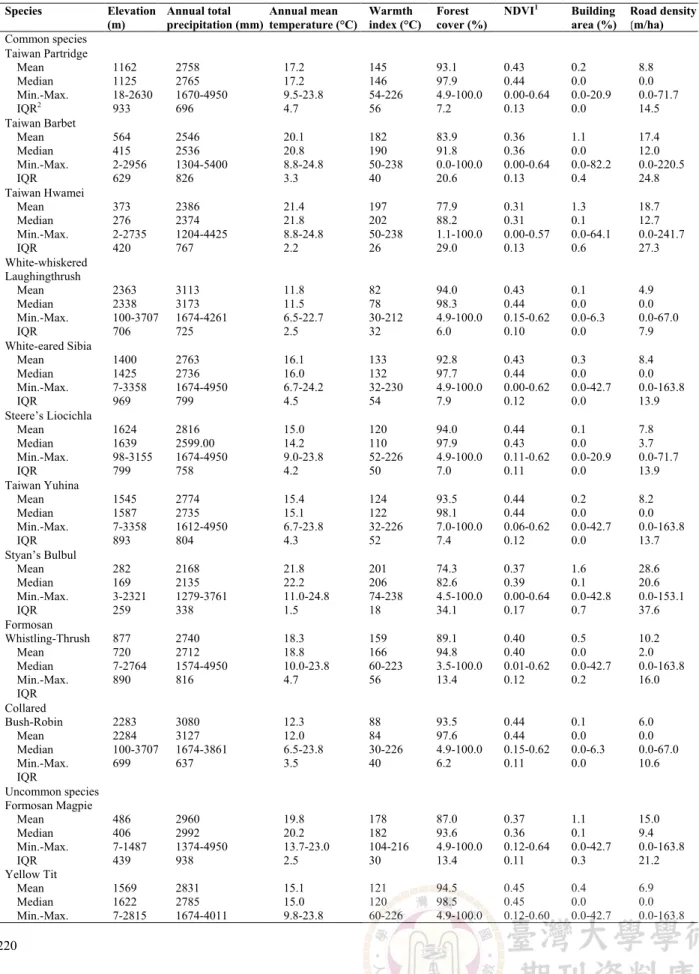
Each endemic species generally exhibited a specific distribution pattern, especially in terms of topographical and climatic variables (Table 2). In comparison of mean values of each species and the whole Taiwan, all
species favored habitats with high coverage of vegetation (i.e. higher mean values of percentage of forest cover and NDVI than those of the whole Taiwan) and low human disturbance, except for the Styan’s Bulbul, who distributed in areas with high road density. The details of distributions for each species were as follows.
Common species
The Taiwan Partridge (Arborophila crudigularis) was found in broad-leaved forests of mountains in central Taiwan. These areas were in temperate temperature with moderate annual precipitation (Table 2). Most records were found in areas with high percentage of forest cover and NDVI values as well as with almost no buildings and low road density.
219
Fig. 1. Location of Taiwan and species occurrence records by grid representation. There are totally 4,082 grids being used in this study.
Table 2. Macrohabitat characteristics of 17 Taiwanese endemic bird species and general habitat characteristics of the whole Taiwan. The warmth index is calculated from the accumulated mean monthly temperature above 5°C.
Species Elevation (m) Annual total precipitation (mm) Annual mean temperature (°C) Warmth index (°C) Forest cover (%) NDVI1 Building area (%) Road density (m/ha) Common species Taiwan Partridge Mean Median Min.-Max. IQR2 1162 1125 18-2630 933 2758 2765 1670-4950 696 17.2 17.2 9.5-23.8 4.7 145 146 54-226 56 93.1 97.9 4.9-100.0 7.2 0.43 0.44 0.00-0.64 0.13 0.2 0.0 0.0-20.9 0.0 8.8 0.0 0.0-71.7 14.5 Taiwan Barbet Mean Median Min.-Max. IQR 564 415 2-2956 629 2546 2536 1304-5400 826 20.1 20.8 8.8-24.8 3.3 182 190 50-238 40 83.9 91.8 0.0-100.0 20.6 0.36 0.36 0.00-0.64 0.13 1.1 0.0 0.0-82.2 0.4 17.4 12.0 0.0-220.5 24.8 Taiwan Hwamei Mean Median Min.-Max. IQR 373 276 2-2735 420 2386 2374 1204-4425 767 21.4 21.8 8.8-24.8 2.2 197 202 50-238 26 77.9 88.2 1.1-100.0 29.0 0.31 0.31 0.00-0.57 0.13 1.3 0.1 0.0-64.1 0.6 18.7 12.7 0.0-241.7 27.3 White-whiskered Laughingthrush Mean Median Min.-Max. IQR 2363 2338 100-3707 706 3113 3173 1674-4261 725 11.8 11.5 6.5-22.7 2.5 82 78 30-212 32 94.0 98.3 4.9-100.0 6.0 0.43 0.44 0.15-0.62 0.10 0.1 0.0 0.0-6.3 0.0 4.9 0.0 0.0-67.0 7.9 White-eared Sibia Mean Median Min.-Max. IQR 1400 1425 7-3358 969 2763 2736 1674-4950 799 16.1 16.0 6.7-24.2 4.5 133 132 32-230 54 92.8 97.7 4.9-100.0 7.9 0.43 0.44 0.00-0.62 0.12 0.3 0.0 0.0-42.7 0.0 8.4 0.0 0.0-163.8 13.9 Steere’s Liocichla Mean Median Min.-Max. IQR 1624 1639 98-3155 799 2816 2599.00 1674-4950 758 15.0 14.2 9.0-23.8 4.2 120 110 52-226 50 94.0 97.9 4.9-100.0 7.0 0.44 0.43 0.11-0.62 0.11 0.1 0.0 0.0-20.9 0.0 7.8 3.7 0.0-71.7 13.9 Taiwan Yuhina Mean Median Min.-Max. IQR 1545 1587 7-3358 893 2774 2735 1612-4950 804 15.4 15.1 6.7-23.8 4.3 124 122 32-226 52 93.5 98.1 7.0-100.0 7.4 0.44 0.44 0.06-0.62 0.12 0.2 0.0 0.0-42.7 0.0 8.2 0.0 0.0-163.8 13.7 Styan’s Bulbul Mean Median Min.-Max. IQR 282 169 3-2321 259 2168 2135 1279-3761 338 21.8 22.2 11.0-24.8 1.5 201 206 74-238 18 74.3 82.6 4.5-100.0 34.1 0.37 0.39 0.00-0.64 0.17 1.6 0.1 0.0-42.8 0.7 28.6 20.6 0.0-153.1 37.6 Formosan Whistling-Thrush Mean Median Min.-Max. IQR 877 720 7-2764 890 2740 2712 1574-4950 816 18.3 18.8 10.0-23.8 4.7 159 166 60-223 56 89.1 94.8 3.5-100.0 13.4 0.40 0.40 0.01-0.62 0.12 0.5 0.0 0.0-42.7 0.2 10.2 2.0 0.0-163.8 16.0 Collared Bush-Robin Mean Median Min.-Max. IQR 2283 2284 100-3707 699 3080 3127 1674-3861 637 12.3 12.0 6.5-23.8 3.5 88 84 30-226 40 93.5 97.6 4.9-100.0 6.2 0.44 0.44 0.15-0.62 0.11 0.1 0.0 0.0-6.3 0.0 6.0 0.0 0.0-67.0 10.6 Uncommon species Formosan Magpie Mean Median Min.-Max. IQR Yellow Tit Mean Median Min.-Max. 486 406 7-1487 439 1569 1622 7-2815 2960 2992 1374-4950 938 2831 2785 1674-4011 19.8 20.2 13.7-23.0 2.5 15.1 15.0 9.8-23.8 178 182 104-216 30 121 120 60-226 87.0 93.6 4.9-100.0 13.4 94.5 98.5 4.9-100.0 0.37 0.36 0.12-0.64 0.11 0.45 0.45 0.12-0.60 1.1 0.1 0.0-42.7 0.3 0.4 0.0 0.0-42.7 15.0 9.4 0.0-163.8 21.2 6.9 0.0 0.0-163.8
221 Table 2. Continued. Species Elevation (m) Annual total precipitation (mm) Annual mean temperature (°C) Warmth index (°C) Forest cover (%) NDVI1 Building area (%) Road density (m/ha) IQR 615 787 2.8 34 6.0 0.12 0.0 8.6 Taiwan Barwing Mean Median Min.-Max. IQR 2043 2102 7-3015 597 3067 3107 1674-4261 800 13.6 13.4 9.0-22.7 3.0 104 101 52-212 36 92.6 98.6 4.9-100.0 6.1 0.45 0.46 0.11-0.62 0.12 0.1 0.0 0.0-6.3 0.0 5.3 0.0 0.0-74.0 6.9 Taiwan Bush-Warbler Mean Median Min.-Max. IQR 2200 2179 147-3422 969 2939 2810 2027-4374 848 12.5 12.2 6.7-23.8 2.7 90 86 32-226 32 95.3 98.9 43.8-100.0 5.8 0.45 0.45 0.22-0.59 0.10 0.1 0.0 0.0-2.5 0.0 5.4 0.0 0.0-36.0 8.1 Flamecrest Mean Median Min.-Max. IQR 2551 2573 378-3707 654 3079 3107 1990-3861 725 11.2 11.0 6.5-21.3 2.3 76 72 30-196 38 91.3 96.7 14.9-100.0 10.6 0.43 0.43 0.21-0.56 0.08 0.1 0.0 0.0-2.5 0.0 4.2 0.0 0.0-36.0 3.1 Rare species Swinhoe's Pheasant Mean Median Min.-Max. IQR 1343 1389 100-2457 760 2868 2898 1674-5124 697 16.8 16.5 10.5-23.8 3.7 142 138 68-226 44 94.7 99.3 4.9-100.0 4.4 0.46 0.46 0.15-0.62 0.12 0.1 0.0 0.0-6.3 0.0 5.8 0.0 0.0-67.0 8.2 Mikado Pheasant Mean Median Min.-Max. IQR 1918 2121 100-2979 623 2825 2961 1674-3537 688 13.7 12.8 9.5-22.7 3.5 105 93 56-212 42 94.0 99.8 4.9-100.0 4.4 0.42 0.44 0.15-0.59 0.13 0.3 0.0 0.0-6.3 0.0 9.5 4.6 0.0-67.0 16.9 Taiwan Mean Median Min.-Max. IQR 742 381 0-3707 1194 2385 2323 1004-5700 1057 19.6 21.2 6.5-25.2 6.0 175 194 30-242 72 70.2 90.4 0.0-100.0 58.0 0.32 0.34 0.00-0.65 0.24 2.4 0.0 0.0-83.6 1.2 22.8 9.3 0.0-288.8 35.6
1NDVI = normalized difference vegetation index. 2IQR = Interquartile range
The Taiwan Barbet distributed with a wide elevation range (Table 2) and most of the observations were in low-elevation areas. Their preferred habitats were moist and hot. Requirements of vegetation were not as specific as for other species, and they were recorded at all levels of percentage of forest cover and at a wide range of NDVI values. They also could tolerate relatively high human disturbance.
Most records of the Taiwan Hwamei were at low elevations, with moderate climatic situation (Table 2). Like the Taiwan Barbet, they distributed at all levels of percentage of forest cover and had a wide range of NDVI values. Meanwhile, they lived in areas of higher human disturbance.
The White-whiskered Laughingthrush (Garrulax morrisonianus) had the highest-elevation distribution of the endemic species in the Timaliidae family (Table 2). They occupied areas with very high variations in annual precipitation, and low mean temperature and warmth index. They favored habitats covered with more forests and had high NDVI values. Additionally, the areas that White-whiskered Laughingthrush inhabited had the lowest percentage of building area and road density among the ten common species.
The White-eared Sibia (Heterophasia auricularis) was a fairly common species in Taiwan. They usually inhabited broad-leaved forests or broad-leaved forests mixed with grass and shrubs. Most of their occurrences were recorded in a temperate climatic state (Table 2). They were more common in areas of high percentage of forest cover and NDVI values where the impact of human disturbance was low.
The Steere’s Liocichla (Liocichla steerii) had a wider distribution range and frequently in broad-leaved forest bottom or thick bushes. They also inhabited various climatic areas (Table 2). They were active in areas with high vegetation cover and low human disturbance.
The Taiwan Yuhina (Yuhina brunneiceps) was found in temperate forest, mostly at middle elevations. They were closely related to the White-eared Sibia and both occupied similar habitats (Table 2). The climatic state was moderate when compared to that of the whole Taiwan. They could be easily found in dense forests and high NDVI areas. Most of their distributions were with almost no buildings and low road density resembled those on the Taiwan Partridge.
The Styan’s Bulbul (Pycnonotus taivanus) was mainly found in eastern Taiwan on the coastal plains. They occurred in low-elevation forests and in a wide variety of habitats including secondary forests, scrubs, agricultural areas, and gardens. The distributions of the Styan’s Bulbul peaked in areas of 2000–2400 mm annual precipitation. Among all endemic bird species, they lived in the hottest areas with the highest mean temperature and warmth index (Table 2). The Styan’s Bulbul differed from other species in occupying all percentages of forest cover, where the NDVI range was huge as well. Human disturbance they could tolerate was relatively high and the average road density of distributions of the Styan’s Bulbul was higher than that of the whole Taiwan.
The Formosan Whistling-Thrush (Myiophonus insularis) was distributed in the mid- and low-elevation mountains, often alone beside streams, near rocks, or in wet woodlands. Their occurrences decreased with increases of elevation from 100 to 2764 m. Their climatic preferences were in line with the overall environment in Taiwan, although they were more numerous in areas with more annual precipitation and higher temperature and warmth index (Table 2). Vegetation cover and human disturbance showed few effects on the distribution of the species.
The Collared Bush-Robin (Tarsiger johnstoniae) lived at an average elevation of 2283 m, in the mid- and high-mountains (Table 2). Its habitats were often characterized by high annual precipitation, cold temperature, and low warmth index. They favored areas with high percentage of forest cover and NDVI values. Their distributions were limited by human disturbance and they were found in areas with few buildings and low road density.
Uncommon species
The Formosan Magpie (Urocissa caerulea) had a restricted range, below 1500 m in elevation, where was the lowest distribution among the five uncommon species (Table 2). They lived in stable and warm climatic conditions. Although they favored areas of high percentage of forest cover, the NDVI values were relatively low. In addition, they could tolerate higher human disturbance than other uncommon species. The Yellow Tit (Macholophus holsti) occurred in primary broad-leaved forests and occasionally in secondary growth at low- and mid-elevation forests. Its habitats were usually marked by moderate annual precipitation, low temperature, and low warmth index (Table 2). They preferred areas with high percentage of forest cover and NDVI values. The two indices of human disturbance were low.
The Taiwan Barwing (Actinodura morrisoniana) was found in areas of high elevation. Its habitats had relatively low mean temperature and warmth index, however, with high annual total precipitation (Table 2). Most records were from areas of high percentage of forest cover and moderate NDVI values. This species endured the least human disturbance of all 17 species, occurring only in areas with <6.3% building areas and an average 5.3 m/ha road density.
The Taiwan Bush-Warbler (Bradypterus alishanensis) occurred more widely than the other uncommon species (Table 2). They appeared in vicinity of bamboo grasslands or dense bushes within low- and mid-elevation areas. These areas were in temperate temperature with moderate annual precipitation. They occurred mostly in areas of 80%–100% forest cover and 0.4–0.5 NDVI values. They had a relatively low tolerance of human disturbance, choosing areas with almost no buildings and low road density.
The Flamecrest (Regulus goodfellowi) was found in mid- and high-elevation coniferous forests and in broad-leaved mixed forests at high elevations, mainly at 2000–3600 m. Its average elevation (2551 m) was the highest of all endemic bird species (Table 2). Its habitats had the coldest mean temperature and lowest warmth index among all 17 species as well as the highest annual total precipitation for the five uncommon species. However, its distributions with regard to vegetation and human disturbance were similar to those of other species.
Rare species
The Swinhoe's Pheasant (Lophura swinhoii) was recorded at mid-elevations in dense primitive forests. They appeared in areas with a temperate climatic state (Table 2). They were mostly found in areas of high percentage of forest cover and NDVI values, principally at 80%–100% forest cover and 0.4–0.5 NDVI values. More records were obtained in less-disturbed areas with almost no buildings and low road density.
The Mikado Pheasant was confined to mountains of central Taiwan, especially at 1800–2500 m elevation in virgin, broad-leaved mixed forests or coniferous forests. Most records were in areas with mean annual precipitation of 2825 mm, temperature of 13.7 °C, and warmth index of 105 °C (Table 2). Suitable habitats for the Mikado Pheasant were in areas with high percentage of forest cover and NDVI values, and low human disturbance.
Distribution patterns
The CCA diagram showed that elevation had the highest correlations with species distributions, with the most contribution at axis 1 as percentage of forest cover
223
Fig. 2. Canonical correspondence analysis (CCA) of 17 endemic bird species in Taiwan by eight macro-environmental variables. These 17 species are classified into three groups based on the CCA.
at axis 2 (Fig. 2). The axis 1 accounted for 57.5% of the distributions, and the axis 2 for 9.8%. The first axis corresponded to a well-marked and monotonic gradient from low-elevation species (e.g. the Styan’s Bulbul, the Taiwan Hwamei, and the Taiwan Barbet) to high-elevation species (e.g. the Collared Bush-Robin, the Taiwan Barwing, the Taiwan Bush-Warbler, and the Flamecrest). The second axis showed an arch effect, indicating a characteristic of a strong environmental gradient on the first axis. The six species scattered in the lower right corner (the Mikado Pheasant, the Taiwan Barwing, the Taiwan Bush-Warbler, the Collared Bush-Robin, the White-whiskered Laughingthrush and the Flamecrest) were those affected mostly by elevation. The four species, scattered on the left side (the Styan’s Bulbul, the Taiwan Hwamei, the Taiwan Barbet and the Formosan Magpie) were those affected negatively by elevation. Overall, these results indicated a strong gradient of topographical and vegetation influences.
The endemic species in Taiwan could be classified into three groups based on the CCA diagram (Fig. 2). The first group included the Formosan Magpie, the Taiwan Barbet, the Taiwan Hwamei and the Styan’s Bulbul, and mostly distributed in areas of low elevation.
The second group was the mid-elevation species including the Taiwan Partridge, the White-eared Sibia, the Steere’s Liocichla, the Taiwan Yuhina, the Whistling-Thrush, the Yellow Tit, and the Swinhoe’s Pheasant. Finally, the species in the third group were typically distributed above 2000 m in elevation and included the White-whiskered Laughthrush, the Collared Bush-Robin, the Taiwan Barwing, the Taiwan Bush-Warbler, the Flamecrest, and the Mikado Pheasant.
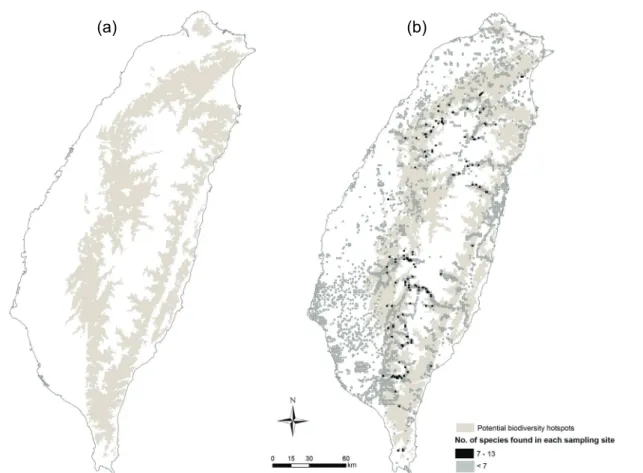
Potential biodiversity hotspots of all 17 species were defined using the environmental characteristics of each species identified by the CCA (Table 2). The results indicated that the potential biodiversity hotspots distributed at elevation of 300-1500 m with 45%-100% forest cover (Fig. 3). In these areas, about 33.2% areas of Taiwan, we expected to see as many as 17 species occurred simultaneously. However, within these areas, most of the grids only had less than seven species. As figure 3 shown, not all the potential hotspots included actual biodiversity hotspots (grid with the number of endemic species ≧7). Only 35% of the actual hotspots were located in the potential hotspots. Most of the actual hotspots (65%) occurred at higher elevation than where the potential hotspots were.
Fig. 3. Potential and actual biodiversity hotspots of 17 endemic bird species in Taiwan. (a) The potential biodiversity hotspots (light gray areas) are ranged by elevation and percentage of forest cover which have the highest correlations with species distributions in the canonical correspondence analysis (CCA). (b) Sampled grids are added on areas of the whole Taiwan. The actual biodiversity hotspots (black grids) are defined as more than seven species occurrence records in each grid while dark gray grids have less than seven species occurrence records.
DISCUSSION
The understanding of species distributions based on their actual occurrences and general macrohabitat factors is fundamental to species conservation. Mapping the potential biodiversity hotspots, through those data, is especially valuable for knowing differences between ideal and actual occurrence conditions for the focal species. In the study, we analyzed the presence or absence of the Taiwanese endemic bird species and the macrohabitat factors associated with their unique distributions. Topographical and vegetation factors separated the 17 endemic bird species into the three groups. However, our results showed that discrepancy existed between locations of the potential and actual biodiversity hotspots.
Most of the actual biodiversity hotspots located at higher elevation than the predicted potential hotspots (Fig. 3). In Taiwan, forested areas within low-elevation (<1000 m) were mostly converted to urban and agricultural usages, while in mid-elevation (1000–2200 m), many broad-leafed forest areas were cut and
replanted with conifers such as Cryptomeria japonica. Human activities and disturbances have been important factors that affect species’ distributions (Lee et al., 2004). Most of the species’ distributions showed interrupted patterns due to these influences. The fact that only 35% of the actual biodiversity hotspots were within the potential hotspots, less than 1% occurred at low elevation, and most were found at high elevation (Fig. 3) also suggested high human influences. Meanwhile, among all macrohabitat characteristics of the 17 species, values of human disturbance (i.e. percentage of building area and road density) were always low in predicting species occurrences. Using a modeling approach that combined species distributions and current environmental variables, Ko et al., (2009) also found that the hotspots were located at high elevation. Their results showed that the hotspots for the endemic bird species had peaks at around 1844–2308 m in elevation, and had moderate mean temperature (11–14°C), high mean NDVI (0.4–0.6), little human disturbance, and high forest cover.
225 The spatial distributions of the species also affected
the observed hotspot discrepancy. Despite the fact that most of the species distributed along an elevation gradient and showed some preferences for particular ranges, some bird species had spatially restricted distributions. For example, the Styan’s Bulbul distributed only in eastern areas of Taiwan according to the data in this study. Even in some introduced areas in the eastern Taiwan, the Light-vented Bulbul (P. sinensis), being a strong competitor with the Styan’s Bulbul, could exert some limitations on the distributions of the Styan’s Bulbul. As the other example, the Formosan Whistling-Thrush could only be found in the river regions that also showed some limitations in their representative ranges.
The environmental variables, i.e. topography, climate, vegetation, and human disturbance, used to define species’ general distribution patterns in this study were based on suggestions addressed by Chapin et al. (2002). Obviously, species distributions and habitat characteristics have strong relationships. Choosing appropriate and specific environmental indicators to describe species distribution patterns is of fundamental and critical importance. Chapin et al. (2002) suggested using five independent control factors, including climate, parent material, topography, potential biota, and time, to set the bounds for the characteristics of an ecosystem. We believed that these eight environmental variables being used in this study can structure a broad framework for species distributions and represent terrestrial ecosystems in Taiwan.
Although vegetation types are often mentioned in macrohabitat use by bird species, we used percentage of forest cover and NDVI in this study. There was, unfortunately, no complete vegetation type database, nor definite vegetation types available in Taiwan, especially in a grid system. We, therefore, used percentage of forest cover and NDVI as two general vegetation factors to represent the macrohabitat use of the 17 endemic species across the whole Taiwan. In the results, in order to describe the macrohibitat use of a given species as exhaustive as possible, several vegetation types were described according to observations from field work.
Identifying macrohabitat use leads to the establishment of criteria for assessing the suitability of the landscape for a species and to the development of conservative procedures at a large scale. With deforestation, fragmentation, habitat loss, and accelerating climate change, natural systems have faced increasingly anthropogenic-induced impacts in recent decades (Walther et al., 2002; Hampe and Petit, 2003; Parmesan and Yohe, 2003), which have called for more discussions of effective and feasible conservation
strategies. Protecting endemism is especially an important part of conservation and management to maintain global biodiversity and regional biological specificity. Protection statuses of the 17 Taiwanese endemic bird species, unfortunately, are not clear. Human activities pose an additional threat to distributions and populations for these endemic species in Taiwan, for example, by accelerating the hybridization between the Styan’s Bulbul and the Light-vented Bulbul (Lei et al., 2007). The hybridization between the Taiwan Hwamei and the exotic Chinese Hwamei (G. canorus), and the Formosan Magpie and the exotic Red-billed Blue Magpie (U. erythrorhyncha) are serious problems. Most of the ‘exotic’ birds were originated by the human activities and have created some problems for conservation. So far as we know, for the conservation of the Styan’s Bulbul, Kenting National Park has started to conduct ecological studies on these two species (i.e. the Styan’s Bulbul and the Light-vented Bulbul) and proposed to setup some protected areas for the Styan’s Bulbul (Severinghaus, 2005, 2006). For the preservation of the Formosan Magpie in Central Taiwan, the introduced exotic Red-billed Blue Magpie had been eradicated successfully (Yao et al., 2007). However, there has no actions been taken yet to control the feral Chinese Hwamei. The current dataset can be used as a baseline data to compare their dispersal abilities and further conservation strategies can be proposed.
Moreover, monitoring long-term population changes are integral parts of effective conservation- oriented research and management, and are critical to the debate on the current statuses of bird species. Ways to enhance the value of bird surveys have aroused discussions in many groups (Sauer et al., 2005; Francis et al., 2005). Although no consensus has yet been reached, most researchers believe that the analysis of bird survey data should provide a vitally important tool for monitoring bird populations. Three possible sources of bias, including roadside effects, observer effects, and analytical methods, have been proposed and should not be ignored (Sauer et al., 2005; Francis et al., 2005). For effective conservation, we suggest continuous monitoring of our sampling sites. We also recommend that the bird survey protocols used in this study can be improved by (1) increasing survey coverage areas, (2) setting additional goals, and (3) estimating effects of distance from roadsides on detection rates. Measures should be implemented to reduce the biases and eventually enhance the usefulness of the survey data.
In conclusion, species inventory across its distribution ranges remains an important task for assessing ecological statuses, identifying conservation
priorities, and placing regional population changes into context. Endemic species have unique values and are representative indicators of a geographical region, and thus the statuses of these species should be further monitored to ensure their survival.
ACKNOWLEDGEMENTS
We thank Fu-Hsiung Hsu, Jean Doble and two anonymous reviews for discussions and/or comments on earlier drafts of the manuscript. The preparation of this manuscript was supported by National Science Council, Taiwan. The datasets collected and used in this paper were supported by the Council of Agriculture.
LITERATURE CITED
Armstrong, D. P. 2005. Integrating the metapopulation and habitat paradigms for understanding broad-scale declines of species. Conser. Biol. 19: 1402-1410.
Box, E. O., B. N. Holben and V. Kalb. 1989. Accuracy of the AVHRR vegetation index as a predictor of biomass, primary productivity and net CO2 flux. Vegetatio 80: 71-89.
Chapin, F. S., P. A. Matson and H. A. Mooney. 2002. Principles of terrestrial ecosystem ecology. Springer-Verlag, New York, USA. 472pp.
Clements, J. F., J. Diamond, A. White and J. W. Fitzpatrick. 2007. The Clements Checklist of Birds of the World. Cornell University Press, Ithaca, USA.
Feinstein, J., X. Yang and S.-H. Li. 2008. Molecular systematics and historical biogeography of the Black-browed Barbet species complex (Megalaima oorti). Ibis 150: 40-49.
Francis, C. M., J. Bart, E. H. Dunn, K. P. Burnham and C. J. Ralph. 2005. Enhancing the value of the breeding bird survey: reply to Sauer et al. (2005). J. Wildl. Manage. 69: 1327-1332.
Franken, R. J. and D. S. Hik. 2004. Influence of habitat quality, patch size and connectivity on colonization and extinction dynamics of collared pikas Ochotona collaris. J. Anim. Ecol. 73: 889-96.
Gaston, K. J. 1994. Rarity. Chapman and Hall, London, UK. 205pp.
Goldsmith, F. B. 1991. Monitoring for conservation and ecology. Chapman and Hall, London, UK. 275pp. Hampe, A. and R. J. Petit. 2003. Conserving biological
diversity under climate change: the rear edge matters. Ecol. Lett. 8: 461-467.
Harrison, S. and J. F. Quinn. 1989. Correlated environments and the persistence of metapopulations. Oikos 56: 293-298.
Hsu, F.-H., C.-T. Yao, R.-S. Lin, C.-C. Yang and S.-J. Lai. 2004. Avian species composition and distribution along elevation gradient in the southern Taiwan. Endem. Species Res. 6: 41-66. (in Chinese)
Kindvall, O. 1996. Habitat heterogeneity and survival in a bush cricket metapopulation. Ecology 77: 207-214.
Ko, C.-Y., R.-S. Lin, T.-S. Ding, C.-H. Hsieh and P.-F. Lee. 2009. Identifying biodiversity hotspots by predictive models: a case study using Taiwan’s endemic bird species. Zool. Stud. 48: 418-431.
Koh, C.-N., P.-F. Lee and R.-S. Lin. 2006. Bird species richness patterns of northern Taiwan: primary productivity, human population density, and habitat heterogeneity. Diversity & Distrib. 12: 546-554.
Lamoreux, J. F., J. C. Morrison, T. H. Ricketts, D. M. Olson, E. Dinerstein, M. W. Knight and H. H. Shugart. 2006. Global test of biodiversity concordance and the importance of endemism. Nature 440: 212-214.
Lee, P.-F., T.-S. Ding, F.-H. Hsu and S. Geng. 2004. Breeding bird species richness in Taiwan: distribution on gradients of elevation, primary productivity and urbanization. J. Biogeog. 31: 307-314.
Lei, F.-M., Y.-H. Qu, J.-L. Liu, Y. Liu and Z.-H. Yin. 2003. Conservation on diversity and distribution patterns of endemic birds in China. Biodivers. & Conser. 12: 239-254.
Lei, F.-M., G..-A. Wei, H.-F. Zhao, Z.-H. Yin and J.-L. Lu. 2007. China subregional avian endemism and biodiversity conservation. Biodiver. & Conser. 16: 1119-1130. Li, S.-H., J.-W. Li, L.-X. Han, C.-T. Yao, H. Shi, F.-M. Lei
and C. Yen. 2006. Species delimitation in the Hwamei Garrulax canorus. Ibis 148: 698-706.
Liu, T.-R. and H.-J. Su. 1992. Forest plant ecology. The Commercial Press, Ltd. Taipei, Taiwan. 462pp. (In Chinese)
Malcolm, J. R., C. Liu, R. P. Neilson, L. Hansen and L. Hannah. 2006. Global warming and extinctions of endemic species from biodiversity hotspots. Conser. Biol. 20: 538-548.
Parmesan, C. and G. Yohe. 2003. A globally coherent fingerprint of climate change impacts across natural systems. Nature 421: 37-42.
Sauer, J. R., W. A. Link, J. D. Nichols and J. A. Royle. 2005. Using the North American Breeding Bird Survey as a tool for conservation: A critique of BART et al. (2004). J. Wildl. Manage. 69: 1321-1326.
Severinghaus, L. L. 2005. A study of the dispersal of Light-vented and Taiwan Bulbuls and the feasibility of establishing Taiwan Bulbul protection zone in Kenting National Park (I). Kenting National Park Headquarters, Pingtung, Taiwan. 176pp. (In Chinese)
Severinghaus, L. L. 2006. A study of the dispersal of and Taiwan and Light-vented Bulbuls and the feasibility of establishing Taiwan Bulbul protection zone in Kenting National Park (II). Kenting National Park Headquarters, Pingtung, Taiwan. 71pp. (In Chinese)
Schooley, R. L. and L. C. Branch. 2007. Spatial heterogeneity in habitat quality and cross-scale interactions in metapopulations. Ecosystems 10: 846-853. Shiu H.-J. and P.-F. Lee. 2003. Assessing avian point-count
duration and sample size using species accumulation function. Zool. Stud. 42: 357-369.
ter Braak, C. J. F. and P. F. M. Verdonschot. 1995. Canonical correspondence analysis and related multivariate methods in aquatic ecology. Aqu. Sci. 57: 255-289.
227 Thomas, H. 1996. Monitoring long-term population change:
why are there so many analysis methods? Ecology 77: 49-58.
Tucker, C. J. 1979. Red and photographic infrared linear combinations for monitoring vegetation. Remote Sens. Environ. 8: 127-150.
Walther, G. R., E. Post, P. Convey, A. Menzel, C. Parmesan, T. J. C. Beebee, J. M. Fromentin, O. Hoegh-Guldberg and F. Bairlein. 2002. Ecological
responses to recent climate change. Nature 416: 389-395. Watson, R. T. 2005. Turning science into policy: challenges
and experiences from the science-policy interface. Phil. Trans. R. Soc. 360: 471-477.
Yao, C.-T., X.-Z. Huang, M.-H. Lai, Y.-J. Luo and J.-H. Chen. 2007. Remove and captivity of Red-billed Blue Magpie in Wu-ling National Forest Recreation Area. Dongshih Forest District Office, Taichung, Taiwan. 22pp. (In Chinese)
臺灣特有鳥種巨棲地特徵與熱點分布
柯佳吟(1*)、林瑞興(2)、李培芬(1)
1. 國立臺灣大學生態學與演化生物學研究所,106 台北市羅斯福路 4 段 1 號,臺灣。 2. 行政院農業委員會特有生物研究保育中心,552 南投縣集集鎮民生東路 1 號,臺灣。 * 通信作者。Tel: 866-2-33662469; Fax: 886-2-23623501; Email: [email protected]
(收稿日期:2010 年 2 月 24 日;接受日期:2010 年 4 月 23 日)