Role
of
the
N-terminal
region of phospholipase A2 subunit
of
fl-bungarotoxin
in the toxin-Ca2+
complex-formation
Sin-Tak CHU and Yee-Hsiung CHEN*
Institute of Biochemical Science, College of Science, National Taiwan University, and Institute ofBiological Chemistry, Academia Sinica, Taipei 10764, Taiwan
/,-Bungarotoxin
consists of a phospholipase A2 subunit and a non-phospholipase A2 subunit. Modification of 8,1-bungarotoxin with CNBr resulted in cleavage at Met-6 and Met-8 of its phospholipase A2 subunit. Analysis of the fluorescence dataofboth thetoxin-Ca2+complex at 300-350 nm and the toxin-Tb3+ complex at 450-650 nm showed the existence oftwobinding sites for both metal ionsonthedifferent domains of the toxin molecule.AtpH 7.6the associationconstants for the high-affinity and low-affinity sites of the toxin-Ca2+ complex were determined to be 2.79-x103+0.21 x 10³M-1 and 0.47x10³+ 0.06x10³ -1 respectively. For the toxin-Tb3+ complex the association constant for the high-affinity site was 2.95x10³+0.43x10³ M-1 and that for the low-affinity site was 0.11x10 +0.03x10³M-1. Removal of the N-terminal octapeptide of the phospholipase A2 subunit from the toxin molecule caused disintegration of the low-affinity site but did not disrupt the high-affinity site. This might accompany a change in theconfigurationaround His-48 of the phospholipase A2 subunit. Between pH 6 and 8 the binding of metal ions tothe high-affinity site increased but that to the low-affinity site did not change with -increasing pH. The neurotoxicity andenzymic activity of the toxin were lost on removal of the low-affinity site.
INTRODUCTION
The presynaptically active toxins in the venoms of snakes belongingtoElapidae, Crotalidae and Viperidaearevery potent in blocking neuromuscular transmission (Chang, 1985).
fll-Bungarotoxin(fi1-BuTX),
the main component off,-bungaro-toxins in the venom of the Taiwan banded krait (Bungarus multicinctus) (Chen et al., 1982), is a representative of this kind of toxin. It inducesfirstly facilitation and irreversible disruption ofacetylcholine release from the cholinergic synapses before the blockade of neuromuscular transmission. Since this action is very specific and unique, the toxin has been exploited as an important tool or probe in physiological, biochemical and pharmacological studies.
/l3-BuTX
consists oftwosubunits linkedbyadisulphide bond (Kondo etal., 1978). One is a phospholipase A2 (PLA2) (EC 3.1.1.4) subunit having 120 amino acidresidues,
which shows a remarkable degree of structural similarity to other vertebrate PLA2enzymes (Kini& Evans, 1987). The otheris a rather small subunit with 60 amino acid residues. Its role in the neurotoxic effect is currently unclear, despite the fact that it shows sequence similarity to dendrotoxin and toxins I and K from the venom of mambas, which are representativeofKunitz proteinase inhibitors (Dufton, 1985) and themselves show facilitation oftransmitter release, interference with the binding of nativefl1-BuTX
in chick muscle and enhancement of the presynapticeffect of crotoxin and notexin(Harvey &Karlsson, 1982).,/%-BuTX
has anabsoluterequirement
forCa2+as acofactor forPLA2activity,which is believedtoplayanessential role in the neurotoxicity (Kelly etal., 1976)in spiteof the theorythat the lethal toxicity of1i1-BuTX
is notnecessarily associated with its enzymic activity (Yang&Lee, 1986).Establishing
thenatureof theCa2+-bindingdomains in the/,3-BuTX
moleculeisimportant
in elucidating the structure-function
relationship
oftheprotein
molecule. The maingoalof the present workwastoestablishthe
role of the N-terminal region of the PLA2 subunit in the toxin-Ca2+ complex-formation.
EXPERIMENTAL Materials
Crude venom ofthe Taiwan banded krait was supplied by Chen Hsin Tong Chemical Co., Taipei, Taiwan. CM-Sephadex C-25 and Sephadex G-50 were obtained from Pharmacia, Uppsala, Sweden.
TbCI3
was purchased from Alfa Products, Beverley, MA, U.S.A. All other chemicals were of reagent grade. Preparation of181-BuTX andmodification with CNBr/,-BuTX
was isolated from the crude venom on aCM-Sephadex C-25 column(Chen etal., 1982)and purified further
on a Sephadex G-50 column (Lin et al., 1984). It was cleaved withCNBr according to the method of Gross & Witkop (1962). The reaction mixture was dialysed against water to remove reagent andthesmall peptide fragment.
Assayof PLA2activity and toxicity
/,3-BuTX
releasedthefatty acidfrom
10,umolof egg phospha-tidylcholine suspended i'n 4ml of 5mhM-deoxycholate
at37'C. The amount offatty acidwasmeasured
byHItitration, which was carried out witha tadiometer- pHM8 standard pH-meter attached toaT80titrator andanAFIU80autoburette.
One unit ofPLA2activity wasdefinedasthereleaseof1,sequiv.
offatty acid fromphospholipid/min.
Eight albino mice
weighing
15-20 g were injected intraperi-toneally w-ithfl1-BuTX
orCNBr-,fl-BuTX.
The 50% lethal dosage (LD50) was determined according to a previously de-scribed method(Litchfield &Wilcoxon,
1949).Measurement ofc.d. andfluorescence
The concentration of
fll-BuTX
was determined from the absorbance at 280 nm, byusing
A1%m- 12.5(Lin
etal.,1984).
Abbreviations used:
8,/-BuTX, fll-bungarotoxin; CNBr-f,i-BuTX,
theCNBr-modified/ll-bungarotoxin;
PLA2,phospholipase A2.
S.-T. Chu and Y.-H. Chen
The c.d. was measured with a Jasco J-20 spectropolarimeter underconstantflushing with
N2
atroom temperature. The mean residue elipticity, [0], was estimated from the mean residue weight, which was calculated from the amino acid composition. The fluorescence intensity, expressed in arbitrary units, was measured at room temperature with a Hitachi F-4000 fluor-escencespectrophotometer. Both the excitation and the emission slit width were 10 nm. Raman emission due to the scattering of solvent was minimized by adjusting the intensity scale. In the scanning of an emission spectrum of Tb31 in the presence of protein in 0.02 M-Pipes buffer, the solution was freshly prepared. It took no more than 5min to scan a spectrum to prevent precipitation. F2 representedthe fluorescence intensity at wave-length A2 (nm) when the fluor was excited at wavewave-length A1 (nm). Analyses offluorescence dataThe modified Scatchard plot (Epstein et al., 1974) was con-structedtoanalyse the fluorescence data of a complex formed by ametal ion and
fl,-BuTX
orCNBr-/,%-BuTX:
IAFI/[L]free
=(KL FOO)-(KL
IAFI)
(1)
where AFis the change in protein fluorescence on adding metal ion, L, and F,oo theprotein fluorescence in the absence of metal ion. In the analysis ofTb3+ fluorescence, AF is the change in Tb3+ fluorescence inthe presence ofprotein, and FOOthe fluorescence atinfiniteTb3+concentration. KL is the association constantof the complex concerned. Throughout the titration,
IAFI/[L]totai
was plotted againstIAFI,
since [L]1reewasclose to[L]total.
RESULTS
Modification of
fi,-BuTX
with CNBrThere are two methionine residues (Met-6 and Met-8 ofthe PLA2 subunit) in the
#,/-BuTX
molecule. Cleavage ofthe toxin with CNBryieldedamodifiedtoxin,CNBr-,83-BuTX,
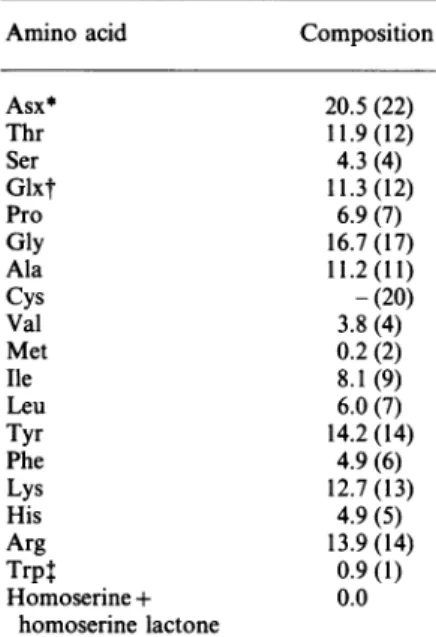
whichwas devoid ofmethionineorhomoserineand itslactonederivative,as shown intheanalysis ofamino acidcomposition giveninTable 1. A comparison of the amount of each amino acid in the modified toxin with the corresponding amount in the native toxin revealed the removal ofa peptide fragment comprisingAsx2Glx1Phe
Ile1Leu1Met2
from/J-BuTX bythechemical mod-ification. Theoctapeptide
turnsout tobetheratherhydrophobic
NLINFMEM ofthe N-terminal region of the PLA2 subunit. Apparently, all of 14 tyrosine and one
tryptophan (Trp-19
of PLA2 subunit)residues off1-BuTX remained'inCNBr-/?1-BuTX.
/%-BuTX showedweak PLA2 activitybut' very potent
neuro-toxicity. Its enzymic activity in 10mM-CaCI2 at'37°C was 115 units/mg of toxin and its LD50 was
assayed
tobe'0.017 ,ug/g
bodywt.ofmice. On theother
hand,
CNBr-3,1-BuTX
showednoenzymic activityandcausednolethalityeven atadoseashighas 2,ug/gbody wt.of mice.
Intrinsic fluorescences of thetwoproteins
The effect ofCaCl2 on the characteristics of intrinsic fluor-escence ofthearomatic residues in thetwo
protein
molecules in 0.02 M-PipesbufferatpH7.6wascompared.
Fig. l(a) shows the emission spectra when the
proteins
wereexcitedat275nm.Both
l,1-BuTX
andCNBr-/,%-BuTX
exhibited ashoulderat300-310nminadditiontoamainpeak
at339 nm, butCNBr-,81-BuTX
produced
less fluorescence intensity(Fig.
Ia).Theshoulder iscontributedby
tyrosine
residues that donot transfer their resonance energy toTrp-19,
and thepeak
arises fromTrp-19,which isexciteddirectly
withabsorption
energyorindirectly
through
resonanceenergy transferred from theproxi-matetyrosine residue(s).
Apparently,
inbothprotein
moleculesthe tyrosine residues contributing the shoulder are probably in thedomains separable from Trp- 19 and its neighbouring tyrosine residue(s) for the peak. Addition of CaC12 to the
f,l-BuTX
solution caused a considerable decrease is both F2305 and F239 (Fig. la). The Ca2+-induced change in F305 might reflect the characteristic of one Ca2+-binding site and that of F39 theTable 1. Amino acidcompositionofCNBr-081-BuTX
Allvaluesareexpressedasmolar ratios withrespect toleucine. The values in parentheses give the amino acid composition from the primarystructureof
f,l-BiT.X.
Amino acid Composition
Asx* Thr Ser Glxt Pro Gly Ala Cys Val Met Ile Leu Tyr Phe Lys His Arg Trpt Homoserine+ homoserinelactone 20.5(22) 11.9(12) 4.3(4) 11.3(12) 6.9(7) 16.7(17) 11.2(11) -(20) 3.8(4) 0.2 (2) 8.1(9) 6.0(7) 14.2 (14) 4.9 (6) 12.7(13) 4.9(5) 13.9(14) 0.9(1) 0.0
* Fifteenaspartic acidand sevenasparagineresiduesfrom the primary
structureof
/1-BuTX.
t Sevenglutamic acid and five glutamine residues from the primary structureof
?1'-BuTX.
t Tryptophan content wasdeterminedbya u.v.-absorption method (Scoffone&Fontana, 1975).
300 330 360 300 330 360
Wavelength (nm)
Fig.1. Fluorescenceemissionspectra of
/1l-BuTX
andCNBr-fl-BuTX
in 0.02M-PipesatpH7.6-Theemissionspectrawerescannedwiththeexcitationwavelengthat
275nm (a) or295nm (b). Both proteins were at5
gM:
,4,-BuTX alone; ----,
/3-BuTX
and 10mM-CaCl2; ---, CNBr-/%-BuTXalone; ---,CNBr-,fl-BuTX
and 10mM-CaCl2.1991 482
.0 2) C 0) C) 2) 0 '0 E 2 E a) 0) CD -2 'a x _s .-I '0 0 -0) E a) 0 t-C a, co 0 C 0 0 [Guanidiniumchloride] (M)
Fig. 2. Flexibility of tryptophan configuration and polypeptide backbone folding of Il,-BuTX and CNBr-,8,-BuTX in guanidinium chloride solution
Both proteins at5 aM wereused in thefluorescence study.
Fluor-escence was measured at 339nm (0) and c.d. was measured at
222nm(0): , 81-BuTX;----CNBr-fl,-BuTX. 2.0 1.5k-1.0e 0 5 6 7 8 9 pH
Fig.4. Enhancement of Th3+ fluorescence induced byeither /l,-BuTX or
CNBr-/l,-BuTXin0.02M Pipes bufferatpH 6-9
Fluorescence enhancement is represented byaratio ofTb3+ (1 mM)
fluorescence inthepresenceof each protein (5uM)tothe fluorescence in theabsence of protein:A, l,-BuTX; 0,CNBr-,81-BuTX.
>60K-40
20
450 500 550 600 650
Wavelength (nm)
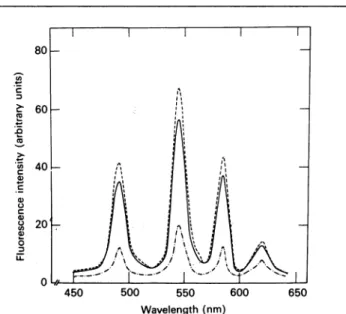
Fig. 3. EmissionspectraofTb3+inthepresenceof/I,-BuTXor
CNBr-/)l-BuTX in 0.02
M-Pipes
atpH
7.6Thespectrawerescanned with theexcitationwavelengthat295nm.
Tb3+wasat1mMandeachproteinwasat5msm: *---, Tb3+ alone; ,Tb3+and f,-BuTX;---,Tb3+andCNBr-/,%-BuTX.
characteristic of the otherCa2+-bindingsite. Theformerwaslost but the latter remained when the octapeptide from the N-terminus of the PLA2 subunit was removed from the toxin
molecule, as shown by the fact that addition of CaCl2 to the
CNBr-/,%-BuTX
solution diminished F339 considerably but hadnoeffecton F30 (Fig. la).
Thetwoproteinsshowed similar emission spectraarisingfrom excitation of tryptophan at 295nm (Fig. lb). Both proteins
exhibitedapeakat339nmwithaslightdifferencein fluorescence intensity ateach wavelength. Thepeakshifted to346nmwhen
,/3-BuTX
wasin 6M-guanidinium chlorideand to 349nmwhenthe protein disulphide bonds were broken with dithiotheritol (resultsnotshown).Similarbehaviour occurred withthepeakof
CNBr-,8,-BuTX.
Apparently, the sole tryptophan residue ofbothproteins isrestricted into aconfigurationthat differs from
that of free tryptophan in aqueous solution. The F339 of both proteins was diminished by addition of CaCl2 to the protein solution.
We compared further the change in both tryptophan
fluor-escence-and [01222 of the two proteins in 0-6 M-guanidinium
chloride(Fig. 2). The
/,3-BuTX
fluorescence changed slightly atat concentrations less than 1.5 M-guanidinium chloride but increasedmarkedly from 2M-to4M-guanidinium chloride and
levelled off at 5-6 M-guanidinium chloride. In contrast, the
CNBr-,31-BuTX
fluorescence increased gradually in 0-3M-guanidinium chloride and levelled off at the concentrations higher than 3 M-guanidinium chloride.
Both proteinsgavedouble minimaat220-222 and 208-210nm
in the c.d. between 200 and 250nm, indicating the existence of a helical structure in the protein molecules. The magnitudes
of [01222 and [01209 of
/,3-BuTX
were -6700 and -8400degrees cm2 dmol-V respectively, and those of
CNBr-/,-BuTX
were -5200and -6200 degrees-cm2 dmol-1 respectively. The helix-coil transition as represented by the change in [01222
occurred in 4-6M-and 3-6M-guanidiniumchloride for
#,/-BuTX
and CNBr-fl1-BuTX respectively. The structure of the two proteins in 6M-guanidinium chloride became an unordered
form that gave an average mean residue ellipiticity of 1000
degrees cm2 dmol-1. On the basis of a simple method for calculating the helicalcontent ofaprotein from its c.d. spectra
(Chen etal., 1972, 1974), the difference between the helical contents of the two proteins could be implied in a ratio of
([01222-
1000)CNBr-fl-BuTX
to ([01222l000)flBUTX9
where [01222 iSmeasured in the absence ofguanidiniumchloride. The ratiowas
estimatedtobe0.8, revealingthat 80% of the helicalstructureof
/l%-BuTX
remains inCNBr-/%-BuTX.
Enhancement ofTb3+fluorescence bythe two proteins
The emission spectrum ofTb3+ at pH7.6 showed a distinct quartet between 450 and 650nm (Fig. 3). Both
/,1-BuTX
andCNBr-fl1-BuTXwereabletoenhance theTb3+fluroescence(Fig. 3).
The enhancement ofTb3+fluorescencebythetwoproteinsat pH 6-9 was compared (Fig. 4). The fluorescence enhancement
was represented interms ofthe ratio ofF545 in thepresence of
II IJ
S.-T. Chu and Y.-H. Chen
Table 2. Association constants forthe formation of the complex between
/1l-BuTX
and metal ionThe associationconstants were determined by the two methods discussed in the text.
Ka,
andKa2are the association constants for the high-affinity and low-affinity sites respectively.10-3 xCa2'bindingKa (M) I0- xTb3+binding Ka(M)
/l-BuTX CNBr-fl1-BuTX
#1-BuTX
CNBr-fl-BuTX
pH Kal KKa2 al Ka a2aK K K 8.0 3.60+0.49 7.6 2.79+0.21 6.8 0.63 +0.05 6.5 0.26+0.05 0.45+0.07 0.47+0.06 0.46 +0.06 0.49+0.06 0.56+0.06 0.12+0.04
* Theaveragevalue determined from thetwomodified Scatchard plots shown in Fig. 5.
t It could not be determined precisely.
0.
x
0.5
0 2 4 6 8
IAFI
Fig. 5. Modified Scatchard plot for the binding ofCa2" toeitherf1l-BuTX
or
CNBr-811-BuTX
AtpH 7.6 androomtemperature,eachproteinat5 Mwastitrated
with thesamesolution in the presence of0.1M-CaCl2. The
fluor-escencedatawereanalysed by usingeqn.(1) with linear-regression fitting. The correlation coefficientwascalculatedto bemorethan
0.95 for eachcurve.*, F30 for,l1-BuTX;0,F...forfl-BuTX;A,
F...forfl1-BuTX;0,F...forCNBr-,fl-BuTX;A,F...for
CNBr-/l-BuTX.
proteintothat in the absence ofprotein. 83-BuTXenhancedTb3+ fluorescence slightly atpH 6-7; thiswas followedby amarked increased at pH7-8 and then a levelling offatpH8-9(Fig. 4). The midpoint of the change was at pH7.5.
CNBr-,/3-BuTX
increased the Tb3+ fluorescence gradually below pH6.7 and enhanced the fluorescence markedly from pH6.7 to pH 7.6, givingthemidpointat pH 7.0,but the enhancement diminished gradually from pH7.6 to 9.0 showing the midpoint at pH 7.9 (Fig. 4).
Characterization of the
Ca2l-binding
sitesonf6l-BuTX
The associationconstants of thecomplex-formation are
sum-marized in Table 2 for comparison. The fluorescence data obtained from adding Ca2+ to the
/,?-BuTX
or the CNBr-,81-BuTX solutionwere analysed usingeqn. (1).AtpH7.6alinearcurve wasobtained in the modified Scatchardplotfor each of the
five cases shown inFig. 5. Inthe /%-BuTX solution, the linear
curvefor the effect of Ca2+onF339wasnearly parallelwith that for
the effectofCa2" onF339(Fig. 5).These twocurvesappearedto
characterizethesameCa2+-bindingsite. The association constant
for thisaffinity sitewasestimatedtobe 2.79x 10³+0.21x 10³ M-1.
AnotherCa2l-binding sitewascharacterized by the effect of Ca2+
onF305(Fig. 5). The associationconstantfor thisaffinity sitewas
calculatedtobe 0.47x10³+0.06x 10³ M-1. Apparently,/?-BuTX
has two distinct Ca2+-binding sites. At pH 6-8 the binding of Ca2+tothelow-affinitysitewaspH-independent whereas thatto
thehigh-affinity sitewaspH-dependent: the lower thepHvalue, theweaker the affinity (Table 2).
In the
CNBr-,f1-BuTX
solution, only one Ca2"-binding sitecould be determined fromthe effect of Ca2+onF339orF339 (Fig.
5), but no Ca2+-binding site could be detected by the effect of
Ca2+onF305.As for thehigh-affinity siteof
81-BuTX,
the bindingofCa2+ to
CNBr-,81-BuTX
was weaker at the lower pH value. The associationconstantfor theCNBr-,81-BuTX-Ca2+
complexwas determined to be 0.56x 10³+ 0.06x 10³M-1 at pH 7.6 and 0.12x10³+0.04x10³M- atpH6.5 from themodified Scatchard plot.
Tb3+, atervalentlanthanide ion, has been demonstratedtobe
an excellent probe for studying the binding domain of Ca2+ in protein molecules (Epsteinetal., 1974; Wangetal., 1981). Our previous work showed that the fluorescence studies on the
bindingofTb3+to
,l1-BuTX
arerelevanttoCa2+binding (Chu & Chen, 1989). At pH7.6 /31-BuTX orCNBr-,/1-BuTX,
both at5.0JaM,was titrated withthe sameprotein concentration in the
presenceof
TbCl3.
The fluorescence datawereanalysed by usingeqn. (1). A concave curve was obtained for
fl,1-BuTX
in themodified Scatchard plot (Fig. 6), revealing the existence of multiple binding sites of Tb3+ on the 181-BuTX molecule.
Cal-culationonthe basis of the existence oftwodistinctCa2+-binding siteson
,8-BuTX
asprovedabovegavethe associationconstant of thehigh-affinitysitetobe2.95x 103+0.43x 10³M-1and thatof thelow-affinitysitetobe0.11 x103+0.03x10³M-1. Thesetwo values had thesameorder ofmagnitude asthose determined for
the
fi,-BuTX-Ca2+
complex. Binding of Tb3+tothe low-affinity sitewasprominent onlyathighmolar ratio ofTb3+to#,/-BuTX,
under which condition the enhancement of Tb3+ fluorescencewas so small that the determination for the associationconstantwaslessaccurate. On the otherhand,alinearcurve wasobtained for
CNBr-/,3-BuTX
in the modified Scatchard plot, indicating asingle bindingsite of Tb2+onthe
CNBr-pl-BuTX
molecule(Fig. 6). The association constant was estimated to be 0.67x 10³+0.07x 10³ M-1. At pH 6.5, the binding strength ofTb3+ to the
high-affinity sites of both
f,i-BuTX
andCNBr-,81-BuTX
de-creased to a great extent. The association constant for the high-affinity site on/,3-BuTX
decreased to 0.30xl03+ 0.04x10³M-1 and that for the
CNBr-/,%-BuTX-Tb3+
complex wasdownto0.21x 103+0.05x10³M-1.Estimation ofthe association
2.95 +0.43 0.11 +0.03 0.30+0.04 N.D.t
0.67 + 0.07 0.21 +0.05 484
r--n I-x 0 0 20 40 AF(arbitraryunits) 60
Fig.6.Modified Scatchard plot forthebindingofTh3+to either
1l1-BuTX
orCNBr-L-BuTXAt pH7.6androomtemperature,each protein at 5,CMwastitrated with thesamesolution in the presence of 0.1M-ThCI3. The fluor-escence data were fitted to eqn. (1) with linear regression. The correlation coefficients of thecurvesfor thehigh-affinitysite and the low-affinity siteon
fl1-BuTX
(-)were0.97 and0.94 respectively. The correlation coefficient of the curve for the siteonCNBr-,l-BuTX(0)was0.98.
conformations of the two molecules are very similar (Dijkstra etal., 1978, 1983; Keith etal., 1981). One Ca2+-binding loop and sixsegments in both proteins, which comprises more than 83 % of the total amino acid residues of themolecules, have a nearly superimposable backbone (Renetseder etal., 1985). These six similar segments may be taken as asingle rigidunit torepresent the 'homologouscore' structurethatmaybeglobally preserved in vertebrate PLA2 enzymes. The PLA2 subunit of
fl1-BuTX
contains highly conserved amino acid residues and sequences characteristic of all PLA2 molecules sequenced to date (van Scharrenberg etal., 1982; Dijkstra etal., 1984; Achari etal., 1987).Intheabsence ofan X-ray structurefor
f,l-BuTX,
wehave superimposedthe six segments of similar sequence and the Ca2+-binding loop predicted infl-BuTX on to the main-chain con-formation of bovinepancreaticPLA2 and C. atrox venom PLA2 and made some educated guesses. The plausible three-dimen-sional network (Fig. 7) together with the spectral properties shown in this work shed some light on several important structural features.Thec.d. characteristicsshown in Fig. 2 suggest a stable tertiary structure of
fl1-BuTX
in a segmental sense. The N-terminal region (residues 1-12)ofthe PLA2familyis a segment of similar sequence in helicalconformation (Dijkstra et al., 1978), which is believed to be part of the so-called 'interface recognition site' thatrequires thepresenceofCa2+in the interaction process with the micellarlipid/water interface(van Dam-Mieras etal.,1975). The activeconformation of PLA2 for the aggregated substrate is preserved in a hydrogen-bonded network (Renetseder etal., 1985), whichin the1,1-BuTX
PLA2 subunit may involve invariant His-48, Tyr-52, Pro-63, Tyr-68, Asp-94 and the N-terminal region (Fig. 8). EitherTyr-52 or Tyr-68 is distant from Trp-19 (Fig. 7). Considering the fluorescence characteristics shown in thiswork, wesuspectthe participation of thephenolic group of Tyr-52and/orTyr-68in the low-affinitysite. His-48 isrestricted and itsimidazole group mayhavean abnormalpK.
at 7.5 (Fig. constants at pH 6.5 was less accurate, since the Tb3+fluor-escenceenhanced by theproteins at pH 6.5 was less thanthat at pH7.6. Underthe circumstances, a precise determination ofthe assocition constant forthe low-affinity site was not feasible.
DISCUSSION
Previously, the multiple Ca2'-binding sites on the
/1-BuTX
molecule were independently revealed by a Scatchard plot obtained by a binding assay with the use ofradioactive Ca2+ (Abe etal., 1977) or by the effect ofCa2+ on the absorption spectrum of/,1-BuTX
(Yang & Lee, 1986). However, these two approachesarelimitedtoexploring the configurationaround the Ca2+-bindingdomain. For onething, Ca2+lacksuseful spectro-scopic properties that can be employed in probing the nature ofitsbindingsite. Foranother,theScatchardplotfor each of the two approaches gives no information abouteachCa2+-binding
domain. Thesetwo
problems
are overcome toacertainextentby
the analyticalmethods used in the present work,which enables us todefine the twodistinct
Ca2+-binding
siteson the different domains ofthe/l%-BuTX
molecule. This isuseful inelucidating
the structuralfeaturesof the
l1-BuTX-Ca2+
complex-formation.
Our results indicateclearlythat: (1)there are twodistinct
Ca2+-binding
siteson the different domains offl1-BuTX; (2)
the N-terminal region of the PLA2 subunit plays anessential role in maintainingtheintegrityof thelow-affinity site,whichseems to benecessary for theneurotoxicityandenzymic activity
towards the aggregatedsubstrate.Acomparison of thetertiary structures of bovine
pancreatic
PLA2 and Crotalus atrox PLA2 shows that the main-chain
Fig.7.Superimposition of theprimary structureofPLA2 subunitof
81-BuTX on tothe main conformation of bovine pancreatic PLA2 (Dijkstraetal.,1978)
The broken line indicates the main points of variance between pancreatic and Crotalus atrox PLA2 enzymes. The amino acid residuespredictedfor eachanalogoussegment andthe
Ca2+-binding
S.-T.Chu and Y.-H. Chen Tyr-52 I. H
0
- . I Asp-94 H 0 Tyr-68 NH2 Asn-1 -.Asn 4 N H ,1 H H". * H \ 'O~ Cz Pro-63Fig. 8. Schematicrepresentationof a proposed hydrogen-bonded network in the
/8,-BuTX
Thenetworkis drawn according to that described by Dijkstraetal. (1981).
4). The PKa shifts to a normal value at pH 7.0 (Fig. 4), as the restriction exerted on His-48 may be released by removal of the N-terminal region, which does not contact directly with His-48. This causes disintegration of the low-affinity site, which may be notaffected by the charged status of His-48 in native toxin (Table 2).
Thehigh-affinity site resides in a 'Ca2+-binding loop' running fromresidue 25 and 42, which are highly conserved glycine-rich sequencescharacteristic ofPLA2 molecules (Dijkstra et al., 1981). An oxygen cagethat sequesters the metal ion is stabilized by this loop (Dijkstra et al., 1981). In thefl-BuTXmolecule the oxygen cage may be formed in part fromthe three main-chain oxygen atoms atTyr-28, Gly-30 and Gly-32 and the carboxylate group ofAsp-49. The phenolic group of Tyr-28 is excluded as a Ca2+ ligandonthe basis of theconclusion drawn from an n.m.r. study onpig and bovine PLA2 molecules (Fisher et al., 1989). This is reflected in the fact that the high-affinity site is not characterized by the effect of Ca2+on F"'.In
CNBr-f,l-BuTX
only the high-affinity site isapparently stabilized byagroupwith PKa 7.9, as suggestedfrom thecharacteristics shown in Fig. 4.Thischarged groupmightbe ascribed to the a-amino group ofArg-1 of the non-PLA2 subunit, which might interact with the N-terminal region of the PLA2 subunit. The Ca2+-binding loop may not be so rigid that binding ofCa2+ to the high-affinity site causes achange in local conformation around Trp-19 (Fig. lb). Tyr-22 andTyr-106, both of whichare close toTrp-19, are separated from the two Ca2+-binding sites (Fig. 7). Resonance energy
transfer from these two tyrosine residues to Trp- 19 accounts partly for F3.
This work waspartially supported by the National Science Council, Taipei, Taiwan (Grant NSC 79-0412-B-001-07). Some of the work describedinthis paperformspartof a dissertation submitted by S.-T. C. in partial fulfilment for the requirement of the degree of D.Sc. at the National Taiwan University. We thank ProfessorMu-Chin Tzeng for hishelpful discussions andreading ofthe manuscript.
REFERENCES
Abe, T. A., Alema, S. & Miledi, R. (1977) Eur. J. Biochem. 80, 1-12 Achari,A., Scott, D., Barlow, P.,Vidal,J.C.,Otwinowski,Z.,Brunie,S.
& Sigler, P. B. (1987) Cold Spring Harbor Symp. Quant. Biol. 52, 441-452
Chang, C. C. (1985)Proc.Natl. Acad.Sci. Counc. BR.O.C. 9, 126-142 Chen, Y.H., Chan, K. H. & Yang, J. T. (1974) Biochemistry 13,
3350-3359
Chen, Y.H., Yang, J. T. & Martinez, H. M. (1972) Biochemistry 11, 4120-4131
Chen, Y.H., Tai, J.C., Huang, W.J., Lai, M.Z., Hung, M.C., Lai, M. D.& Yang, J. T. (1982)Biochemistry21, 2592-2600
Chu, S.T.&Chen,Y. H.(1989) Biochem.J.262,773-779
Dijkstra, B.W., Drenth, J., Kalk, K.H. &Vandermaelen, P. J.(1978) J. Mol. Biol.124,53-60
Dijkstra,B.W.,Kalk,K.H.,Hol,W.G.J.&Drenth,J.(1981)J.Mol. Biol. 147, 97-123
Dijkstra,B.W., Renetseter,R.,Kalk,K.H.,Hol,W.G.J.&Drenth,J. (1983)J. Mol. Biol.168, 163-179
Dijkstra,B.W.,Kalk,K.H.,Drenth, J., de Hass,G.H.,Egmond,M. R. &Slotboom,A. J. (1984)Biochemistry 23,2759-2766
Dufton,M. J.(1985)Eur. J.Biochem. 153, 647-654
Epstein, M.,Levitzki, A.&Reuben,J.(1974)Biochemistry 13,1777-1782 Fisher, J.,Primrose,W.U.,Roberts, G. C. K., Dekker, N., Boelens, R.,
Kaptein,R.&Slotboom,A. J.(1989) Biochemistry 28, 5939-5946 Gross,E.&Witkop, B.(1962)J.Biol. Chem.237, 1856-1860 Harvey, A.L.&Karlsson, E.(1982) Br. J.Pharmacol.77, 153-161 Keith, C.,Feldman,D.S.,Deganello, S., Glick, J., Ward,K.B.,Johnes,
E.0. &Sigler, P. B.(1981)J. Biol.Chem. 256,8602-8607
Kelly,R.B.,Oberg, S. G., Strong,P. N.&Wagner,G. M.(1976) Cold Spring Harbor Symp. Quant. Biol. 40, 117-125
Kini, R.M. &Evans,H.J.(1987)J. Biol.Chem.262,14402-14407 Kondo, K., Narita, K. & Lee, C.Y. (1978) J. Biochem. (Tokyo) 83,
91-99
Lin, W.Z., Chu, S.T. &Chen, Y. H. (1984) Proc. Natl. Acad. Sci. Counc. BR.O.C.8, 113-118
Litchfield, J. T. & Wilcoxon, F. (1949) J. Pharmacol. Exp. Ther. 96, 99-113
Renetseder, R.,Branie, S., Dijkstra, B.W., Drenth, J. &Sigler, P. B. (1985)J.Biol.Chem.260, 11627-11634
Scoffone,E.&Fontana,A.(1975)in Protein SequenceDetermination, 2nd edn. (Neeleman, S.B.,ed.),p. 167,Springer-Verlag,New York
van Dam-Mieras, M.C.E., Slotboom, A.J., Pieterson, W.A. & deHass, G.H.(1975) Biochemistry 20, 1584-1591
van Scharrenburg, G. J.M., Puijk, W.C., Egmond, M.R., van der Schaft,P.H., deHass, G.H. &Slotboom, A. J.(1982) Biochemistry 21,1345-1352
Wang, C.-L.A.,Leavis,P.C.,Horrocks,W. DeW.&Gergely,J.(1981) Biochemistry 20,2439-2444
Yang,C. C.&Lee,H. J.(1986)J.Protein Chem. 5, 15-28
1991
His-48
N N
N H
Received 17 December 1990/19March 1991;accepted2April 1991 486