Original article
Aggregation of Health Behaviors among Fourth Graders
in Northern Taiwan
Lee-Lan Yen, Sc.D.
a,*, Ching-Ju Chiu, M.S.
a, Wen-Chi Wu, Ph.D.
b,
and Ling-Yen Pan, Ph.D.
baInstitute of Health Policy and Management, College of Public Health, National Taiwan University, Taipei, Taiwan, R.O.C. bDivision of Health Policy Research, National Health Research Institutes, Taiwan, R.O.C.
Manuscript received July 26, 2005; manuscript accepted January 24, 2006
Abstract Purpose: To investigate the aggregation of health behaviors among fourth graders in northern Taiwan.
Methods: This study conducted an analysis of data collected from the 2001 Child and Adolescent Behaviors in Long-term Evolution (CABLE) project, which included a sample of 2075 fourth grade students. Factor analysis and cluster analysis were used to investigate the aggregation patterns. Results: After factor analysis, we found that the 18 health behaviors could be grouped under five factors. These five factors were named: healthy behavior, rule-breaking behavior, substance use behavior, violent behavior, and pleasure-seeking behavior, according to the characteristics of the various health behaviors grouped under each of them. Each study subject was assigned points for each of these five factors and then cluster analysis was used to divide the subjects into four different clusters. The names of these clusters and the percentage of subjects within them were as follows: healthy group (43.47%), violent group (29.11%), pleasure-seeking group (22.55%), and rebellious group (4.87%).
Conclusions: A total of 56.53% of the study sample were grouped under unhealthy groups (violent group, pleasure-seeking group and rebellious group), which indicates that already more than half of the students had lifestyles that put their health at risk. It was suggested that health and educational organizations need to place importance on behavioral problems in children and adopt early preven-tion measures.©2006 Society for Adolscent Medicine. © 2006 Society for Adolescent Medicine. All rights reserved.
Keywords: Children; Health behavior; Factor analysis; Cluster analysis; Lifestyle
A person’s lifestyle has a profound influence on their health [1,2]. Various researchers have stated [3–5] that many unhealthy behaviors originate in childhood and once they have arisen, have a negative effect on physiological, psychological and mental development[6,7]. A longitudinal study that followed 301 children for a period of 10 years[8]
found that strong effects of childhood aggression (engaged in verbal and physical aggressive behavior, such as fighting,
cursing, being mean to others, destroying properties of oth-ers and threatening othoth-ers) and the problem of drinking in young adulthood. However, as society and the economic environment in Taiwan continue to change, many behaviors that are harmful to health have become increasingly com-mon in younger age groups [9]. As a result, studying the health behaviors and lifestyle habits of children should be an important issue to provide insight into these problems.
Various researchers have placed importance on different child behaviors. Pickin and St. Leger[10] point out that the most common risk behaviors of 5–14-year old children are smoking, drinking alcohol, use of addictive drugs, and premar-ital sex. O’Brien and Bush [11], based on a medical and
*Address correspondence to: Dr. Lee-Lan Yen, Institute of Health Policy and Management, College of Public Health, National Taiwan Uni-versity, Room 623, No. 17, Hsu-Chou Road, Taipei, Taiwan, R.O.C.
E-mail address: lan@ha.mc.ntu.edu.tw
1054-139X/06/$ – see front matter © 2006 Society for Adolescent Medicine. All rights reserved. doi:10.1016/j.jadohealth.2006.01.010
developmental perspective, believe that the five most impor-tant behaviors influencing child health are: exercise and fitness, personal hygiene, food and nutrition, safety behaviors and substance abuse. According to a psychological development perspective, other researchers[12]emphasize that as children move into adolescence they demonstrate stronger indepen-dence and self-identity and, as a result, begin adopting danger-ous behaviors or rebelling against society in order to be in-cluded in their peer group. Therefore, this rebelliousness against society should be viewed as an important behavior. Most important of all, the proof that behaviors such as physical activity and alcohol use in early childhood will predict future health behavior had been verified in long-term studies[11,13]. The behaviors included in studies of child and adolescent behavior in Taiwan also show some variety. Much research
[14,15]has focused only on describing a particular behavior and investigating related risk factors. Only a few studies[9]
use factor analysis to investigate clustering of behaviors into groups. Some researchers[16 –19] point out that the mar-keting concept of market segmentation could be used to divide people into different groups based on their behavior structure or lifestyle characteristics. Market segmentation has been broadly used in marketing products or thoughts by using specific persuading methods toward different groups to increase the possibility of acceptance. This would not only help us to understand different behavior types but would also provide clues to the possible targeted health promotion projects that combined more related factors.
Studies using patterning methods have increased sub-stantially in the past two decades. Factor and cluster anal-ysis are two commonly used methods to derive behavioral patterns[20]. Factor analysis groups input variables accord-ing to the degree to which they are correlated with each other, thus aggregating behavioral data into distinct patterns (factors). Cluster analysis groups individuals into mutually exclusive categories (clusters). This study used the data of the Child and Adolescent Behaviors in Long-term Evolution
(CABLE) project in 2002 [21]. The main purpose of the CABLE project is to monitor and follow up the develop-ment of children’s health behaviors and health status. We used factor analysis to understand the health behavior types that are aggregated together. Afterwards, we used cluster analysis to investigate groups of subjects according to their behavior types. In this way, the subjects can be divided into a number of groups representing diverse health behaviors. It is hoped that our study findings can be used for planning health promotion projects in the future.
Methods Data sources
The data analyzed in this study come from the Child and
Adolescent Behaviors in Long-term Evolution (CABLE)
project; a longitudinal study that commenced in 2001[21].
In the CABLE study, the sample was divided between Taipei city (representing a metropolitan area) and Hsinchu County (representing a rural area). Randomized cluster sampling was then performed based on school size. In each of the two areas a total of nine schools were selected (one large, two medium-sized and six small). The grade one and four students from each of these schools were then selected as the longitudinal sample for the study. However, in our study we have only analyzed data from the original grade-four cohort. Before carrying out the questionnaire survey, the 3612 students selected were sent a parental consent form, after which only 2118 (58.64%) students agreed to participate in the study.
The CABLE project collected data using a self-devel-oped instrument that has been carefully refined for reliabil-ity and validreliabil-ity[21]. Ten experts including the psychologist, sociologist, behavioral scientist, health educator, and ele-mentary schoolteacher were invited to give their sugges-tions on improving the validity. A pilot study was con-ducted by 84 fourth graders to ensure that the wordings were appropriate to them. The validity and reliability of the questionnaire were also analyzed using pilot data. Further-more, the procedure of field survey is standardized. A total of 50 interviewers were selected from universities and di-vided into six groups, after they had gone through standard-ized training. Each group visited a sample school according to a particular predefined schedule. Interviewers collected data by getting the whole class to fill in the questionnaires at the same time.
There were 152 primary schools in Taipei City and 79 in Hsinchu County in 2000. Based on the number of fourth grade students, schools were divided into small (50 –199 students), medium-sized (200 –399 students) and large (more than 400 students). Schools were randomly selected to participate in the survey. Finally, six small schools, two medium-sized schools, and one large school were selected from each location. Every fourth grade student in the se-lected school was interviewed. Out of the 2118 fourth grad-ers that had consented to take part in the 2001 CABLE study, there were 2075 complete questionnaires, which was a response rate of 97.97%. The subjects included 52% males and 48% females; 52.5% lived in Taipei city and 47.5% in Hsinchu County; 28.36% of parents were highly educated, 57.6% of parents were middle-level educated, and 14.1% of parents were low-level educated. The research design, sam-pling method, questionnaire design, and data collection of the CABLE study are described elsewhere[21].
Study variables
Behaviors analyzed in the study included exercising after class, washing hands before eating, brushing teeth before bed, eating fruit and vegetables, drinking water, eating fast food, staying up late, watching television for prolonged periods (more than two consecutive hours), playing
com-puter or video games for prolonged periods (more than two consecutive hours), hitting others, swearing, breaking things when angry, vandalism, stealing, cheating on an examina-tion, smoking, drinking alcohol and chewing betel nut. Most of them were selected based on the previous studies[22–25]
and one authentic behavior instrument [26]. Only three items, including drinking water, washing hands before eat-ing, and chewing betel-nut, were selected under the consid-eration of local custom. Students were asked to choose one of five options that most represented their past experience of such behaviors. The five options for smoking, drinking alcohol and chewing betel nut were: “never,” “yes, but not in the last month,” “once or twice in the last month,” “many times in the last month,” and “every day in the last month.” The remaining variables were measured by four alternative answers relating to behaviors in the last week or last month: “never,” “once or twice,” “many times,” and “every day” Appendix.
Data analysis
Data were analyzed using SPSS statistical software ver-sion 10.0 (SPSS Inc., Chicago, Illinois). In the first stage, the original response options to behaviors were used. Factor extraction was then carried out using principal component analysis and varimax orthogonal rotation. The groups they formed were known as “latent structure.” The total number of factors was decided by using an eigenvalue of ⬎ 1 as suggested by Kaiser. Factor loading plots were also referred to in order to arise at a standard definition. In the second stage, “student” was taken as the major variable. Cluster analysis was then carried out to categorize students based on
their health behavior factor scores. By the factor scores, we calculate the Euclidean distance to decide the relation of each sample, and further group the most related sample in one cluster. Ward’s method of hierarchical cluster analysis was used first to gain a better range of cluster numbers. K-means method of nonhierarchical cluster analysis was then used to divide the sample into the clusters. The aim was to divide the subjects into a number of groups representing diverse health behaviors.
Results
Distribution of health behaviors in the study sample
As shown in Table 1, the five behaviors of eating fruit and vegetables, drinking water, washing hands before eat-ing, brushing teeth before bed, and doing exercise after class were grouped together as positive behaviors. Results showed that in the past week, 6.9% of students had not brushed their teeth before bed and 7.3% had not done any exercise after class. After combining the groups “many times every week” and “every day” together as “fre-quently,” behaviors with a lower prevalence of frequent performance included doing exercise after class (62.1%), washing hands before eating (74.3%), and brushing teeth before bed (76.9%). After grouping the other 13 behaviors as negative behaviors, the percentage of students perform-ing such behaviors “frequently” was also looked at. The negative behavior performed frequently by the highest num-ber of students was staying up late (37.9%), followed by watching television for prolonged periods (31.6%), playing
Table 1
Distribution of health behaviors in the study sample
Behavioral item (n) Never Once or twice in last week Several times in last week Every day in last week Eating fruit and vegetables (2067) 2.4 16.7 27.5 53.4
Washing hands before eating (2073) 3.7 22.0 29.4 44.9 Drinking water (2073) 2.5 12.3 20.5 64.6 Brushing teeth before bed (2069) 6.9 16.2 18.7 58.2 Exercising after class (2073) 7.3 30.7 28.4 33.7 Staying up late (2074) 17.3 44.9 23.0 14.9 Eating fast food (2073) 35.1 56.9 6.3 1.8 Prolonged playing of computer/video games (2069) 57.1 28.4 8.4 6.1 Prolonged TV watching (2060) 31.9 36.5 19.5 12.1
Never Once or twice in last month Several times in last month Every day in last month
Swearing (2073) 40.6 46.1 9.6 3.7
Breaking things when angry (2065) 71.6 23.6 3.0 1.8 Hitting others (2070) 45.4 43.7 9.1 1.9
Vandalism (2066) 92.6 6.6 .6 .2
Stealing (2069) 91.9 7.1 .6 .4
Cheating on an examination (2074) 90.3 9.2 .3 .1
Never Yes, but not in last month Once or twice in last month Several times in last month Every day in last month
Smoking (2071) 92.7 5.8 1.2 .3 .0
Drinking alcohol (2074) 67.0 24.3 7.3 1.1 .4 Chewing betel nut (2073) 96.9 2.1 .6 .3 .1
computer or video games for prolonged periods (14.5%), and swearing (13.3%). The behaviors of cheating on an examination, smoking, drinking alcohol and chewing betel nut were assessed by month. The groups “once or twice in the last month,” “many times in the last month,” and “every day in the last month” were grouped together as “currently.” The most common behavior currently performed by stu-dents was cheating in an examination (9.6%), followed by drinking alcohol (8.8%), smoking (1.5%) and chewing betel nut (1.0%).
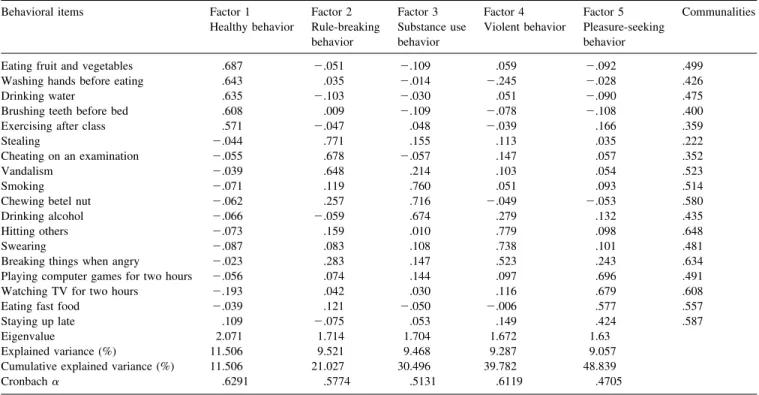
Factor structure of health behaviors in the study sample Table 2shows the results of the factor analysis of “health behaviors.” The 18 health behaviors were grouped into a total of five factors. These five factor groups were given names based on the types of behaviors that were included under them. Factor one was called “healthy behavior” and included eating fruit and vegetables, washing hands before eating, drinking water, brushing teeth before bed, and doing exercise after class. Factor two was called “rule breaking behavior” and included stealing, cheating on an examina-tion, and vandalism. Factor three was called “substance use behavior” and included smoking, drinking alcohol and chewing betel nut. Factor four was called “violent behavior” and included hitting others, swearing, and breaking things when angry. Factor five was called “pleasure-seeking be-havior” and included playing computer or video games for prolonged periods, watching television for prolonged
peri-ods, eating fast food, and staying up late. The R2for these five factors was 11.506%, 9.521%, 9.468%, 9.287% and 9.057%, respectively. The communality R2was 48.839%.
Clustering of subjects according to factor scores of health behaviors
Table 3 shows the results of cluster analysis of “stu-dents” as the major analysis variable. The 18 behaviors in the study sample could be simplified into five factors. In addition, each student could be allocated points for behav-iors falling within the five categories. Based on measure-ment of the Euclidean distance, students could be further divided into different groups based on low within-group heterogeneity and high between-group heterogeneity.
Firstly, the cohesive coefficient of Ward’s Method (also called “Minimum Variance Method”) was used. When five groups were condensed into four groups, agglomeration coefficients increased from 6613.08 to 7493.26. The incre-mental rate of change in the agglomeration coefficient was largest at 13.31%. When four groups were condensed into three groups, the agglomeration coefficients increased from 7493.26 to 8390.25 and the incremental rate of change in the agglomeration coefficient was 11.97%. When the change of agglomeration coefficients is largest, it stands that the number of clusters would be the most appropriate. Thus, our result shows that it was more appropriate to divide the study sample into four or five groups. K-means method of nonhierarchical cluster analysis was then used to divide the
Table 2
Factor structure of health behaviors in the study sample (n⫽ 2075) Behavioral items Factor 1
Healthy behavior Factor 2 Rule-breaking behavior Factor 3 Substance use behavior Factor 4 Violent behavior Factor 5 Pleasure-seeking behavior Communalities
Eating fruit and vegetables .687 ⫺.051 ⫺.109 .059 ⫺.092 .499 Washing hands before eating .643 .035 ⫺.014 ⫺.245 ⫺.028 .426 Drinking water .635 ⫺.103 ⫺.030 .051 ⫺.090 .475 Brushing teeth before bed .608 .009 ⫺.109 ⫺.078 ⫺.108 .400 Exercising after class .571 ⫺.047 .048 ⫺.039 .166 .359
Stealing ⫺.044 .771 .155 .113 .035 .222
Cheating on an examination ⫺.055 .678 ⫺.057 .147 .057 .352 Vandalism ⫺.039 .648 .214 .103 .054 .523
Smoking ⫺.071 .119 .760 .051 .093 .514
Chewing betel nut ⫺.062 .257 .716 ⫺.049 ⫺.053 .580 Drinking alcohol ⫺.066 ⫺.059 .674 .279 .132 .435 Hitting others ⫺.073 .159 .010 .779 .098 .648
Swearing ⫺.087 .083 .108 .738 .101 .481
Breaking things when angry ⫺.023 .283 .147 .523 .243 .634 Playing computer games for two hours ⫺.056 .074 .144 .097 .696 .491 Watching TV for two hours ⫺.193 .042 .030 .116 .679 .608 Eating fast food ⫺.039 .121 ⫺.050 ⫺.006 .577 .557 Staying up late .109 ⫺.075 .053 .149 .424 .587 Eigenvalue 2.071 1.714 1.704 1.672 1.63
Explained variance (%) 11.506 9.521 9.468 9.287 9.057 Cumulative explained variance (%) 11.506 21.027 30.496 39.782 48.839 Cronbach␣ .6291 .5774 .5131 .6119 .4705
KMO measure of sampling adequacy⫽ .80 (based on Kaiser’s criteria: KMO ⱖ .80 means that the result of the factor analysis is acceptable.) Bartlett’s test of sphericity:2⫽ 4667.591 (df ⫽ 153; p ⬍ .001).
study sample into actual clusters. When the sample was divided into four clusters the number of subjects in each cluster was 101, 604, 468, and 902, respectively. Discrimi-nant analysis verified the validity and stability of the clus-ters, and the goodness of fit of the categorization was 93.5%.
Scheffé method was used to compare differences in the five factors among four clusters (Table 3). The results showed that for the factor “healthy behavior,” cluster four had the highest score (.4673). Cluster one had the highest score (3.1962) for “rule breaking behavior.” Cluster one also had the highest score (.2867) for “substance use be-havior.” Cluster two had the highest score (.8490) for “vi-olent behavior” and cluster three had the highest score (1.3242) for “pleasure seeking behavior.” Cluster one ac-counted for 4.87% of the student sample and as they had the most prominent rule-breaking and substance use behavior, they were called the “rebellious group.” Cluster two ac-counted for 29.11% of the student sample and as they were the group with the most obvious violent behavior, they were named the “violent group.” A total of 22.55% of students were grouped under cluster three and this cluster was called the “pleasure-seeking group” as this cluster had the highest scores for pleasure-seeking behavior. Cluster four ac-counted for 43.47% of the student sample and had the highest score for healthy behaviors and the lowest scores for substance use and violence. This cluster was called the “healthy group.”
Discussions
Latent health risks due to insufficient healthy behaviors in elementary school students
Our study found that fourth grade elementary school students had less ideal positive behaviors than we expected. These positive behaviors in the study included eating fruit and vegetables, washing hands before eating, drinking wa-ter, brushing teeth before bed, and doing exercise after class. The percentage of students who did not perform such be-haviors regularly was 19.1%, 25.7%, 14.8%, 23.1%, and
38.0%, respectively. The most concerning aspect of these results is that failure to develop such positive health behav-iors early on in life threatens the quality of health in later life. It is even more important to note the expression of negative behaviors in the fourth graders. We discovered that 82.7% of students had stayed up past 10 p.m. at night in the past week. In addition, 68.1% and 64.9% of students, re-spectively, had “watched television for prolonged periods” or “eaten fast food” in the past week. Although another report [4] differed from our study in its study subjects, measurement scales and survey time, meaning that results from the two studies cannot be directly compared, the over-all conclusion was that latent threats to the health of chil-dren and adolescents, notwithstanding they may be affected by their parents’ norm and behavior, already exist due to lack of positive behaviors and the incorporation of negative behaviors into their lifestyles. It would be worthwhile fol-lowing this cohort of students to help determine whether or not this phenomenon will continue to increase and in fact worsen as the children become older.
Grouping of health behaviors of elementary school students into different factors based on their particular characteristics
Our study found that the health behaviors of fourth grade elementary school children could be grouped into the five latent factors of “healthy behavior,” “rule-breaking behav-ior,” “substance use behavbehav-ior,” “violent behavior” and “pleasure-seeking behavior” based on particular character-istics. In comparison with the factor structure of the 1999 study of harmful behaviors in junior high school students in Taipei City [9], although the behaviors included were not completely identical and the age of subjects were different, there was still a similar factor structure. For example, eating fast food, staying up late, watching television for prolonged periods and playing video games for prolonged periods were grouped under “pleasure-seeking behavior.” Smoking, drinking alcohol and chewing betel nut were grouped under “substance abuse behavior,” and stealing, cheating on an examination and vandalism were grouped under
“rule-Table 3
Comparison of health behavior factor scores for the four clusters
Behavioral pattern Mean of factor score F value Scheffé’s test Cluster 1 Cluster 2 Cluster 3 Cluster 4
Rebellious group n⫽ 101 (4.87%) Violent group n⫽ 604 (29.11%) Pleasure-seeking group n⫽ 468 (22.55%) Healthy group n⫽ 902 (43.47%) Healthy behavior ⫺.194 ⫺.517 ⫺.191 .467 154.550*** 4⬎ (1,3) ⬎ 2 Rule-breaking behavior 3.196 ⫺.285 ⫺.233 ⫺.046 792.128*** 1⬎ 4 ⬎ (2,3) Substance use behavior .287 ⫺.049 .279 ⫺.144 22.315*** (1,3)⬎ (2,4) Violent behavior .569 .849 ⫺.154 ⫺.553 394.759*** 2⬎ 1 ⬎ 3 ⬎ 4 Pleasure-seeking behavior .191 ⫺.462 1.324 ⫺.399 774.847*** 3⬎ 1 ⬎ (2,4)
breaking behavior.” Whether or not these results indicate that health behaviors during elementary school are already fixed will need further longitudinal research to verify.
Previous research[9,27–29]has indicated that behaviors that are grouped under the same latent factor have the same characteristics. Although some demographic variables in-cluding gender, grade and school achievement, and other factors including attitude towards health risk behaviors, peer relation, and peer’s behavior may cause the differences in behaviors, such differences are irrelevant to the latent factor structures [9]. Parents and schoolteachers need to focus on more than a single behavior when designing pre-vention strategies by looking at the aggregating character-istics of similar behaviors[30]. In other words, when a child is found to have a certain behavioral problem, attention should be paid to whether the child also has other similar behavioral problems.
Grouping of elementary students into different clusters based on the factor structure of health behaviors
This study used the “market segmentation concept” to divide students into different clusters based on different health behavior factor scores. As a result we discovered that the fourth grade students could be separated into four dif-ferent clusters. A total of 43.47% of students were grouped into the “healthy group” as they had the highest factor scores for healthy behaviors (eating fruit and vegetables, washing hands before eating, drinking water, brushing teeth before bed, doing exercise after class) and the lowest factor scores for substance use and violent behaviors. These results show that less than half of the fourth graders had “healthy lifestyles.” In other words, more than half of the students were grouped under the other three unhealthy clusters (vi-olent group, pleasure-seeking group and rebellious group). A total of 29.11% of students fell into the “violent group.” These students had the lowest factor scores for healthy behavior, rule-breaking behavior, and pleasure-seeking behavior, and they had the highest factor scores for violent behavior (hitting others, swearing, and breaking things when angry). This result shows that almost one-third of students display violent behavior in their daily life. Ac-cording to previous studies investigating the relationship between social support and risk behaviors among children and adolescents[31–36], the high correlation between low social support and high risk behaviors was found. There-fore, it was suggested that social support and training in social appropriateness be provided for these children. In addition, 22.55% of students were grouped under the “plea-sure-seeking group.” These students had the highest factor scores for pleasure-seeking behavior (includes playing com-puter or video games for prolonged periods, watching tele-vision for prolonged periods, eating fast food and staying up late). This shows that almost one-quarter of students fre-quently take part in sedentary leisure activities and do not
have regular eating and sleeping habits. Finally, although the “rebellious group” contained the smallest proportion (4.87%) of students, this is the behavioral group that is the most concerning, as these students had the highest factor scores for rule-breaking behavior (stealing, cheating on an examination, and vandalism) and substance use behavior (smoking, drinking alcohol and chewing betel nut). How-ever, if an individual starts using addictive substances or breaking societal norms when they are a child, then the chances of them developing other deviant behavior or health-harming behaviors in the future are quite high [4]. Factors that may affect those problems should be identified to change such behaviors early in one’s childhood. Both parents and schoolteachers need to pay particular attention to these students and help them to change such behaviors early through the implementation of relevant policies and intervention programs.
Contribution of factor analysis and cluster analysis
Previous research using factor analysis or cluster analy-sis to investigate health behaviors has not commonly fo-cused on children. In contrast, the subjects in this study were fourth grade elementary school children. In addition to confirming the factor structure of their health behaviors, our study also divided the students into different clusters based on factor structure of health behaviors. These findings will be the reference for intervention designs in the future. Based on our study results, we recommend that early investigation of elementary school children should be implemented to help set up healthy lifestyles in the crucial period. Besides, factors affecting children to enter a specific group can also be detected for further modification.
Limitations of this study
There are some limitations of this study. First, social desirability may cause the possibility of overestimation for positive behaviors and underestimation for negative behav-iors. In order to avoid this problem, the trained interviewers were asked to describe the procedures for confidentiality to all students. Second, the participation rate of the CABLE project (58.64%) resulting from the active consent process is fairly low[21]. However, it is very close to the partici-pation rate of the High 5 Alabama project (59.9%)[37], and the active informed consents from the parents was also obtained. Third, the results of this study may be generalized only to the students of public primary schools in northern Taiwan. Fourth, among the four groups in our result, the children in the “rebellious” group are high in not only rule-breaking behavior but also substance use behavior. However, substance use behaviors (including smoking, drinking alcohol, and chewing betel nut) represent the life-time experience but not recent behaviors. Thus, the impli-cation should be carefully interpreted and exerted.
Conclusions
The 18 health behaviors of the fourth graders were found to be grouped under five factors: healthy behavior, rule-breaking behavior, substance use behavior, violent behavior and pleasure-seeking behavior. Based on these behavioral factors, the students were divided into four clusters: healthy group (43.47%), violent group (29.11%), pleasure-seeking group (22.55%) and rebellious group (4.87%). A total of 56.53% of the students were grouped under unhealthy groups. It was suggested that health and educational orga-nizations need to place more importance on the behavioral problems in school children and adopt early prevention measures.
Acknowledgments
The study carried out an analysis of part of the 2001 data from the National Health Research Institutes supported (HP-090-SG03) Child and Adolescent Behaviors in Long-term Evolution (CABLE) Project. We would like to thank the Education Departments of Taipei City and Hsinchu County for administrative support, the 18 participating schools for providing venues and time for the surveys, the children and their parents who were involved in the survey for their support and the interviewers and supervisors that helped carry out the survey.
Appendix
The behavioral items and wordings in the questionnaire Behavioral item Wording of question
1. Eating fruit and vegetables Did you eat fruit or vegetables last week?
2. Washing hands before eating Did you wash you hands before eating?
3. Drinking water Did you drink boiled water or mineral spring water last week?
4. Brushing teeth before bed Did you brush your teeth before bedtime last week?
5. Exercising after class Did you do exercise except the physical fitness class last week? 6. Staying up late Did you go to bed later than 10 p.m.
last week?
7. Eating fast food Did you eat fast food such as hamburgers, French fries, fried chicken, instant noodles, pizza last week?
8. Prolonged playing of computer or video games
Did you play computer or video games consecutively more than two hours last week?
9. Prolonged TV watching Did you watch television consecutively more than two hours last week? 10. Swearing Did you swear to anyone last month? 11. Breaking things when angry Did you break things when you were
angry last month?
12. Hitting others Did you hit anyone last month?
Behavioral item Wording of question
13. Vandalism Did you vandalize in school last month?
14. Stealing Did you steal anything last month? 15. Cheating on an examination Did you cheat on an examination (took
a peek at the text book or others’ answer) last month?
16. Smoking Have you ever smoked (even one puff)?
17. Drinking alcohol Have you ever used alcohol (even one mouthful)?
18. Chewing betel nut Have you ever chewed betel nut (even one mouthful)?
The scales for measuring smoking, drinking alcohol and chewing betel nut: 1⫽ never; 2 ⫽ yes, but not in last month; 3 ⫽ once or twice in last month; 4⫽ several times in last month; 5 ⫽ every day in last month. The scales for measuring the rest behavioral items:1⫽ never; 2 ⫽ once or twice; 3⫽ several times; 4 ⫽ every day.
References
[1] Lalonde M. A New Perspective of the Health of Canadians. Ottawa, ON: Office of the Canadian Minister of National Health and Welfare, 1974.
[2] U.S. Department of Health and Human Services (USDHHS). Healthy People: The Surgeon General’s Report on Health Promotion and Disease Prevention. Washington, DC: Public Health Service, 1979. [3] Cunnane SC. Childhood origins of lifestyle-related risk factors for
coronary heart disease in adulthood. Nutr Health 1993;9:107–15. [4] Kannel WB, D’Agostino RB, Belanger AJ. Concept of bridging the
gap from youth to adulthood. Am J Med Sci 1995;310:S15–21. [5] Gillander GK, Hammarstrom A. Can school-related factors predict
future health behavior among young adolescents? Public Health 2002;116:22–9.
[6] Birch HG, Gussow JD. Disadvantaged Children: Health, Nutrition and School Failure. New York, NY: Harcourt, Brace & World, 1970. [7] Tinsley BJ. Multiple influence on the acquisition and socialization of children’s health attitudes and behavior: an integrative review. Child Dev 1992;63:1043– 69.
[8] Engels RCME, Vermulst AA, Dubas JS, et al. Long-term effects of family functioning and child characteristics on problem drinking in young adulthood. Eur Addict Res 2005;11:32–7.
[9] Yen LL, Wen HC, Tseng TS, Sun YC. A study on health-risk behaviors of youth: the current status among junior high school students in Taipei City, 1998. Public Health 1999;26:75–90. [10] Pickin C, St. Leger S. Assessing Health Needs Using the Life Cycle
Framework. Buckingham, UK: Open University Press, 1993:52;91– 101.
[11] O’Brien RW, Bush PJ. Health behavior in children. In: Gochman DS, ed. Handbook of Health Behavior Research III: Demography, Devel-opment and Diversity. New York, NY: Plenum Press, 1997:49 –71. [12] DiClemente RJ, Cobb B. Adolescent health promotion and disease
prevention. In: Raczynski JM, DiClemente RJ, eds. Handbook of Health Promotion and Disease Prevention. New York, NY: Kluwer Academic/ Plenum Publishers, 1999:491–520.
[13] Stueve A, O’Donnell LN. Early alcohol initiation and subsequent sexual and alcohol risk behaviors among urban youths. Am J Public Health 2005;95:887–93.
[14] Yang HH, Chen DR, Yen LL, Ke SR. The relationship between classmates’ interpersonal network and smoking behavior: a prelimi-nary investigation among the 10th graders. Taiwan J Public Health 2002;21:164 –72.
[15] Lee YM, Yen LL. A study of obesity in seventh graders and their parents at Taipei City, 1991: the familial resemblance of height, weight and body fatness. Chin J Public Health 1995;14:150 – 8. [16] Mayer JP, Taylor JR, Thrush JC. Exploratory cluster analysis of
behav-ioral risks for chronic disease and injury: implications for tailoring health promotion services. J Community Health 1990;15:377– 89.
[17] Slater MD, Flora JA. Health lifestyles: audience segmentation anal-ysis for public health interventions. Health Educ Q 1991;18:221–33. [18] Granzin KL, Olsen JE, Painter JJ. Marketing to consumer segments using health-promoting lifestyles. J Retail Consum Serv 1998;5:131– 41.
[19] Lefebvre RC, Rochlin L. Social marketing. In: Glanz K, Lewis FM, Rimer BK, eds. Health Behavior and Health Education: Theory, Research, and Practice. San Francisco, CA: Jossey- Bass, 1997:384 – 402.
[20] Newby PK, Tucker KL. Empirically derived eating patterns using factor or cluster analysis: a review. Nutr Rev 2004;62:177–203. [21] Yen LL, Chen L, Lee SH, et al. Child and adolescent behavior in
long-term evolution (CABLE): a school-based health lifestyle study. Promot Educ 2002;33– 40 (suppl 1).
[22] Currie C, Samdal O, Boyce W, Smith B. Health Behavior in School-Aged Children: a World Health Organization Cross-National Study: Research Protocol for the 2001/02 Survey. Edinburgh, UK: Child and Adolescent Health Research Unit, University of Edinburgh, 2001. [23] Statistics Canada. National Longitudinal Survey of Children:
Over-view of Survey instruments. Available from: http://www.statcan.ca/ cgi-bin/dowpub/freepub.cgi
[24] Harris KM, Florey F, Tabor J, et al. The National Longitudinal Study of Adolescent Health: Research Design (2003). Available from: http://www.cpc.unc.edu/projects/addhealth/design
[25] Centers for Disease Control. Methodology of the Youth Risk Behav-ior Surveillance System. MMWR 2004;53:1–14.
[26] Archenbach TM, Edelbrock C. Manual for the Child Behavior Check-list and Revised Child Behavior Profile. Burlington, VT: University of Vermont, Department of Psychiatry, 1983.
[27] Donovan JE, Jessor R, Costa FM. Structure of health-enhancing behavior in adolescence: a latent-variable approach. J Health Soc Behav 1993;34:346 – 62.
[28] Laaksonen M, Prattala R, Karisto A. Patterns of unhealthy behavior in Finland. Eur J Public Health 2001;11:294 –300.
[29] Laaksonen M, Luoto R, Helakorpi S, Uutela A. Associations between health-related behaviors: a 7-year follow-up of adults. Prev Med 2002;34:162–70.
[30] Resnick MD. Protective factors, resiliency, and healthy youth devel-opment. Adolesc Med 2000;11:157– 64.
[31] Bonny AE, Britto MT, Klostermann BK, et al. School disconnected-ness: identifying adolescents at risk. Pediatrics 2000;106:1017–21. [32] Coogan PF, Adams M, Geller AC, et al. Factors associated with
smoking among children and adolescents in Connecticut. Am J Prev Med 1998;15:17–24.
[33] Fleming CB, Kim H, Harachi T, et al. Family processes for children in early elementary school as predictors of smoking initiation. J Adolesc Health 2002;30:184 –9.
[34] Lewis CE, Lewis MA. Improving the health of children: must the children be involved? Annu Rev Public Health 1983;4:259 – 83. [35] Maes L, Lievens J. Can the school make a difference? A multilevel
analysis of adolescent risk and health behaviour. Soc Sci Med 2003; 56:517–29.
[36] Pratt L. Child-rearing methods and children’s health behaviors. J Health Soc Behav 1973;14:61–9.
[37] Harrington KF, Binkley D, Reynolds KD, et al. Recruitment issues in school based research: lessons learned from the high 5 Alabama project. J Sch Health 1997;67:415–21.