Variations in Sediment Yield and
Transportation Characteristics in the
ZengWen Reservoir Watershed After
Typhoon Morakot
Yu-Shiu Chen, Chien-Yang Lin, Ping-Kun Lu, and Chun-Yi Wu
Abstract
Typhoon Morakot brought long-duration and high-intensity rainfall to southern Taiwan in 2009. A cumulative rainfall of 3,005 millimeters in five days was observed at the upstream side of ZengWen River (Alishan Weather Station). About 91,080,000 m3 sediment was brought into ZengWen Reservoir. The landslide and bare areas in the ZengWen Reservoir watershed increased from 255 hectares to 1,467 hectares. Henceforth, sediment monitoring projects were launched by Southern Region Water Resources Office. Aerial photography and satellite imagery were used for tracking landslide and bare areas. LiDAR was applied to topographic variation analysis of slopes and river bed. Discharge and concentration were measured at DaPu Check Dam monitoring site, which is the entrance for the mainstream to ZengWen Reservoir.
This study has an eight-year duration (2011-2018). The main purpose of this study is using monitoring and simulations to determine variations in sediment yield and transportation characteristics.
This study found landslide and bare areas decreased to 213 hectares in 2018. There were 62 bare areas which were individually more than five hectares in 2009. Lately, there were only nine left in 2018. Mass sediment deposited on the river bed right after typhoon Morakot. Since then, the elevation of most sections of mainstream gradually decreased. Rating curves of discharge versus suspended load concentration were established annually according to the site monitoring data. The concentration was 35,809 ppm at discharge of 500 m3/s in 2011. It decreased to 8,889 ppm in 2018, which is much closer
to the concentration of 7,983 ppm in the past research in 2006.
Sediment numerical simulations (Sediment Budget Model, SBM) were done to analyze sediment yield and transport characteristics. It represented similar phenomenon as above observations. Furthermore, the proportions of deposits in the reservoir which came from the mainstream were obtained. Those were 65% in 2009, 72% in five years, and 80% in ten years; therefore, the mainstream has the most effect of sediment supply to the reservoir. Keywords: ZengWen Reservoir, Sediment yield, Sediment model, Erosion, Satellite Imagery
1 Introduction
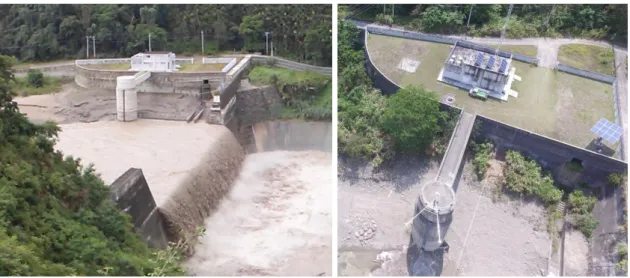
Typhoon Morakot brought long-duration and high-intensity rainfall to southern Taiwan in 2009. A cumulative rainfall of 3,005 millimeters in five days was observed at Alishan Weather Station, which is at the upstream side of ZengWen River. The event caused about 91,080,000 m3 sediment brought into ZengWen Reservoir. Henceforth, sediment monitoring projects were launched by Southern Region Water Resources Office, Water Resources Agency. A monitoring site (Fig.1) was also built by Southern Region Water Resources Office in 2012 at DaPu Check Dam, which is the entrance for the mainstream to ZengWen Reservoir. This study is mainly according to the results of above projects in 2011-2018. The purpose of this study is using monitoring and simulations to determine variations in sediment yield and transportation characteristics.
Fig. 1: DaPu Check Dam monitoring site
2 Data and methods
2.1 Bare area
Sediment yield mostly comes from soil erosion or landslides during severe rain events. Thus, bare area is the index of sediment yield on slopes. To determine the bare area, satellite imagery with less cloud to avoid shading was used. Normalized Difference Vegetation Index (NDVI) was applied to find out the possible bare areas automatically. These areas were then modified artificially.
After Typhoon Morakot, there were 62 bare areas more than five hectares, which will be shown in the Results section. These areas are considered to have a high potential for sediment yield. Thus, tracking changes in these areas is also done annually.
2.2 Major river topography
The topography of ZengWen River upstream the reservoir was evaluated by digital elevation model (DEM). Several DEMs during 2006-2018 were built from different
methods, including stereoscopy, LiDAR, and drone mapping. These tasks were mostly done in the dry season to avoid the influence of river water. This study compares the DEMs in 2010, 2011, 2012, 2013, 2015, which were built by airborne LiDAR.
2.3 River discharge and sediment concentration
The river discharge and sediment concentration were measured at DaPu Check Dam. Radar level gauge was used to obtain the water level. The water discharge was then calculated by weir formula.
The sediment concentration was measured by sampling. During heavy rain events and when the water level is high enough, river water was pumped to the monitoring site every hour. The concentration of suspended load was then estimated by pycnometer method. 2.4 Sediment numerical simulation
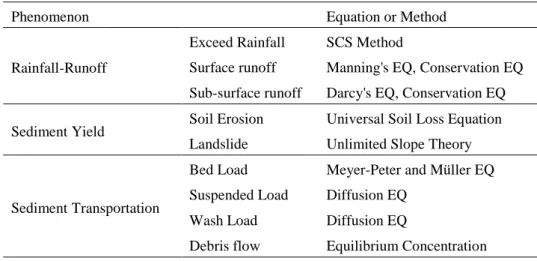
The numerical simulation used in this study is Sediment Budget Model (SBM), which was developed in the project of Water Resources Agency, MOEA, Taiwan in 2002. The model was used in later studies (Shieh at el., 2006, and Tsai at el., 2013). The methods or equations to interpret each phenomenon are shown in Tab. 1.
Tab. 1: Simulation methods in the model
Phenomenon Equation or Method
Rainfall-Runoff
Exceed Rainfall SCS Method
Surface runoff Manning's EQ, Conservation EQ Sub-surface runoff Darcy's EQ, Conservation EQ Sediment Yield Soil Erosion Universal Soil Loss Equation
Landslide Unlimited Slope Theory
Sediment Transportation
Bed Load Meyer-Peter and Müller EQ Suspended Load Diffusion EQ
Wash Load Diffusion EQ
Debris flow Equilibrium Concentration
3 Results
3.1 Bare area trends
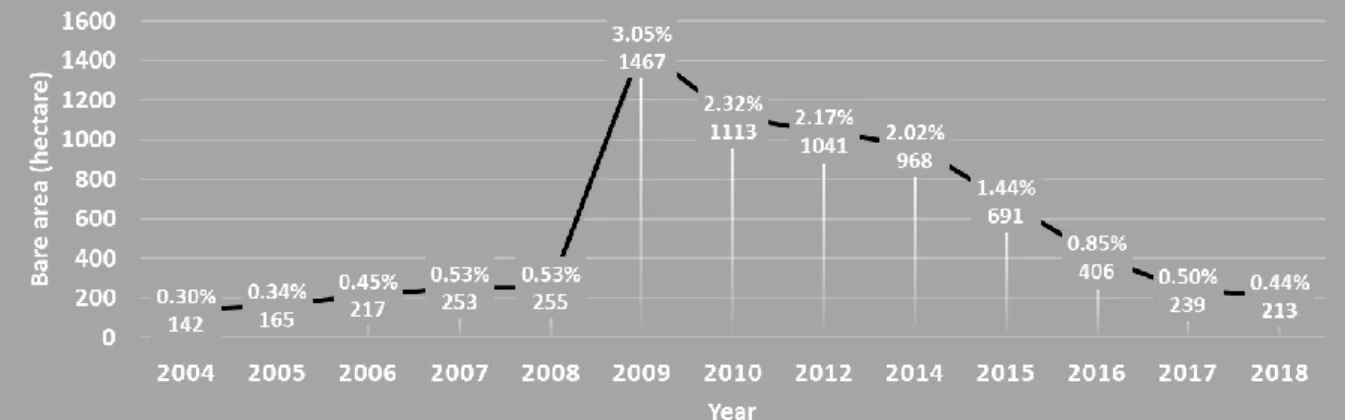
The result in Fig. 2 shows the changes of bare area in the watershed. The percentage shown in the figure is the bare area proportion of the watershed area. The bare area slowly increased from 2004 to 2008. It unexpectedly increased from 255 hectares to 1,467 hectares after Typhoon Morakot in 2009. Since then, the bare area decreased consistently. In 2018, the bare area was even less than in 2006.
There were 62 landslide areas which had been tracked since 2009 as shown in Fig. 3. The areas larger than five hectares decreased to seven in 2017, and then slightly increased to nine in 2018.
Fig. 2: Changes of bare area through time
Fig. 3: Tracked landslide areas larger than five hectares 3.2 Riverbed elevation
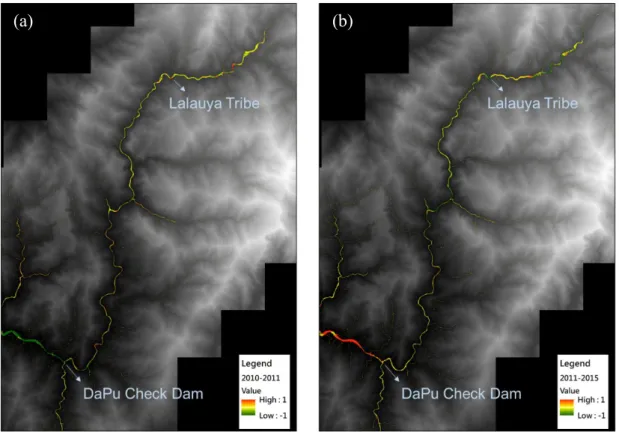
In order to find out the trends of sediment yield and transportation characteristics after Typhoon Morakot, DEMs in 2010-2015 were compared to each other. When dividing to two intervals of time, the best combination to show the variations is as shown in Fig. 4. The average increase and decrease in riverbed elevation per year are expressed in red and green. The deeper the color is, the larger the value is. At downstream side of DaPu Check Dam, the elevation was mostly decreasing before 2011. In contrast, it was mostly increasing after 2011. In the section between DaPu Check Dam and Lalauya Tribe, the proportions of red and green are likely the same in the left figure. The green portion obviously increased in the right one. At upstream side of Lalauya Tribe, the increase of green proportion in the right figure is even more significant.
Fig. 4: Riverbed elevation changes per year in (a) 2010-2011 and (b) 2011-2015
3.3 Sediment discharge trends
Fig. 5 shows the regression of data collected at the monitoring site each year. The length of each line expresses the data interval each year. Knowing that large events don’t happen every year, choosing an appropriate discharge to compare the data tends to reflect the variations in sediment transportation. The concentration was 35,809 ppm at discharge of 500 m3/s in 2011. It decreased to 8,889 ppm in 2018, which is much closer to the
concentration of 7,983 ppm in the past research in 2006.
Fig. 5: Regression of discharge versus suspended load concentration
3.4 Numerical simulation
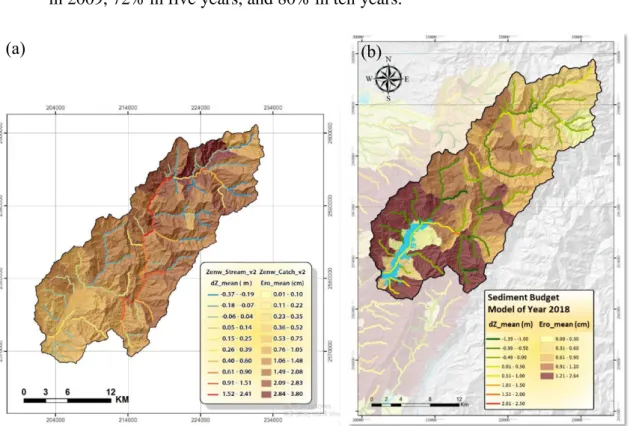
Fig. 6 shows the simulation results of the year 2011 and 2018. They represent the trend of simulations of the year 2010-2013 and 2014-2018. The focal points of the figure and other results are listed below..
The river section between DaPu Check Dam and Lalauya Tribe mostly deposited before 2013.
The average erosion depth on slopes exceeds 1.5 centimeter per year before 2013. The mainstream mostly eroded after 2013.
The proportions of deposits in the reservoir came from the mainstream was 65% in 2009, 72% in five years, and 80% in ten years.
Fig. 6: Simulation results of year (a) 2011 and (b) 2018
4 Discussion
4.1 Sediment yield from slopes
Due to the results in section 3.1, sediment yield from the slopes should decrease as the bare area decreased annually. This means the sediment supply in the upstream and side stream should also decrease. This change affected the sediment transport capacity in the riverbed, which led to the variation of erosion and deposit distribution.
4.2 Sediment yield and transportation on riverbed
In the section between DaPu Check Dam and Lalauya Tribe, the river is curved and more side streams converge. The curves result in energy loss of the stream, decreasing its velocity. Side streams are likely to cause backwater, which also directly affects the velocity of the mainstream. These provide a higher potential to “stuck” sediment. This phenomenon can be found in Fig. 4 (a) and Fig. 6 (a). Since sediment supply from upstream and side streams decreased, the phenomenon has weakened or vanished as shown in Fig. 4 (b) and Fig. 6 (b).
In the upstream side of Lalauya Tribe, erosion of riverbed should increase due to the decrease of sediment yield from slopes. The results in section 3.2 mostly meet the phenomenon, but there are some local effects caused by cracks or gaps of check dams. Site investigations were done in past projects. As the cracks or gaps enlarged over time, the sediment trapped by the check dams before Typhoon Morakot has been carried out gradually. This could be one of the possibilities leads to the difference between the simulation and fact.
The simulation is mainly to represent the sediment yield and transportation characteristics in long term. The DEMs showed similar phenomenon through time. Another evidence to support the simulation is the results of sediment discharge. Due to the recovery of the relation between water discharge and sediment concentration, it is likely to say unstable material caused by Typhoon Morakot has mostly been carried to downstream. The sediment yield and transportation characteristics in the ZengWen Reservoir Watershed are much closer to in the time before Typhoon Morakot.
5 Conclusions
After Typhoon Morakot, the environment changed severely. The increase of sediment yield from slopes and riverbed upstream side caused the variations of sediment transportation characteristics. This effect lasted significantly for 3-4 years. As the sediment yield decreased in the later years, the erosion in most sections of ZengWen River upstream the reservoir increased. Simulations were done consistently to speculate the trends of sediment yield and transportation characteristics, and they meet the fact generally. Since the sediment yield and transportation characteristics in ZengWen Reservoir Watershed keep changing due to mass reasons, this study will go on for distribution to ZengWen Reservoir.
References
Shieh C.L., Chen, Y.S., Lee, S.P., Tsai, Y.J., Lee, M.H. (2006). Sediment budget at Wushihkeng watershed after Chi-Chi earthquake. Disaster Mitigation of Debris Flows, Slope Failures and
Tsai, Y.J., Chen, Y.S., Lin, Y.J., Shieh, C.L. (2013). A Complex Sediment Yield and Transportation Model for Mountain Area. International Symposium on River Sedimentation, Kyoto, Japan. (conference paper)
Authors
Yu-Shiu Chen (corresponding Author) Chien-Yang Lin
Ping-Kun Lu Chun-Yi Wu
Disaster Prevention Research Center, National Cheng Kung University (NCKU), Taiwan
Southern Region Water Resources Office, Water Resources Agency (WRA), Ministry of Economic Affairs (MOEA), Taiwan