Kuo, Y. -F., (2004), Integrating Kano’s model into web-community service quality, Total Quality Management and Business Excellence, 15(7), pp. 925-939.
Integrating Kano’s model into Web-community service quality
Abstract
This study uses Kano’s two-way quality model to categorize Web-community service quality dimensions and their elements and understand the demands of users. The results show that in terms of overall samples, among the 29 service quality elements, 6 are attractive quality, 5 are one-dimensional quality, 11 are must-be quality, and 7 are indifferent quality. In the 6 service quality dimensions, there is 1 attractive quality, 2 one-dimensional quality, and 3 must-be quality. The satisfaction increment index and dissatisfaction decrement index of service quality of Web-community based on CQM (1993) quality index are also calculated in this study. Through these two indexes, we can find out the increment of satisfaction and decrement of dissatisfaction in analysis of improvement on certain quality element, and use the results as reference for future improvements on service provided to Web-community. The future research can incorporate Kano’s model with quality function deployment (QFD) to find out the demand of Web-community and its significance and prioritize the service items.
Key Words: Web community, service quality, Kano’s model
Introduction
Web-community is an online social organization formed by a group of people via e-communication (Romm et al., 1997). It is one of the most interesting developments and a key success factor in the digital economy (Balasubramanian & Mahajan, 2001; Lechner et al., 2002). People come together to Web-communities for business, idle gossip, spiritual exploration, psychological support, political action, intellectual discourse on all kinds of subjects – the entire range of human interests and needs (Anderson, 1999). Community sites provide an ideal platform for the focused groups to generate common content and meaning, social relationships, emotion, value and knowledge and share it among the members. A number of diverse businesses have created Web-communities of customers because they understand that these communities have the potential to establish a good relationship with the customers, increase the loyalty and the sense of belonging of the Web surfers, and collect their basic information. Web-community gathers the members who have the same interests and demands, it allows the enterprises to reduce the search costs and hold the attention of the potential consumers. As such a community could lead to great popularity and high repeated visiting rate, it is considered to be the best environment for target marketing.
In the market with fierce competition, rapid changes and customer-orientation, only effective delivery of service quality can enhance the corporate profit and competitiveness.
Thus, how to use service quality to enhance information system values becomes an important issue to information system businesses (Waston, et al., 1998). In other words, Internet and network companies need to realize the demand of users and provide appropriate service, in order to gain advantageous edge in the competition. However, while facing various demands, how to achieve customer satisfaction and prevent waste of unnecessary costs and resources is concerned by the company. Among explicit and implicit demand, companies should not only satisfy the explicit demand but also find out the implicit demand, so that customers can feel surprised in addition to satisfied.
The traditional one-way quality model is focused on one particular quality element; only when the element is present, then customers are satisfied, and vice versa. That is, the relationship between customer satisfaction and quality elements is treated as linear. However, the relationship is not as simple as linear. For some quality elements, customer satisfaction can be greatly improved with only a small improvement in performance; while for some other quality elements, customer satisfaction can only be improved a little even when the performance of the service has been greatly improved. Using the traditional way to improve customer satisfaction, possibly the customer will not be satisfied with a certain quality element or maybe the customer satisfaction target will be over-fulfilled (Tan & Shen, 2000). Therefore, understanding the service quality attributes in which category of two-way quality and determining appropriate actions is beneficial to improvement of service quality. This research is based on Kano’s quality model for Web-community quality dimensions and their elements categorization, and further provides suggestions to Internet administrators on service quality improvement.
Literature review
Service quality of information systems
The widely used definition of service quality is to meet customer expectations by Parasuraman, Zeithaml and Berry (1985). These researchers subsequently developed SERVQUAL scale (Parasuraman, Zeithaml & Berry, 1988). This scale has been used in measurement of information systems service quality recent years (Kettinger & Lee, 1994; Pitt,
et al., 1995; Myers, et al., 1997; Van Dyke, et al., 1997; Pitt, et al., 1997; Kettinger & Lee,
1997; Waston, et al., 1998). In the related studies concerning the Internet service quality, Weng (1999) proposed that the dimensions for examining the Internet database service quality include responsiveness, empathy, assurance, accessibility, content, reliability, and accuracy. Ong (2002) brought up the concept that the attributes for measuring the expected service quality of the Homepage manufactures includes responsiveness, assurance, reliable convenience, tangibility, price, and extra-service, while that for measuring the expected service quality of ISP (Internet service provider) include basic service, responsiveness assurance, empathy, and accessibility. Kuo (2003) constructs an instrument which is based on
SERVQUAL model to evaluate service quality of virtual community Websites. Results indicate that “on-line quality and information safety” is positively related to the overall service quality, customer satisfaction, and loyalty, but the service quality level of this dimension is the poorest. Furthermore, both the dimensions of “advertising mails management” and “customers service management” are also positively related to overall customer satisfaction and loyalty. The service quality level of “extra function and service” is the best, but this dimension does not have significant relationship with overall service quality, customer satisfaction, and loyalty. Moreover, Kettinger & Lee (1994) and Pitt et al. (1995) indicated that SERVQUL could be taken as the tool for measuring the service quality of information systems.
Kano’s model
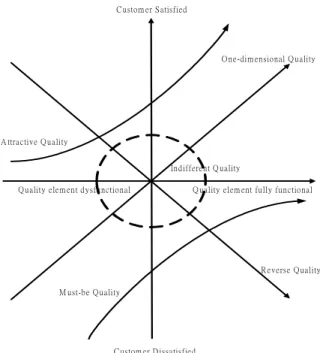
Kano (1979) develops “M-H property of quality” by adapting the work of Herzberg’s (1959) “Motivation-Hygiene Theory”. Further, Kano, et al. (1984) propose two-way model on quality (Fig. 1) based on customers’ perception and experience. The horizontal axis shows amount of quality element, right side is sufficient amount and the left side is insufficient amount. The vertical axis shows customer satisfaction; upper axis is high satisfaction and lower axis is low satisfaction.
Q uality elem ent dysfunctional Q uality elem ent fully functional C ustom er S atisfied
C ustom er D issatisfied
O ne-dim ensional Q uality
Indifferent Q uality
R everse Q uality A ttractive Q uality
M ust-be Q uality
Figure 1. Kano’s two-way model on quality (Kano, et al., 1984)
Based on the axes, the quality can be classified into the following 5 categories:
1. Attractive quality: when present, customers would be satisfied; yet when it is not present, customers would still accept without dissatisfaction. The corresponding element in
Herzberg’s theory is the motivator factor.
2. One-dimensional quality: when present, customers would be satisfied; it varies in intensity; more the quality, higher the level of satisfaction, and vice versa; yet when it is not present, customers would be dissatisfied.
3. Must-be quality: customers believe that this quality is a necessity; when it is not present, customers would be dissatisfied. The corresponding element in Herzberg’s theory is the hygiene factor.
4. Indifferent quality: customers would be indifferent whether the quality is present. 5. Reverse quality: when present, customers would be dissatisfied, and vice versa.
Understanding the category of the quality elements is beneficial in improving the quality management, can select different strategies for different quality and focus on priorities for product/service development. The goal is enhancing customer satisfaction and loyalty, and minimizes the dissatisfaction.
Two-way quality is initially used in development of manufactured product quality (Kano,
et al., 1984), on survey conducted on TV or decorative clocks. The survey result shows that
users’ conception of the quality is not one-dimensional but two-dimensional; thus, one-dimensional quality is unable to cover users’ quality conception. Schvaneveldt, Enkawa and Miyakawa (1991) apply Kano’s two-way quality model on bank, dry cleaning, restaurant, and supermarkets. They have found out that the five quality elements are different in the four industries. Matzler and Hinterhuber (1998) believe that Kano’s model can help business to understand the quality features that can satisfy customers, and locate customers of different segments according to the quality features. Zhang and von Dran (2002) use Kano’s model on Website design quality to induce navigation and impartiality as basic quality, and information content, privacy, visual appearance, technical support, organization of information content, credibility as performance quality, and cognitive outcomes and enjoyment as exciting quality. In addition, Kano’s model can be combined with quality function deployment (QFD) to find customers’ demand and the intensity (Shen, Tan & Xie, 2000; Tan & Shen, 2000).
Research methodology
The questionnaire
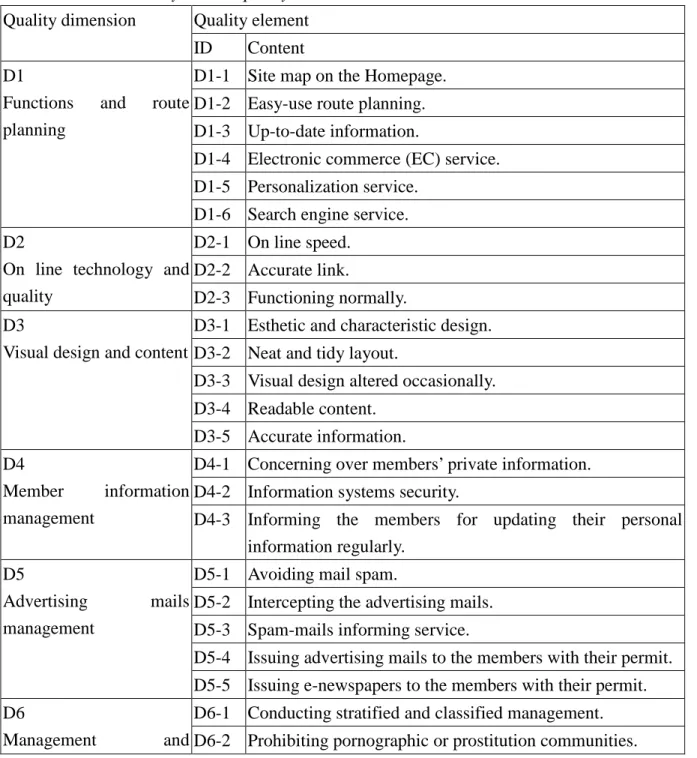
The questionnaire is designed based on Kuo’s (2003) evaluation instrument on Web-community service quality, and modified based on Kano’s two-way quality model. In an attempt to confirm the appropriateness of the questionnaire content, before the questionnaire investigation was executed, pilot test was given to 15 undergraduate and graduate students who were familiar with Web-community. After then, the questionnaire was modified and finalized for the formal investigation. The service quality dimensions and their elements of the examined Web-community are shown in Table 1. The questionnaire is divided into three parts. Part one and part two are the pairs of functional and dysfunctional questions for each
potential customer requirement. That is, the first question concerns the reaction of the customer if the service has that feature (functional form of the question); the second concerns the reaction if the service does not have that feature (dysfunctional form of the question). In examining the service quality requirement, users select their responses from one of five different ways: (1) I dislike it that way; (2) I can live with it that way; (3) I am neutral; (4) It must be that way; (5) I like it that way. In the last part, the users’ basic information and their use frequency and familiarity towards Internet and community Websites were investigated.
Table 1. Web-community service quality dimensions and their elements Quality dimension Quality element
ID Content D1
Functions and route planning
D1-1 Site map on the Homepage. D1-2 Easy-use route planning. D1-3 Up-to-date information.
D1-4 Electronic commerce (EC) service. D1-5 Personalization service.
D1-6 Search engine service. D2
On line technology and quality
D2-1 On line speed. D2-2 Accurate link.
D2-3 Functioning normally. D3
Visual design and content
D3-1 Esthetic and characteristic design. D3-2 Neat and tidy layout.
D3-3 Visual design altered occasionally. D3-4 Readable content.
D3-5 Accurate information. D4
Member information management
D4-1 Concerning over members’ private information. D4-2 Information systems security.
D4-3 Informing the members for updating their personal information regularly.
D5
Advertising mails management
D5-1 Avoiding mail spam.
D5-2 Intercepting the advertising mails. D5-3 Spam-mails informing service.
D5-4 Issuing advertising mails to the members with their permit. D5-5 Issuing e-newspapers to the members with their permit. D6
Management and
D6-1 Conducting stratified and classified management. D6-2 Prohibiting pornographic or prostitution communities.
customer service D6-3 Actively informing the members of the latest activities information.
D6-4 Has the professional knowledge in solving the Web-visitors’ problems.
D6-5 Answering the questions promptly.
D6-6 Holding regular investigation so as to have a further understanding of demands and satisfaction of the members. D6-7 Allowing the members to have a sense of belonging.
Research samples and data collection
According to 2001 Taiwan Internet users survey report (http://survey.yam.com/survey/2001/index.htm, 2002), it showed that 73% of the Internet users are under 30. Among these Internet users, 81% have an educational background above college. In terms of occupation, 40% of the users are students. Accordingly, it’s quite appropriate to take college student as the subject. Therefore, in this study, the college students in Taiwan are taken as the subjects. A total of 500 questionnaires were distributed to the students of three Taiwan major universities and 264 usable questionnaires were used in the analysis, representing a valid response rate was 52.8%.
Research results
Reliability analysis
To test the reliability of the instrument scale, we computed Cronbach’s α on each quality dimension. The Cronbach’s α values for each dimension ranged from 0.7336 to 0.8490. It shows that the scales are considerable reliability (Nunnally, 1978). Moreover, as the items of such questionnaire investigation are based on Kuo (2003), it shows that instrument is with content validity.
Sample characteristics
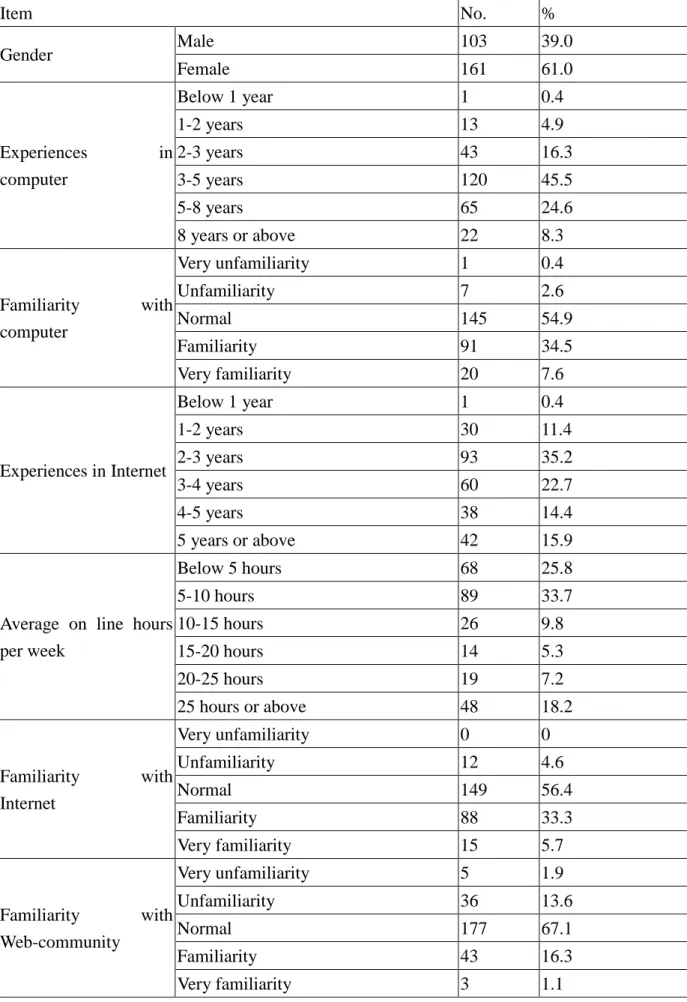
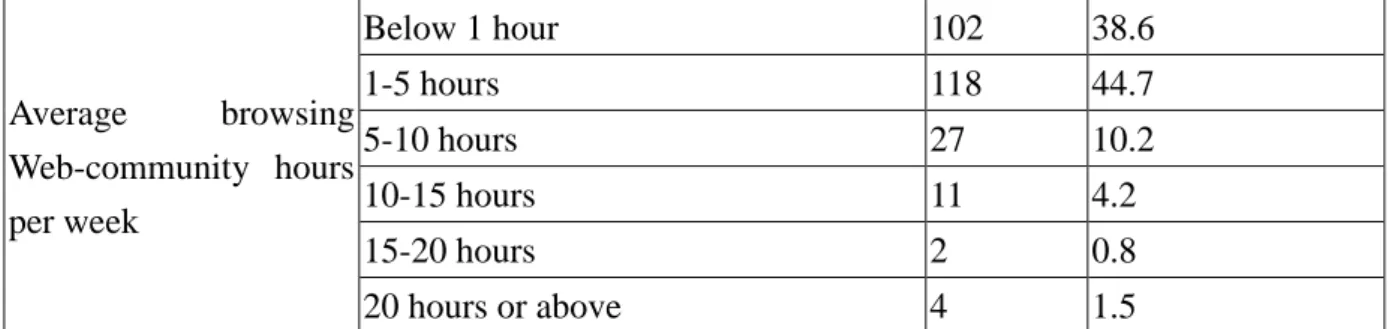
The respondent’s demographic characteristics are shown in Table 2. Table 2 shows that the college student whose familiarity with computer is or above “fair” reaches 97.0%; familiarity with Internet, 95.4%; familiarity with Web-community, 84.5%. In terms of average on-line hours, most of the college students surf the Internet for about/less than 10 hours per week (59.5%), and browse/use the Web-community for about/less than 5 hours per week (84.5%). Accordingly, the interviewees’ experiences in and familiarity with the computer and Internet have already reached a certain standard.
Table 2. Demographic characteristics of the sample Item No. % Gender Male 103 39.0 Female 161 61.0 Experiences in computer Below 1 year 1 0.4 1-2 years 13 4.9 2-3 years 43 16.3 3-5 years 120 45.5 5-8 years 65 24.6 8 years or above 22 8.3 Familiarity with computer Very unfamiliarity 1 0.4 Unfamiliarity 7 2.6 Normal 145 54.9 Familiarity 91 34.5 Very familiarity 20 7.6 Experiences in Internet Below 1 year 1 0.4 1-2 years 30 11.4 2-3 years 93 35.2 3-4 years 60 22.7 4-5 years 38 14.4 5 years or above 42 15.9
Average on line hours per week Below 5 hours 68 25.8 5-10 hours 89 33.7 10-15 hours 26 9.8 15-20 hours 14 5.3 20-25 hours 19 7.2 25 hours or above 48 18.2 Familiarity with Internet Very unfamiliarity 0 0 Unfamiliarity 12 4.6 Normal 149 56.4 Familiarity 88 33.3 Very familiarity 15 5.7 Familiarity with Web-community Very unfamiliarity 5 1.9 Unfamiliarity 36 13.6 Normal 177 67.1 Familiarity 43 16.3 Very familiarity 3 1.1
Average browsing Web-community hours per week Below 1 hour 102 38.6 1-5 hours 118 44.7 5-10 hours 27 10.2 10-15 hours 11 4.2 15-20 hours 2 0.8 20 hours or above 4 1.5
Analysis of two-way quality model
By combining the two answers in the Kano evaluation table (Table 3), the Web-community service quality features can be classified into one of the six categories: attractive quality (A), one-dimensional quality (O), must-be quality (M), indifferent quality (I), reverse quality (R) or questionable result (Q). If the customer answers, for example, “It must be that way” as regards “If the Web-community provides site map on the Homepage, how do you feel?” – the functional form of the question – and answers “I can live with it that way” as regards “If the Web-community does not provide site map on the Homepage, how do you feel?” – the dysfunctional form of the question – the combination of the questions in the evaluation table finds an “I”, indicating that site map on the Homepage is an indifferent customer requirement from the customer’s viewpoint. Category Q indicates that there is a contradiction in customer’s answers to the questions. For each quality element overall placement in this classification scheme is determined by the category having highest response frequency. To illustrate, a quality element which is judged most frequently by respondents to be one-dimensional, is placed in the one-dimensional category. If two or more Kano categories are tied for a given quality element, we consider selecting the classification that would have the greatest impact on the service (use the following ordering: M > O > A > I) (CQM, 1993).
Table 3 Kano evaluation table (Kano, et al., 1984) Customer Requirements Dysfunctional
Like Must-be Neutral Live with Dislike
Functional Like Q A A A O
Must-be R I I I M
Neutral R I I I M
Live with R I I I M
Dislike R R R R Q
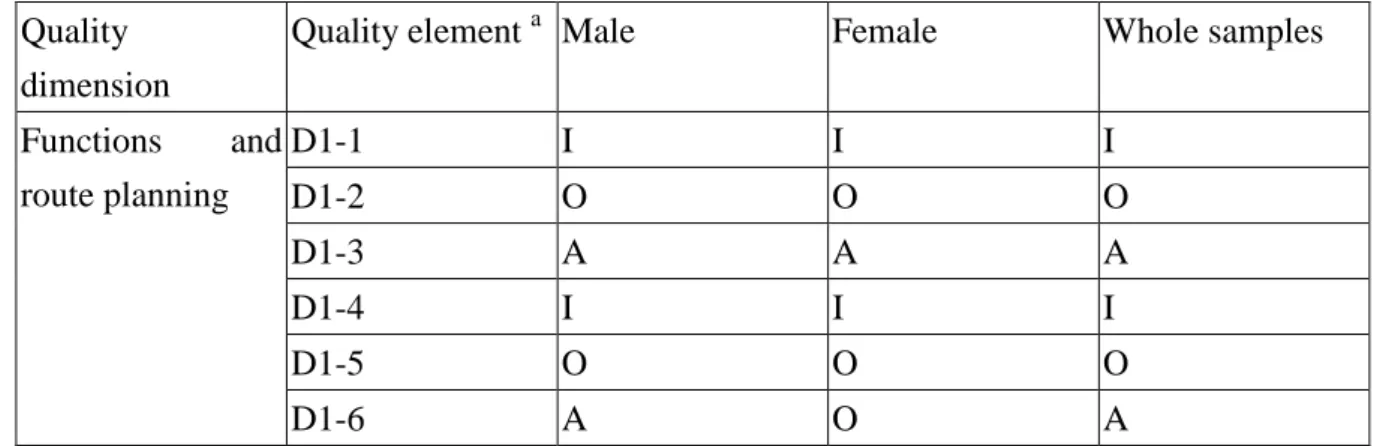
The community Website that differentiates based on gender difference is increasing, and customers have expressed different conception on the same quality element. Thus, this research categorized the quality elements and dimensions between users of different gender and all users based on Kano’s model, as shown in Table 4 and 5. In terms of overall samples, among the 29 service quality elements, 6 are attractive quality, 5 are one-dimensional quality, 11 are must-be quality, and 7 are indifferent quality. In the 6 service quality dimensions, there is 1 attractive quality, 2 one-dimensional quality, and 3 must-be quality, as explained below: 1. Attractive quality
To all users, “up-to-date information”, “search engine service”, “esthetic and characteristic design”, ”visual design altered occasionally”, “intercepting the advertising mails” and “spam-mails informing service” are attractive quality. In other words, if Web-community can provide daily news or topic reports, have search engine service, update the layout periodically for new looks, and block and report spamming, it would be more likely to attract and surprise customers. But to females, “search engine service” is one-dimensional quality; to males, “visual design altered occasionally” is one-dimensional quality. According to service quality dimension, “functions and route planning” is attractive quality. Thus, companies can use these elements to attract customers.
2. One-dimensional quality
To all users, “easy-use route planning”, “personalization service”, “on line speed”, “avoiding mail spam”, and “answering the questions promptly” are one-dimensional quality regardless of gender. In others, if the Website layout can allow users to surf conveniently without referring to sitemap, offer personalized service (such as email, album, Webpage space, personal setting), complete the connection within 10 seconds, avoid mail spam, and answer questions promptly, the Website would gain customer satisfaction. Greater the elements provided, greater the customer satisfaction, and vice versa. In terms of service quality dimension, “on line technology and quality” and “advertising mails management” are one-dimensional quality. But to females, “advertising mails management” is must-be quality. Thus, the Web-community companies should provide these elements extensively to increase customer satisfaction.
3. Must-be quality
To all uses, “accurate link”, “functioning normally”, “neat and tidy layout”, “readable content”, “accurate information”, “concerning over members’ private information”, “information systems security”, “issuing advertising mails to the members with their permit”, “issuing e-newspapers to the members with their permit”, “actively informing the members of the latest activities information”, and “has the professional knowledge in solving the Web-visitors’ problems” are must-be quality. But to males, “issuing advertising mails to the
members with their permit” is one-dimensional quality. In terms of service quality dimension, “visual design and content”, “member information management”, and “management and customer service” are must-be quality. If the elements cannot be provided extensively, customers would be dissatisfied.
4. Indifferent quality
To all users, “site map on the Homepage”, “EC service”, “informing the members for updating their personal information regularly”, “conducting stratified and classified management”, “prohibiting pornographic or prostitution communities”, “holding regular investigation so as to have a further understanding of demands and satisfaction of the members”, and “allowing the members to have a sense of belonging” are indifferent quality. But to females, “informing the members for updating their personal information regularly” and “prohibiting pornographic or prostitution communities” are must-be quality; to males, “allowing the members to have a sense of belonging” is one-dimensional quality. In terms of service quality dimension, there is no any dimension belongs to indifferent quality. Since customers are indifferent toward the elements, it is not necessary to focus on the quality.
Comparing the research results with Kuo’s (2003) study, Kuo indicates that the top five service quality elements are “information systems security”, “concerning over members’ private information”, “on line speed”, “functioning normally”, and “avoiding mail spam”; and the five last elements are “EC service”, “informing the members for updating their personal information regularly”, “sitemap on the homepage”, “spam-mails informing service”, and “prohibiting pornographic or prostitution community”. Among the top five elements in Kuo’s study, “information systems security”, “concerning over members’ private information”, and “functioning normally” are must-be quality; “on line speed” and “avoiding mail spam” are one-dimensional quality. That is, elements that users care about are either one-dimensional quality or must-be quality. Among the five last elements in Kuo’s study, only “spam-mails informing service” is an attractive quality; the rest are indifferent quality.
Table 4. Kano category for Web-community service quality elements between users of different
gender and all users
Quality dimension
Quality element a Male Female Whole samples
Functions and route planning D1-1 I I I D1-2 O O O D1-3 A A A D1-4 I I I D1-5 O O O D1-6 A O A
On line technology and quality D2-1 O O O D2-2 M M M D2-3 M M M
Visual design and content D3-1 A A A D3-2 M M M D3-3 O A A D3-4 M M M D3-5 M M M Member information management D4-1 M M M D4-2 M M M D4-3 I M I Advertising mails management D5-1 O O O D5-2 A A A D5-3 A A A D5-4 O M M D5-5 M M M Management and customer service D6-1 I I I D6-2 I M I D6-3 M M M D6-4 M M M D6-5 O O O D6-6 I I I D6-7 O I I a
: The names of quality elements are listed in Table 1.
A: Attractive, O: One-dimensional, M: Must-be, I: Indifferent, R: Reverse, Q: Questionable
Table 5. Kano category for Web-community service quality dimensions between users of
different gender and all users
Quality dimension Male Female Whole samples
Functions and route planning A A A
On line technology and quality O O O
Visual design and content M M M
Member information management M M M
Advertising mails management O M O
Management and customer service I M M
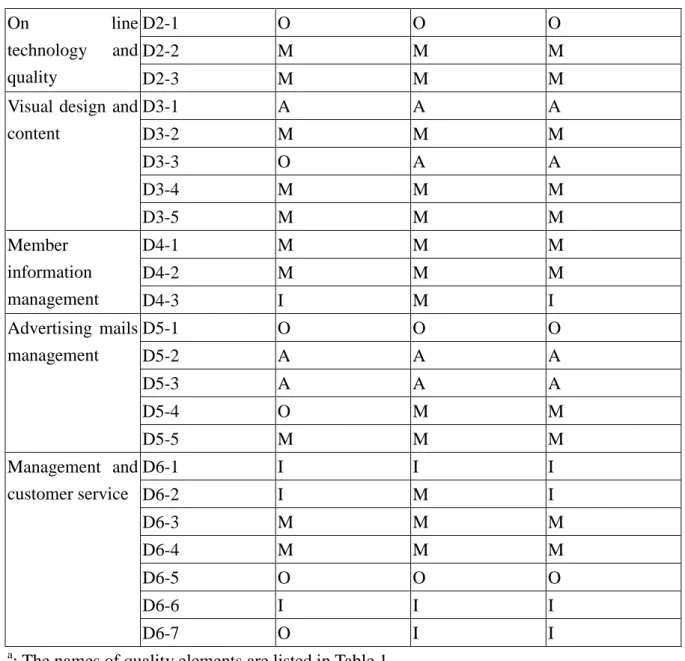
Analysis of customer satisfaction index
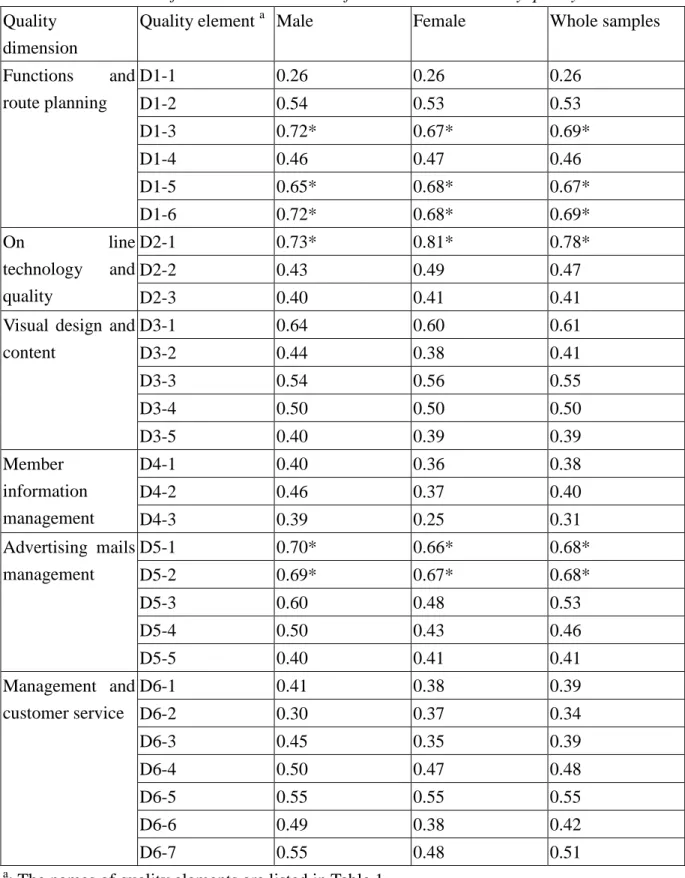
The customer satisfaction index states whether satisfaction can be increased by providing quality elements, or whether fulfilling quality elements only prevents the customer from being dissatisfied. Based on satisfaction increment index (SII) and dissatisfaction decrement index (DDI), we can find out which quality element can result in maximum outcome. According to CQM (1993), the SII can be measured by attractive quality ratio plus one-dimensional quality ratio; the DDI is one-dimensional quality ratio plus must-be quality ratio. A minus sign is put in front of the DDI to emphasize its negative influence on customer satisfaction if this quality element is not fulfilled.
SII = (A+O)/(A+O+M+I) (1) DDI = -(O+M)/(A+O+M+I) (2) While reading SII and DDI, if the value is close to 0, it means that the effect is low. When it is close to 1, it means that the element has positive effect on increase customer satisfaction; when it is close to -1, it means that the element can decrease customer dissatisfaction. Based on these two indexes, we can find out which elements can influence customer satisfaction, and elements with intensive influences are the places we should pay attention to.
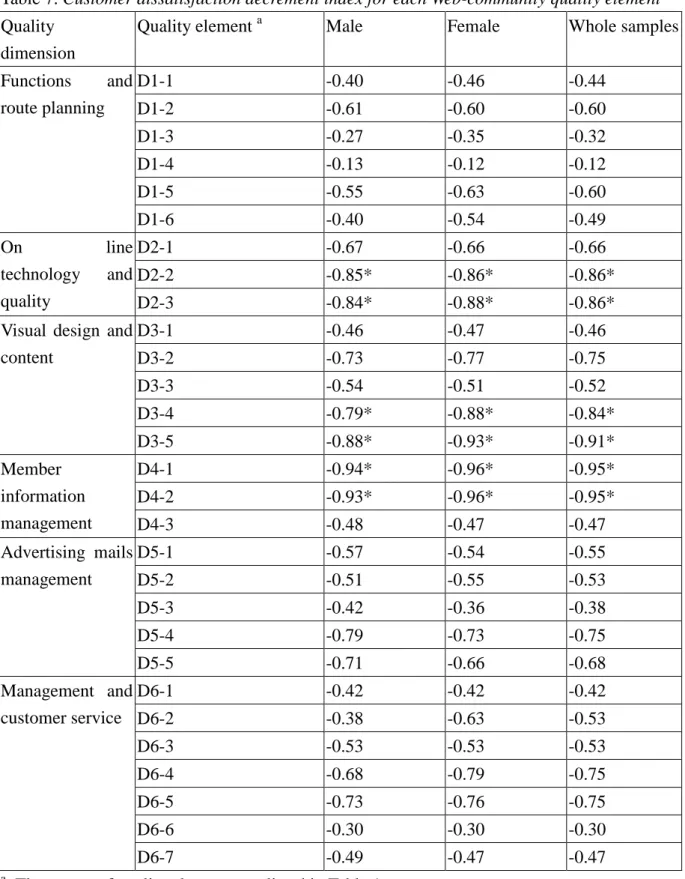
This research has calculated the SII and DDI of service quality of Web-community based on CQM (1993) quality index, as shown in Table 6 to 9. Table 6 shows that if improvements are provided on “on line speed”, “search engine service”, “up-to-date information”, “avoiding mail spam”, “intercepting the advertising mails” and “personalization service”, the increment in customer satisfaction would be the greatest. Table 7 shows that if improvements are provided on “concerning over members’ private information”, “information systems security”, “accurate information”, “functioning normally”, “accurate link”, and “readable content” (especially for females), they can best minimize customer dissatisfaction.
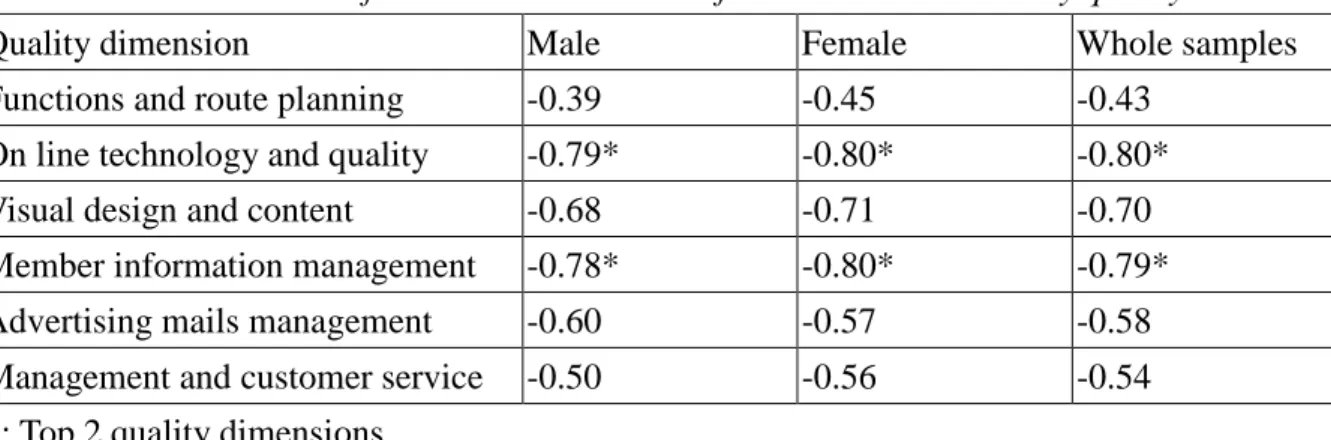
In terms of service quality dimension, Table 8 shows that if improvements are provided on “advertising mails management” and “functions and route planning”, the increment in male customers’ satisfaction would be the greatest. If improvements are provided on “on line technology and quality” and “functions and route planning”, the increment in female customers’ satisfaction would be the greatest. If improvements are provided on “functions and route planning”, “on line technology and quality” and ”advertising mails management”, they can increase overall customer satisfaction. Table 9 shows that if improvements are provided on “on line technology and quality”, “member information management” and “visual design and content”, they can best minimize customer dissatisfaction.
Through the above method, we can find out the increment of satisfaction and decrement of dissatisfaction in analysis of improvement on certain quality element, and use the results as reference for future improvements on service provided to Web-community. This method has provided a different perspective. If the important issues can be weighted and monthly surveys
can be conducts, it would be beneficial to improvement of service quality.
Table 6. Customer satisfaction increment index for each Web-community quality element Quality
dimension
Quality element a Male Female Whole samples
Functions and route planning D1-1 0.26 0.26 0.26 D1-2 0.54 0.53 0.53 D1-3 0.72* 0.67* 0.69* D1-4 0.46 0.47 0.46 D1-5 0.65* 0.68* 0.67* D1-6 0.72* 0.68* 0.69* On line technology and quality D2-1 0.73* 0.81* 0.78* D2-2 0.43 0.49 0.47 D2-3 0.40 0.41 0.41
Visual design and content D3-1 0.64 0.60 0.61 D3-2 0.44 0.38 0.41 D3-3 0.54 0.56 0.55 D3-4 0.50 0.50 0.50 D3-5 0.40 0.39 0.39 Member information management D4-1 0.40 0.36 0.38 D4-2 0.46 0.37 0.40 D4-3 0.39 0.25 0.31 Advertising mails management D5-1 0.70* 0.66* 0.68* D5-2 0.69* 0.67* 0.68* D5-3 0.60 0.48 0.53 D5-4 0.50 0.43 0.46 D5-5 0.40 0.41 0.41 Management and customer service D6-1 0.41 0.38 0.39 D6-2 0.30 0.37 0.34 D6-3 0.45 0.35 0.39 D6-4 0.50 0.47 0.48 D6-5 0.55 0.55 0.55 D6-6 0.49 0.38 0.42 D6-7 0.55 0.48 0.51 a
: The names of quality elements are listed in Table 1. *: Top 6 quality elements.
Table 7. Customer dissatisfaction decrement index for each Web-community quality element Quality
dimension
Quality element a Male Female Whole samples
Functions and route planning D1-1 -0.40 -0.46 -0.44 D1-2 -0.61 -0.60 -0.60 D1-3 -0.27 -0.35 -0.32 D1-4 -0.13 -0.12 -0.12 D1-5 -0.55 -0.63 -0.60 D1-6 -0.40 -0.54 -0.49 On line technology and quality D2-1 -0.67 -0.66 -0.66 D2-2 -0.85* -0.86* -0.86* D2-3 -0.84* -0.88* -0.86*
Visual design and content D3-1 -0.46 -0.47 -0.46 D3-2 -0.73 -0.77 -0.75 D3-3 -0.54 -0.51 -0.52 D3-4 -0.79* -0.88* -0.84* D3-5 -0.88* -0.93* -0.91* Member information management D4-1 -0.94* -0.96* -0.95* D4-2 -0.93* -0.96* -0.95* D4-3 -0.48 -0.47 -0.47 Advertising mails management D5-1 -0.57 -0.54 -0.55 D5-2 -0.51 -0.55 -0.53 D5-3 -0.42 -0.36 -0.38 D5-4 -0.79 -0.73 -0.75 D5-5 -0.71 -0.66 -0.68 Management and customer service D6-1 -0.42 -0.42 -0.42 D6-2 -0.38 -0.63 -0.53 D6-3 -0.53 -0.53 -0.53 D6-4 -0.68 -0.79 -0.75 D6-5 -0.73 -0.76 -0.75 D6-6 -0.30 -0.30 -0.30 D6-7 -0.49 -0.47 -0.47 a
: The names of quality elements are listed in Table 1. *: Top 6 quality elements.
Table 8. Customer satisfaction increment index for each Web-community quality dimension
Quality dimension Male Female Whole samples
Functions and route planning 0.56* 0.55** 0.55***
On line technology and quality 0.52 0.57** 0.55***
Visual design and content 0.50 0.48 0.49
Member information management 0.41 0.33 0.36
Advertising mails management 0.58* 0.53 0.55***
Management and customer service 0.47 0.43 0.44
*: Top 2 quality dimensions for males. **: Top 2 quality dimensions for females. ***: Top 3 quality dimensions for all users.
Table 9. Customer dissatisfaction decrement index for each Web-community quality dimension
Quality dimension Male Female Whole samples
Functions and route planning -0.39 -0.45 -0.43
On line technology and quality -0.79* -0.80* -0.80*
Visual design and content -0.68 -0.71 -0.70
Member information management -0.78* -0.80* -0.79*
Advertising mails management -0.60 -0.57 -0.58
Management and customer service -0.50 -0.56 -0.54
*: Top 2 quality dimensions.
Conclusion
This research uses Kano’s two-way model to discuss the evaluation of Web-community service quality and understands the demands of users. The results can be used to identify attractive quality, one-dimensional quality, must-be quality, indifferent quality, and reverse quality of quality elements, while taking into consideration of cost and technology, in order to find key to customer satisfaction. In general, companies would often fall into the trap of ‘no complaint’ is satisfaction. Thus two-way quality model can find out the attributes of the elements, and also identify the customer satisfaction increment index and customer dissatisfaction decrement index. Diminishing the dissatisfaction only prevents customer loss, but unable to create loyal and joyful customers. No complaints might mean that customers have no idea of better service and choices, instead of they are satisfied or joyful. Thus, the attractive quality can soon turn into must-be quality. As time passes, quality elements would turn into one-dimensional quality from attractive quality, then into must-be quality. The purpose of two-way model can further help to determine proper actions and develop products with attractive quality. Of course, must-be quality or one-dimensional quality products will
soon be replaced in time. The future research can incorporate Kano’s model with QFD to find out the demand of Web-community and its significance and prioritize the service items.
References
Anderson, W.T. (1999) Communities in a world of open systems, Futures, 31, pp. 457-463. Balasubramanian, S. & Mahajan, V. (2001) The economic leverage of the virtual community, International Journal of Electronic Commerce, 5, pp.103-138.
CQM, (1993) A special issues on Kano’s methods for understanding customer-defined quality, Center for Quality Management Journal, 2, pp.3-35.
Herzberg, F., Mausner, B., & Snyderman, B.B. (1959) The Motivation to Work (New York, NY, John Wiley & Sons).
Kano, N. (1979) On M-H property of quality, Nippon QC Gakka: 9th Annual Presentation Meeting, Japan, pp. 21-26.
Kano, N., Seraku, N., Takahashi, F., & Tsuji, S. (1984) Attractive quality and must-be quality, Journal of Japanese Society for Quality Control, 14, pp.39-48.
Kettinger, W.J. & Lee, C.C. (1994) Perceived service quality and user satisfaction with the information services function, Decision Sciences, 25, pp. 737-766.
Kettinger, W.J. & Lee, C.C. (1997) Pragmatic perspectives on the measurement of information systems service quality, MIS Quarterly, 21, pp. 223-240.
Kuo, Y.F. (2003) A study on service quality of virtual community Web sites, Total Quality Management, 14, pp. 461-473.
Lechner, U., Stanoevska-Slabeva, K. & Tan, Y. H. (2002) Introduction to special issue: communities in the digital economy, International Journal of Electronic Commerce, 6, pp. 5-7. Matzler, K. & Hinterhuber H.H. (1998) How to make product development projects more successful by integrating Kano’s model of customer satisfaction into quality function deployment, Technovation, 18, pp.25-38.
Myers, B.L., Kappelman, L.A. & Prybutok, V.R. (1997) A comprehensive model for assessing the quality and productivity of the information systems function: Toward a theory for information systems assessment, Information Resources Management Journal, 10, pp. 6-25. Nunnally, J.C. (1978) Psychometric Theory (New York, NY, McGraw-Hill).
Ong, C.S. (2000) A study on the consumer’s expectations of the Internet,” Journal of Information Management, 5, pp.51-73.
Parasuraman, A., Zeithaml, V.A. & Berry, L.L. (1985) A conceptual model of service quality and its implications for future research, Journal of Marketing, 49, pp. 41-50.
Parasuraman, A., Zeithaml, V.A. & Berry, L.L. (1988) SERVQUAL: a multi-item scale for measuring consumer perceptions for service quality, Journal of Retailing, 64, pp. 12-40. Pitt, L.F., Watson, R.T. & Kavan, C.B. (1995) Service Quality: A measure of information system effectiveness, MIS Quarterly, 19, pp. 173-188.
Pitt, L.F., Watson, R.T. & Kavan, C.B. (1997) Measuring Information Systems Service Quality: Concerns for a Complete Canvas, MIS Quarterly, 21, pp. 209-221.
Romm, C., Pliskin, N. & Clarke, R. (1997) Virtual communities and society: Toward an integrative three phase model, International Journal of Information Management, 17, pp. 261-270.
Schvaneveldt, S.J., Enkawa, T. and Miyakawa, M. (1991) Consumer evaluation perspectives of service quality: evaluation factors and two-way model of quality, Total Quality Management, 2, pp.149-161.
Shen, X.X., Tan, K.C., & Xie, M. (2000) An integrated approach to innovative product development using Kano’s model and QFD, European Journal of Innovation Management, 3, pp. 91-99.
Tan, K.C. & Shen X.X. (2000) Integrating Kano’s model in the planning matrix of quality function deployment, Total Quality Management, 11, pp. 1141-1151.
Van Dyke, T.P., Kappelman, L.A. & Prybutok, V.R. (1997) Measuring information systems service quality: Concerns on the use of the SERVQUAL questionnaire, MIS Quarterly, 21, pp. 195-208.
Waston, R.T., Pitt, L.F. & Kavan, C.B. (1998) Measuring information systems service quality: Lessons from two longitudinal case studies, MIS Quarterly, 22, pp. 61-79.
Weng, T.H. (1999) A study on service quality of Internet online service: securities online database an example, Unpublished Master Thesis, National Taiwan University, Taiwan.
Zhang P. & von Dran, G.M. (2002) User expectations and rankings of quality factors in different Web site domains, International Journal of Electronic Commerce, 6, pp. 9-33.