An Anomaly Intrusion Detection on Database Operation by Fuzzy ART Neural Network
6
0
0
全文
(2) Int. Computer Symposium, Dec. 15-17, 2004, Taipei, Taiwan.. 2. Related work. classifications of intrusion detection methods are shown as follows.. The concept of intrusion detection is published on James P. Anderson 1980’s reports[3]. Afterward, many definitions about intrusion were reported. For example, Gaham[4] defined the intrusion is “An intrusion is somebody, hackers or crackers, attempting to break into or misuse your system. The intrusion detection system is to find the intruder using any method to protect the computer system.” Based on the concept, the types of intrusion detection system can be classified by techniques[1] and detection methods.. (a.) Statistic Analysis In statistic analysis method[6], the intrusion detection system will record the status of computer general behavior and the frequency of operation, and then the system infer whether the user’s actions are legal or not by statistic information. (b.) Neural Network The intrusion detection system can be built by a neural network model so that it could be quickly computing[7]. Whether using the supervised learning network or unsupervised learning network, all the intrusion detections can be applied to misuse or anomaly method but how to select a good network model and how to select feature are challenges. 2.1 The classification of intrusion detection system by techniques The technique of intrusion detection system is to detect the feature change or to compare the profile of user general activity[5]. The intrusion detection includes three modes:. (c.) Rule-Based Analysis The computer security expert created the rules of the computer safe or unsafe operations[8]. The intrusion detection system judges the user profile through the rule base. The expression of rule base includes positive expression and negative expression. The weak of rules processing is rule matching is time consume.. (a.) Misuse intrusion detection The detecting method finds the feature that expert predefined. The advantage of misuse intrusion detection is fast detecting and lowly error rate but the weakness is while the feature not previously defined, the system unable to find the intrusion.. (d.) Bayesian Network Using Bayesian network to display the probability of events and behavior[9], the intrusion detection system judges the behaviors by Bayesian network. The key points are the distribution of probability of events and feature. If the feature unable to be expressed by the probability, it is not suitable. If the intrusion detection system applies the Bayesian network, it can inference the anomaly detection function.. (b.) Anomaly intrusion detection The detecting system will build the users’ profile model on the user general activity. The anomaly intrusion action is defined that users’ behaviors exceed the profile module. The good quality of the anomaly intrusion detection is that it can find new intrusion action but it weaknesses are to build profile module will waste time and the error rate of intrusion detection is high.. (e.) Finite State Machine. (c.) Hybrid and mixed intrusion detection system. The system operations can be expressed as the state by finite state machines[10]. Experts can define the transfer condition of the intrusion. The method’s bottleneck is how to set the transfer condition. (f.) Data Mining The association rules of mining techniques are also applied in intrusion detection[11]. The intrusion detection system uses the feature of fields to construct association rules, such as the connection time of user, the IP address, the called or calling program etc. First, the system finds the key point record from the network behavior record, and then mining by the association rules, it can be applied to the intrusion detection system. The weakness of data mining method is how to select important data and how to set the threshold value are still hard problems.. The method mixes both of the misuse and anomaly methods. For explicit intrusions, the misuse method is used to detect intrusion; moreover, the other intrusions the anomaly method is used to detect intrusion. Appling the hybrid method, the major detecting method must be selected even misuse or anomaly intrusion detection. The advantage of hybrid method is high correcting detection rate but the cost and detection time are higher than using misuse or anomaly only.. 2.2. The intrusion detection system was classified by detection method From the technological views, the intrusion detection is one of information classification problems. Scilicet, the method of classification can be applied to the intrusion detection. Several. 840.
(3) Int. Computer Symposium, Dec. 15-17, 2004, Taipei, Taiwan.. 3. Fuzzy ART. numbers between 0 and 1. The corresponding value of output unit “j” is described in formula (1).. In the paper, a fuzzy ART, Adaptive Resonance Theory [12][13], neural network is used to detecting anomaly Intrusion of database operation. It is an unsupervised learning method. The input value of ART is binary but the ART-2 the input values is the real values between 0 and 1. ART-2 Network is used in our system. The theory of ART is from the cognition. First, the network gets the training sample from research domain, and then the network will learn to form the inside clustering rule. After the training phrase, the network can classify the new example. If the example is not included at existing clusters, the network will generate a new cluster. The operation of ART is similar to people brain neural system. Not only learns the new example, but also reserves the old memory cells. The ART has both feature of stability and plasticity.. corresponding value : net[j] = ∑ W b [i][ j ] × X [i] − −(1) i. The weighted value of output-to-input is Wt. The values of Wt are used to calculate the similar value of the input vector of trained examples connected one unit of output layer. The similar value decided the test that an output unit is tested by vigilance value. The values of Wt are real numbers between 0 and 1. The formula of similar value of output unit j is described as follows (2). Similar value : Vj =. W jt × X X. =. ∑W i. t. [i ][ j ] × X [i ]. ∑ X [i]. − − − − − − ( 2). The relation of Wt and Wb is listed in formula (3). W. In order to solve the antinomy of stability and plasticity, the ART network will adjust the vigilance value. The method of controlling vigilance test values is described as follows.. b ij. =. W 0 .5 +. t ij. ∑. W. t ij. − − − − − − − − − − − − − (3). The ART network operates the vigilance test based on the corresponding values. It does vigilance test for each output unit from one with maximum corresponding value to the minimum corresponding value with. In ART network, if the output layer unit has high corresponding value, it will have high similar value, too. In ART network, the number of output layer units will be affected by the vigilance test values. The higher vigilance value dues to the number of output units incremental. The vigilance value also controls the stability and plasticity of ART network. The higher vigilance value the higher plasticity is; furthermore, the ART network will increase the number of clusters. On other hand, the lower vigilance value will lead to clusters less.. (a.) When the feature of new example is similar to existing clusters, the vigilance test is passed. The network modified the memory cells of the existing cluster, let the network can recognize the existing example and new example so that the stability is filled. (b.) IF the feature of new example is not similar to existing clusters, the vigilance test is not passed. The system creates the new memory cells for the new example. The system meets the plasticity it can learn new examples quickly. The architecture of ART can be divided three parts which are described as follows. (a.) Input layer: The input data is training examples. The number of input vectors is decided by question domain.. 4. The database intrusion detection In this paper, the processing data, database connection information, got from land office of Taichung city in Taiwan. First, the log file of connection records were extracted from database on server side which would record the client sides connection information. And then, the connection record transfer into numerical data. Finally, all numerical data mapped to the range from 0 to 1 by linear function requested for the input of neural network of ART-2. The fuzzy art model was created on MATLAB software. On the neural model, first, the numerical data was put into the input vector of the neural network. Second, the vigilance value and the learning rate were set. And then, the clustering results about the connection records were gotten. Finally, the system will modify the vigilance value and learning rate to get a better clustering result. The. (b.) Output layer: It presents the result of trained network. The number of output units was increased by the training epoches. The training is ended when the output units are stably fixed in a steady number. (c.) Weight connections: It connected the input layer and output layer. Every connection is connected between the input unit and the output unit has two direction links. The input and output units are fully connections. The two link directions, input units to output units and output units to input units, have different meaning. The link of input-to-output is Wb. The values of Wb can be used to calculate the value from input vector to one of unit of output layer. The output unit has max corresponding value will be used for vigilance test. The values of Wb are real. 841.
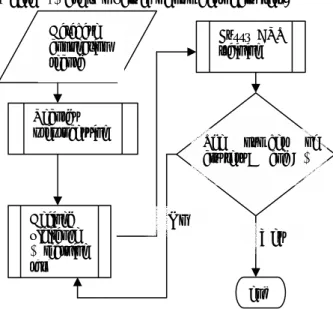
(4) Int. Computer Symposium, Dec. 15-17, 2004, Taipei, Taiwan.. phrase of experimentation is described as Figure 2 where α, β are two values of number of clusters. Database connection record. The time stamp of this connection record is at the 14:16:21 on May 10,1995. The client computer name is “WINDOWSPC”. This connection is connected to the reltest database. The user who login the client computer is CCLOW and the user used PLUS31.EXE program. The used network protocol was TCP with port 3366. The network address of the client computer is 144.25.23.246. The result of this connection is success. We can get information form connection record as Table 1.. Fuzzy ART training. Records preprocessing. Defined vigilance & learning rate. *(ADDRESS=(PROTOCOL=tcp)(HOST=144.25. 23.246)(PORT=3366)) *establish*reltest*0”. The number of clusters > α and < β. No Yes. Table1 the analysis table of connection record No Item Name Data Content 1 Time Stamp 10-MAY-95 14:16:21 2 User Name CCLOW 3 Client computer WINDOWSPC Name 4 SID Reltest 5 Program name PLUS31.EXE 6 Network address 144.25.23.246 7 Network protocol TCP. end. Figure 2 The system architecture The database on server side in our experiment is Oracle version 7. The format of connection record[14] is given as follows. TIMESTAMP*CONNECT DATA. In our experiment did not use DHCP protocol. The network address was selected to district the client computers. Furthermore, the system uses time stamp, user name, database name, the network address of client computer, program name and network protocol as feature and then they were input into the ART network after they were transferred to numerical values. Finally, the Fuzzy ART neural network did the clustering work to find anomaly intrusion operations. The methods of transform the text feature to values are described as follows. (a.) For two holidays in every week, the basic connection record uses week as unit. The connection time formula as: Tc = The number of day in a week D1(day)+ Connection Time T1(hours) + Connection Time T2(minutes) The value of timestamp is gotten as following formula.. [* PROTOCOL INFO] *EVENT [*SID]*RETURN CODE The data of connection record can be divided into several fields. (a.) TIMESTAMP: It records the time that client computer connected to the database server. (b.) CONNECT DATA: It includes the detail information of client compute. For example, the user name of login, the used program that connected to database server, and machine name of client computer etc. (c.) PROTOCOL INFO: It records the network protocol used in the connection. If this time used the TCP network protocol, the information would include the network address. (d.) Event: It records why to build this connection? In many cases, it is to build the connection for database but sometimes it may start or stop the listener program.. FTc =. (e.) SID: It indicates which database was used.. Tc × 24 × 60 + T 1 × 60 + T 2 7 × 24 × 60. (b.) The maximum number of user names (Un), program names (Pn) network protocols (Nn) and SID(Sn) will be represented as St, and then the four types of feature will be extracted by the following formulas. St = Max(the number of Un Pn Nn Sn). (f.) RETURN CODE: The return code is 0 if the connection is success. An example of a connection record is specified. “10-MAY-95 14:16:21* (CONNECT_DATA=(SID= reltest) (CID= (PROGRAM=C:\ORAWIN\BIN\PLUS31.EXE) (HOST=WINDOWSPC)(USER=CCLOW)). 842.
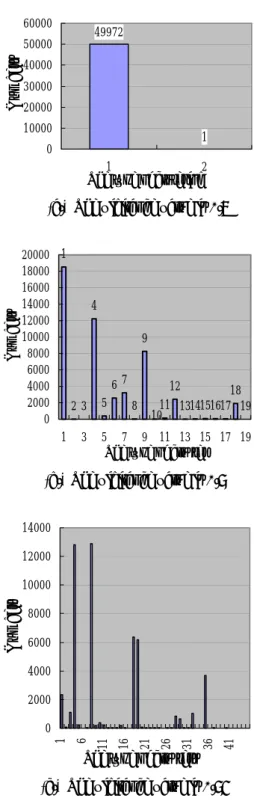
(5) Int. Computer Symposium, Dec. 15-17, 2004, Taipei, Taiwan.. FUn =. 1 × Un St. 60000. 49972. F Pn =. Numbers. 50000. 1 × Pn St. 40000 30000 20000 10000. 1 = × Nn St. F Nn. F Sn =. 1. 0 1. 2. The type of clutering. (a.) The vigilance value is 0.7. 1 × Sn St. Numbers. (c) The connections data of land office are an enterprise local network. We select the right most two decimal number of network address as feature. For example, an IP address is represented as A.B.C.D., and then the feature is gotten by the following formula.. FIP = [C × 255 + D]/(255 × 255 + 255). 20000 1 18000 16000 14000 4 12000 10000 9 8000 6000 67 12 4000 18 2000 5 11 8 23 1314151617 19 10 0 1. 5. Experiment. 3. 5. 7. 9 11 13 15 17 19. The type of cluster. The data sources in the experiments were extracted from a land office, collecting during the days of 2004/02/28 to 2004/04/02. After filtering fail connection records, 49973 records were used to test during the experiments. Figure 3 shows the different learning rate and. (b.) The vigilance value is 0.9 14000 12000. vigilance value clustering results. The mean of A3NET7 in Figure 3 stands for learning rate is 0.3 and vigilance value is 0.7. While result of the vigilance value has max. Numbers. 10000. impact, the learning rate only had minimum impact. Finally, the learning rate is set to 0.5 in the experiment. For different vigilance values, the number of clustering and the number of records of each cluster are drawn in Figure 4.. 8000 6000 4000 2000. 41. 36. 31. 26. 21. 16. 6. 1. 11. 50 45 40 35 30 25 20 15 10 5 0. The type of clusters. 42. (c.) The vigilance value is 0.95 19. 18. 2. From the clustering diagram of different vigilance values, found that more number of connection records distributed in a few clusters while vigilance value is 0.9 or 0.95. If the threshold, the number of record in a cluster, is less than 100, only 310 records are remainders from the 49973 records while vigilance value is 0.9. Likewise, 839 records are remainders while vigilance is 0.95. The system manager only needs to trace the remainder records and to analyze whether the. A3 NE T. A3 NE T. 2. Figure 4 the scattered diagram on different vigilance value. 16. 95 A5 NE T9 A7 NE T7 A7 NE T9 5. 2. 7. Clustering number. 0. 47. 46. The name of neural network. Figure 3 The different learning rate and vigilance value clustering results. 843.
(6) Int. Computer Symposium, Dec. 15-17, 2004, Taipei, Taiwan.. database connection is safe or not. The reducing rate is 0.006 or 0.016. It is a real advantage for system manger. Furthermore, we can find out the importance of feature are network address, user name, program name, and time stamp. It is an important guide for developing database intrusion detection system when using in misuse mode. From the experiment results, we could find few programs seem never connected database. After tracing the connection records, the system manger found the program was developed by outsourcing company. It can illustrate the method of an anomaly intrusion detection on database operation by Fuzzy ART is efficient.. behavior,” Computers & Security, no. 7, vol. 22, pp. 596-512, 2003 [6]Nong Ye, Xiangyang Li, Qiang Chen, Syed Masum Emran, and Mingming Xu. “Probabilistic Techniques for Intrusion Detection Based on Computer Audit Data,” IEEE Transactions On System, Man, And Cybernetics, vol. 31,no. 4,JULY 2001. [7]Peter Lichodzjewski,Nur Zincir-HEYwood, alcolm L. Hcywod. ”Host-Based Intrusion Detection Using Self-Organizing Maps,” IJCNN vol. 2, pp. 1714-1719. 2002 [8]Ilgun, K.; Kemmerer, R.A.; Porras, P.A. “State transition analysis: a rule-based intrusion detection approach,” IEEE Transactions on Software Engineering ,issue 3, vol. 21, pp. 181-199,March 1995 [9]Daniel J. Burroughs,Linda F. Wilson and George V. Cybenko.“Analysis of Distributed Intrusion Detection Systems Using Bayesian Methods,” IEEE International 21st conference Performance, Computing, and Communications Conference,pp 329 – 334, 2002 [10] Bo Gao; Hui-Ye Ma; Yu-Hang Yang. “HMMs (Hidden Markov models) based on anomaly intrusion detection method,” International Conference Machine Learning and Cybernetics Proceedings. vol 1 ,pp:381 – 385,2002 [11] Hong Han; Xin-Liang Lu; Li-Yong Ren. “Using data mining to discover signatures in network-based intrusion detection,” International Conference Proceedings Machine Learning and Cybernetics, vol 1. pp:13-17, 2002 [12]G. A. Carprnter, S. Grossberg . “The ART of adaptive pattern recognition by self-organizing neural network” Computer, vol. 21, no. 3,pp 7788.(1998) [13]Andrea Baraldi and Palma Blonda. “A survey of fuzzy clustering algorithms for pattern recognitionpart II” IEEE Transactions on Systems, Man and Cybernetics, Part B. issue. 6, vol. 29, pp 786-801, Dec 1999. [14]oracle press, oracle network products troubleshooting guide, http://otn.oracle.com/documentat ion/oracle7.html. 6. Conclusions In this paper, a Fuzzy ART neural network was applied to database operation security management. By monitoring the user behavior, the system can protect enterprise information system. The analysis the data includes user name, the network address of client, the connection building time, database name, used program, used protocol and so on which were extracted from the log file of database connection record. The feature is transformed to real number for Fuzzy ART input unit. There are more than 99% of connection record distribute in a few clusters, only few connection records distributed in the other cluster. The database administrator only needs to trace the few connection records. The system can great reduce the loading of database administrator of analysis thousands of database record.. References [1]CERT/CC Statistics 1988-2004, http://www.cert. org/stats/ [2]D. L. Carter & A.J. Katz . "Trends and experiences in computer-related crime: Findings from a national study.”,The Annual Meeting of the Academy of Criminal Justice Sciences, Las Vegas, NV.1996 [3]James P. Anderson. “Computer Security Threat Monitoring and Surveillance.”, Technical report, Fort Washington, Pennsylvania, April 1980. [4]Robert Graham,FAQ:Network Intrusion Detection System, version 0.8.3, March 21,2000, http://www.robertgraham.com/pubs/networkintrusion-detection.html. [5]Sang Hyun Oh and Won Suk Lee, “An anomaly intrusion detection method by clustering normal user. 844.
(7)
數據
相關文件
Basing on it, the paper analyzes the subjective and objective causes which An Shigao adopted the strategy, and discusses the influences exerted by word-creating methods used by
Monopolies in synchronous distributed systems (Peleg 1998; Peleg
Corollary 13.3. For, if C is simple and lies in D, the function f is analytic at each point interior to and on C; so we apply the Cauchy-Goursat theorem directly. On the other hand,
Corollary 13.3. For, if C is simple and lies in D, the function f is analytic at each point interior to and on C; so we apply the Cauchy-Goursat theorem directly. On the other hand,
A host connecting to the outside network is allocated an external IP address from the address pool managed by NAT... Flavors of
An adaptation layer is used to support specific primitives as required by a particular signaling application. The standard SS7 applications (e.g., ISUP) do not realize that
Microphone and 600 ohm line conduits shall be mechanically and electrically connected to receptacle boxes and electrically grounded to the audio system ground point.. Lines in
Teacher then briefly explains the answers on Teachers’ Reference: Appendix 1 [Suggested Answers for Worksheet 1 (Understanding of Happy Life among Different Jewish Sects in
