Pattern Recognition and Image Analysis, Vol. 11, No. 2, 2001, pp. 304–308.
Detection and Tracking of Road Signs
1C. Y. Fang*, C. S. Fuh**, and S. W. Chen*
*Department of Information and Computer Education, National Taiwan Normal University, Taipei, Taiwan, Republic of China
**Department of Computer Science and Information Engineering, National Taiwan University, Taipei, Taiwan, Republic of China
e-mail: violet@ice.ntnu.edu.tw
Abstract—In a visual driver-assistance system, road sign detection and tracking is one of the major tasks. This study describes an approach to detecting and tracking road signs appearing in complex traffic scenes. In the detecting phase, two neural networks are developed to extract color and shape features of traffic signs, respec-tively, from the input scene images. Traffic signs are then located in the images based on the extracted features. This process is primarily conceptualized in terms of fuzzy-set discipline. In the tracking phase, the traffic signs located in the previous phase are tracked through image sequences by using the Kalman filter. The experimental results demonstrate that the proposed method performs well in detecting and tracking road signs in complex scenes and in various weather and illumination conditions.
1 1. INTRODUCTION
Automatic road sign detection and tracking is an important task in a driver-assistance system [1, 3, 4]. Road signs characterized by color and shape are primarily for guiding, warning, and regulating car drivers. Each color and shape of the road signs convey a particular meaning. Accordingly, both color and shape are requisite features for road sign detection.
In reality, traffic scene images are taken in all condi-tions (sunny, shady, rainy, cloudy, and windy) and all loca-tions (freeways, expressways, highways, boulevards, streets, and country roads). These factors involve consid-erably varied lights and distinct types of background. Although road signs are of particular colors, the various outdoor environment affects the colors of road signs. In addition, moving obstacles, such as trucks, cars, motorcy-cles, bicymotorcy-cles, and pedestrians, may partially occlude the road signs and, therefore, transiently modify the visual shapes of road signs. Moreover, the disturbance of com-plex background, including miscellaneous buildings and shop signs, also increases the difficulty of the automatic detection of the road signs. For these reasons, reliable detection of road signs from various scenes becomes rather challenging.
In this study, color video sequence is employed to detect the road signs from complex traffic scenes. Further-more, a tracking technique, the Kalman filter, is used to reduce the time of road sign detection.
2. OUTLINE OF ROAD SIGN DETECTION AND TRACKING SYSTEM
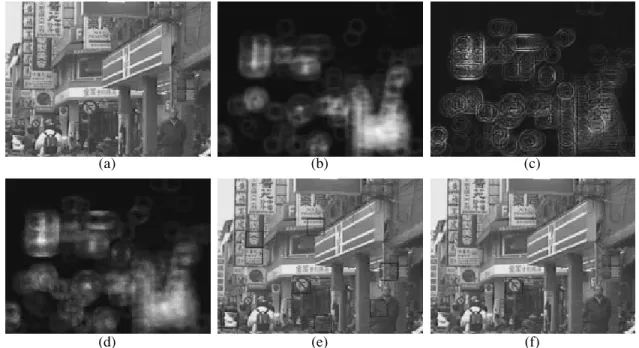
Figure 1 displays the outline of our road sign detection and tracking system. First, a color image S(t) (Fig. 2a) of a
video sequence S enters the system. Then, the image S(t) 1This paper was submitted by the authors in English.
is split into hue, saturation, and intensity (HSI) chan-nels, and only the hue values of specific colors are cal-culated to form the hue image H(t). The color features
are defined with a two-layer neural network as the cen-ters of specific color regions are extracted in parallel fashion from H(t). Figure 2 displays, for example, the
specific color regions, which indicate the red circular regions. Figure 2b presents the output of the neural net-work as the color feature map. Furthermore, the bright-ness of each pixel on the map designates its possibility to represent the centers of road signs from color infor-mation.
Simultaneously, an edge detection method is applied to acquire the gradient values in specific color regions to construct the edge image E(t). Again, with a two-layer
neu-ral network, the shape features, as with the color feature, are defined as the centers of certain fixed shapes and are extracted in a parallel fashion from E(t). Figure 2c presents
the output of the neural network, which is referred to as the shape feature map of Fig. 2a. The brightness of each pixel in the map designates its possibility of represent-ing the centers of a road sign from shape information.
Figure 2d shows that the color and shape features are integrated using a fuzzy approach to form an inte-gral map. After discovering the local minimums on the integral map, specific candidates of road signs can be located by thresholding these local minimums. Figure 2e verifies the result. Finally, after a simple verification step, the positions and sizes of road signs are output (Fig. 2f) and recorded in our system to be tracked.
Conversely, in the tracking phase, to predict suitable parameters for the following image, the Kalman filter combines the detection results of image S(t), that is, the
parameters of road signs with the input vehicle speed at that precise moment. To update the system parameters and to improve the efficiency of the detection phase, the results are then entered.
Received October 25, 2000
APPLIED PROBLEMS IN SYSTEMS
DETECTION AND TRACKING OF ROAD SIGNS 305 Image sequence S
Image subsampling
Color channel split and edge detection
Edge image Hue image
Shape feature detection Color feature detection
Centers of shapes of
interest regions of interestCenters of color
Update system
parameters Integration
Road sign parameters prediction
Input vehicle speed
Centers of potential road signs Verification
Output the road signs
Fig. 1. Outline of the road sign detection and tracking system.
(‡) (b) (c)
(d) (e) (f)
Fig. 2. An example of road sign detection process. (a) An original input image. (b) The color feature map of the input image. (c) The shape feature map of the input image. (d) The integration map of color and shape features. (e) The result after integration step. (f) The result after the verification step.
306 FANG et al.
3. FEATURE EXTRACTION
In our system, two neural networks are developed to extract color and shape features, respectively. Both of these neural networks are constructed by two layers of neurons, one is an input layer, and the other is an output layer. The number of neurons on each layer equals the number of pixels in the input image. The synapses between the input and output layers are fully connected. The details of the feature extraction can be referred to [2]. In brief, the output values of neurons on the output layer indicate the possibility of a road sign.
4. FUZZY FEATURE INTEGRATION For every pixel (i, j) in the input image, the member-ship degree of the pixel belonging to a road sign, µ(i, j), is defined as follows:
,
where and
Note that ε is a small positive constant, which avoids division by 0. Here, is the output value of neuron (k, l) on the output layer of the color-feature-detection neural network; is the output value of neuron (m, n) on the output layer of the shape-feature-detection neural net-work; and Nij indicates the set of neurons, which are neighbors of the neuron (i, j), including itself. Thus, and indicate that the maximum color and shape feature output are at (k', l') and (m', n'), respec-tively. Furthermore, wc and ws are the weights of color and shape features, respectively. In this study, we set wc = ws = 0.5.
Since an image may include more than one road sign, the local maximum of the membership function in subregions is selected to locate the road signs. Let the initial size of road signs be e; the locations of road signs are then defined by
µ(i j, ) wc yk'l' c × Dc+ε --- ws ym'n' s × Ds+ε ---+ = yk'l' c ykl c ( ); k l, (max)∈Nij = Dc (i–k') 2 j–l' ( )2 + , = ym'n' s ymn s ( ); Ds m n, ( max)∈Nij (i–m') 2 j–n' ( )2 + . = = ykl c ymn s yk'l' c ym'n' s L i j( , ) 1 if µ(i j, ) µ≥ (i1, j1)
for all i–e/2≤ ≤i1 i+e/2,
j–e/2≤ ≤j1 j+e/2
and µ(i j, )>U 0 otherwise. =
Here, U is a threshold, which eliminates impractical candidates. If the output of L (i, j) is 1, then there is a great possibility that a road sign is centered at (i, j).
5. ROAD SIGN VERIFICATION
First, for each center of potential road signs, all the pixels inside the potential road sign are classified into several distinct colors. Second, based on the result of color classification, the authenticity of road sign candi-dates is verified. There are two major principles for road sign verification:
(1) The area proportions of various colors within the same road sign are fixed.
(2) All road sign shapes are symmetrical as well as most of the major colors.
Considering the efficiency of the detection system, to verify most of the road signs a few of the available rules were used. Figure 2e demonstrates the result after the integration step applied to Fig. 2a, that is, there are eight road sign candidates within the image. Through the verification step, only one candidate sign is left (Fig. 2f). To sum up, the verification rules proved greatly beneficial in eliminating impractical road sign candidates.
6. TRACKING
In the tracking phase, we assume that the speed of the vehicle and the physical sizes of road signs are known. Based on these assumptions, the parameters, including the sizes and the positions of road signs, are predicted.
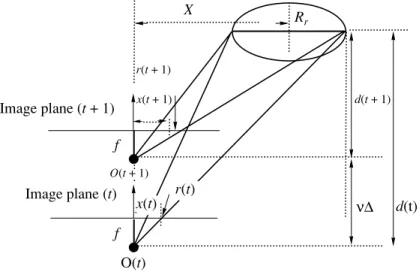
As Fig. 3 confirms, let Rr be the real radius of the
circular road sign, f be the camera constant, and v be the speed of vehicle. R(t), R(t + 1) represent the radii of the road sign projected on the images at time t, and t + 1, respectively. d(t) and d(t + 1) indicate the vertical dis-tance between the road sign and the camera lens at time t and t + 1, respectively. Referring to Fig. 3 we obtain
.
Let X be the horizontal (x-axis) distance between the road sign and the camera lens, and x(t), x(t + 1) be the distances between the road sign and the center of the images at time t, t + 1, respectively. Then we obtain
. The Kalman filter [5] is a popular state estimation tool. There are two major equation sets within the Kal-man filter, a time update equation set and a
measure-R t( +1) RrfR t( ) Rrf –R t( )v∆t ---= x t( +1) R t( +1) R t( ) --- x t( ) Rrf–R t( )v∆t Rrf --- x t( ) = =
DETECTION AND TRACKING OF ROAD SIGNS 307
ment update equation set. The former estimates the suc-ceeding state and the error covariance.
. The latter computes the Kalman gain and corrects the state and the error covariance.
. In these equations, sk represents the state vector,
is the a priori state estimate at step k, and is the a
posteriori state estimate. Pk indicates the a posteriori
estimate error covariance, and is the a priori esti-mate error covariance. zk is the measurement vector. Hk
is the transform matrix between zk and sk, and Ak is the
transform matrix between sk and sk + 1. Kk represents the Kalman gain. B is the weight matrix of the control input. uk is the control input. Nk and Qk indicate the
vari-ances of the measurement noise and the process noise, respectively.
Let x and y be the projection x-axis and y-axis dis-tance between the road sign and camera lens respec-tively, and R be the projection radius of road sign. We define the state vector s, the measurement vector z, the transform matrices H and A as follows:
Kk Pk – Hk T HkPk – Hk T Nk + ( )–1 ; = sˆk sˆk – Kk zk Hksˆk – – ( ); Pk + (I–KkHk)Pk – = = sˆk+1 – Aksˆk Buk; Pk+1 – + AkPkAk T Qk + = = sˆk – sˆk Pk – s z x y 1 R ---1 , H 1 0 0 0 0 1 0 0 0 0 1 0 0 0 0 1 , = = = ,
where f is the camera constant, v is vehicle velocity, Rreal is the radius of road sign, and ∆t indicates the time
interval.
7. EXPERIMENTAL RESULTS
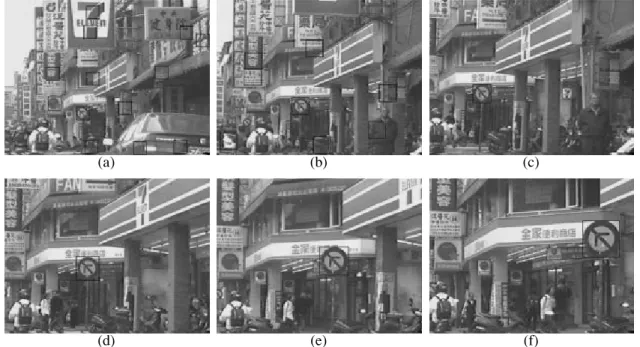
In our experiment, video sequences from the cam-corder mounted on a vehicle were employed. The video sequences were first converted into digital image sequences using Adobe Premiere 5.1. The size of each image is 320 × 240 pixels and the time between two successive images is 0.2 s. Figure 4 reveals the experi-mental results with sequence S1, where only the first
fif-teen frames of the sequence are shown.
Figure 4a (U = 0.5) reveals that there are three road sign candidates detected and tracked by our system. However, many mistaken road signs were detected. The road sign candidates were verified from the second image (Fig. 4b) of the sequence. Here the verification effect can be observed.
Our program operates on a Pentium II PC, and the time to detect the road sign on an entire image (320 × 240 pixels) is approximately ten seconds.
How-A 1 1 v∆t Rrealf --- R – --- 0 0 0 0 1 1 v∆t Rrealf --- R – --- 0 0 0 0 1 –1 1 v∆t Rrealf --- R – ---0 0 0 1 = ... ... ... ... ... ... ... ... ... ... . ...X Rr r(t + 1) Image plane (t + 1) d(t) ν∆ Image plane (t) O(t) x(t) r(t) f f d(t + 1) x(t + 1) O(t + 1)
308 FANG et al.
ever, the time for both tracking and verifying road signs is short. For reducing the search time in the road sign detection, the input images were subsampled into small images of 80 × 60 pixels.
8. CONCLUSIONS
This paper describes a method for detecting and tracking road signs from scene images with a complex background under various weather conditions. By inputting a color sequence image acquired by a single camcorder, to extract the color and shape features, respectively, two neural networks are developed. To extract the candidates of road signs, a fuzzy approach is introduced which integrates color and shape features to achieve this propose. Through a verification process, our system returns the road sign positions and sizes. Furthermore, using a Kalman filter to previously esti-mate the parameters of road signs is advantageous in reducing the search time of the ensuing image. We hope that our future system could detect and track road signs in real time.
ACKNOWLEDGMENTS
The authors would like to thank the National Science Council of the Republic of China for financially support-ing this research under Contact no. NSC 89-2218-E-003-001.
REFERENCES
1. Arnoul, P., Viala, M., Guerin, J.P., and Mergy, M., Traffic Signs Localization for Highways Inventory from a Video Camera on Board a Moving Collection Van, Proc. IEEE
Intelligent Vehicles Symposium, Tokyo, 1996, pp. 141–
146.
2. Fang, C.Y., Fuh, C.F., and Chen, S.W., Road Sign Detec-tion from Complex Backgrounds, Proc. 12th IPPR Conf.
on CVGIP, Taipei, Taiwan, 1999, vol. 1, pp. 282–289.
3. Kehtarnavaz, N. and Ahmad, A., Traffic Sign Recogni-tion in Noisy Outdoor Scenes, Proc. Intelligent Vehicles
Symposium, Detroit, 1995, pp. 460–465.
4. Parodi, P. and Piccioli, G., A Feature Based Recognition Scheme for Traffic Scenes, Proc. Intelligent Vehicles
Symposium, Detroit, 1995, pp. 228–234.
5. Welch, G. and Bishop, G., An Introduction to the Kal-man Filter, http://www.cs. unc.edu/~welch/kalKal-manIn-
unc.edu/~welch/kalmanIn-tro.html, 1999.
(‡) (b) (c)
(d) (e) (f)
Fig. 4. The experimental results with video sequence S1. The first six frames of this sequence are shown in (a)–(f). The size of each image is 320 × 240 pixels and the time between two successive images is 0.2 s.