www.rsc.org/
advances
RSC Advances
This is an Accepted Manuscript, which has been through the
Royal Society of Chemistry peer review process and has been
accepted for publication.
Accepted Manuscripts are published online shortly after
acceptance, before technical editing, formatting and proof reading.
Using this free service, authors can make their results available
to the community, in citable form, before we publish the edited
article. This Accepted Manuscript will be replaced by the edited,
formatted and paginated article as soon as this is available.
You can find more information about Accepted Manuscripts in the
Information for Authors.
Please note that technical editing may introduce minor changes
to the text and/or graphics, which may alter content. The journal’s
standard Terms & Conditions and the Ethical guidelines still
apply. In no event shall the Royal Society of Chemistry be held
responsible for any errors or omissions in this Accepted Manuscript
or any consequences arising from the use of any information it
contains.
This article can be cited before page numbers have been issued, to do this please use: N. Kumar, C. Huang, P. Yen, W. Wu, K. Wei and T-Y. Tseng, RSC Adv., 2016, DOI: 10.1039/C6RA11399K.
RSC Advances
Cite this: DOI: 10.1039/x0xx00000x
www.rsc.org/xxxxxx
ARTICLE TYPE
Probing the Electrochemical Properties of Electrophoretically Deposited
Co
3O
4/rGO/CNT Nanocomposite for Supercapacitor Applications
Nagesh Kumar
a, Chun-Wei Huang
b, Po-Jen Yen
b, Wen-Wei Wu
b, Kung-Hwa Wei
b, Tseung
Yuen Tseng
a*
Received (in XXX, XXX) XthXXXXXXXXX 20XX, Accepted Xth XXXXXXXXX 20XX 5
DOI: 10.1039/b000000x
This study reports the electrochemical performance of pseudosupercapacitor electrodes composed of cubic phase Co3O4 nanoparticles, reduced graphene oxide (rGO) and functionalized MWCNTs based nanocomposites. The Co3O4/rGO/CNT nanocomposites have been synthesized using hydrothermal method and EPD technique has been used to make binder free electrode of the nanocomposite materials for supercapacitor application. The effects of graphene oxide (GO) concentrations and the ratio of GO/CNTs on the electrochemical
10
performance of the nanocomposite material have been investigated. From the experimental results, the Co3O4/rGO/CNT nanocomposite synthesized with 2 mg/mL GO concentration and 10:1 GO/CNT ratio exhibits good specific capacitance of 850 Fg-1 at 5 mVs-1 scan rate and 790 Fg−1 at 1 Ag−1, excellent rate capability and good cyclability in 1 M KOH. Furthermore, we have successfully designed an aqueous electrolyte-based asymmetric pseudocapacitor using Co3O4/rGO/CNT nanocomposite as an anode and N–doped graphene nanocomposite as a cathode. The operating voltage of our optimized asymmetric pseudocapacitor is 1.4 V and it exhibits the maximum
15
energy density and power density of 19.6 Whkg-1 and 7250 Wkg-1, respectively. These results suggest that our EPD grown nanocomposite binder free electrode and our designed asymmetric pseudocapacitor have a good potential for practical applications
1. Introduction
In response to the ever-growing demand for energy, the limited fossil fuel and environmental issues like global warming, the
20
renewable energy resources like solar, wind and hydro energy have become a focal point of the leading world powers and scientific community.1 To utilize renewable energy resources effectively i.e., to get perpetual supply from them some efficient energy storage devices like batteries, fuel cells and
25
supercapacitors (SCs) etc are needed, which could be coupled with renewable energy sources to manage the demand and supply of energy.2 Thus recently energy storage devices, particularly, Li ion batteries and SCs have gained gigantic attention over others due to their good energy density, power density and relatively
30
low cost. SCs possess high power density (> 10 kWkg-1) and long cycle life ( > 105 cycles) and fast galvanostatic charge discharge (GCD) response (within seconds) but exhibit poor energy density in comparison to the rechargeable batteries, which has restricted their potential commercial applications.3-6 Therefore, in the recent
35
years much research efforts are focused on increasing the energy
density of SCs to meet the future energy demands without sacrificing their excellent power delivery and cycle stability.
The energy density (E) of SCs depends on intrinsic capacitance (C) of active materials and on the applied voltage (V)
40
according to following relation, E = 1/2 CV2. It implies that energy density (E) can be increased either by increasing the specific capacitance of the material or operating voltage. However, increasing the operating voltage (V) will be more effective than increase in capacitance (C) as suggested by the
45
above relation.7 The SCs operating voltage depends on the active material used for the electrode fabrication and electrolyte’s stability window. For aqueous electrolytes the stable SCs voltage window is 0.6 – 1.2 V (theoretical decomposition voltage of water, 1.23 V), for organic electrolytes it is in the range of 2.2 –
50
3.5 V and for ionic liquids it varies from 2.6 to 4.5 V.8 However, in comparison to aqueous electrolytes the organic electrolytes and the ionic liquids based electrolytes are generally more expensive, hazardous to the environment, and having low ionic conductivity and higher specific resistance limit the performance of SCs.9 On
55
the other hand, aqueous electrolytes have excellent ionic
RSC
Advances
Accepted
Manuscript
conductivity, which reduces the internal resistance and thus allow faster charging/discharging process. Moreover, in view of low-cost, environmental friendly synthesis, safety issues and convenient assembly in air aqueous electrolytes have become very attractive for electrochemical capacitors.10 On the basics of
5
charge storage mechanism, there are mainly two types of SCs, one is termed as electric double layer capacitors (EDLCs) and other kind is pseudocapacitors or faradic SCs. In the first one charges are stored via ion absorption/desorption process at the electrode-electrolyte interfaces, e.g., carbon-based materials,
10
while in the later one charges are stored through fast, reversible redox reactions on the surface of the material, e.g., metal oxides and conductive polymers. Generally, EDLCs possesses higher power density while faradic SCs exhibits better specific capacitance and higher energy density.11,12
15
Recently, much research efforts are focused on designing asymmetric pseudocapacitor that bring both the EDLC (negative electrode material) and pseudocapacitive (positive electrode material) behaviors together.13-15 Asymmetric pseudocapacitor is a two-electrode configuration, which is operated at a suitable
20
wider potential window that depends on the combined compatible operating voltages of the negative and positive electrodes. The wider potential window in asymmetric pseudocapacitors leads to high energy density without compromising the high power density of the system.
25
Up to now, supercapacitive properties of various Co3O4/carbon materials (CNT, graphene) nanocomposites have been investigated and results suggest that synthesis procedures and electrode preparation techniques are the key factors which greatly influence the electrochemical properties of such
30
systems.16,17 Presently, due to absolute mesoporous structure, remarkable accessible surface area, high conductivity and excellent chemical stability the carbon materials like CNTs and graphene are among the most attractive materials for supercapacitors research.18 It has been reported that nitrogen
35
doping in graphene significantly enhance its pore volume, electrical conductivity, surface area and mechanical strength and hence improve its electrochemical performance.19,20
In this study, we have synthesized hybrid nanocomposites of Co3O4 with reduced graphene oxide (rGO) and MWCNTs via
40
hydrothermal route and a simple electrophoretic deposition (EPD) technique has been utilized to make binder free Co3O4/rGO/CNT nanocomposite electrodes. The synergistic
effect in the Co3O4/rGO/CNT nanocomposite makes the SCs exhibiting good electrochemical properties. In addition to it we
45
have designed an aqueous electrolyte-based asymmetric pseudocapacitor based on Co3O4/rGO/CNT ternary nanocomposite anode, and N–doped graphene cathode. The present strategy has been employed to utilize the unique properties of each electrode material, which make the SCs
50
exhibiting good energy and power densities.
2. Experimental 2.1. Synthesis of GO
The starting material, graphene oxide (GO) was synthesized by the chemical oxidation of graphite flakes in a mixture of H2SO4
55
and H3PO4. The whole experimental procedure was first reported by Marcano et al. .21 The obtained solid GO sample was dried in a vacuum oven at 45°C for 3 days and then dispersed in D. I. water using bath sonicator to obtain desired concentrations (mg/mL).
60
2.2 Purification of CNTs
The commercial MWCNTs (specific surface area: 40 – 300 m2g-1, length: 5 – 20 µm) were purified by refluxing them in 70% nitric acid solution at 90°C for 24 h. After reaction, mixture was
65
filtered over nylon membrane filter (0.2 µm) and washed by excess of D. I. water until pH became neutral. Such obtained purified and functionalized MWCNTs were dried in an oven at 100°C for 12 h before further use.
2.3 Synthesis of Co3O4/rGO/CNTs nanocomposites
70
Well known hydrothermal approach was followed for the synthesis of Co3O4/rGO/CNTs nanocomposites. First, GO dispersions in water with different concentrations (1, 2 and 4 mg/mL) were prepared via ultrasonication, after that purified CNTs were ultrasonically dispersed well in 40 mL GO
75
dispersions. Here, ratio of GO/CNT was kept constant (10:1) and ~ 150 mg of Co(NO3)2•6H2O was mixed in 40 mL GO/CNT dispersions and stirred for 1 h, after that, certain amount of urea was added into it and the resultant mixture was further stirred for 1 h. The pH of this mixture was adjusted to 10 by ammonia
80
solution and then it was transferred into a 50 mL Teflon-lined sealed stainless steel autoclave. The reaction temperature was maintained at 180°C for 8 h. After hydrothermal reaction, material was collected via filtration and washed several times with excess amount of water and ethanol. Final product was first
85
RSC
Advances
Accepted
Manuscript
dried in vacuum oven at 80°C and then annealed at 300°C in N2 environment for 3 h. Here, in the synthesis of all the samples, same amount of Co (NO3)2•6H2O was used keeping the ratio of GO/urea invariable. Depending on the GO concentrations used in the synthesis i.e. 1, 2 and 4 mg/mL, samples are labeled as
5
1GCoC, 2GCoC and 4GCoC, respectively. For comparison and to study the effect of CNTs concentrations on the electrochemical properties of the nanocomposite, we have synthesized two more samples with varying ratio of GO/CNT i.e., 10:0 and 10:2 for fixed GO concentration (2 mg/mL) and these samples are labeled
10
as 2GCo and 2GCo2C, respectively.
2.4 Synthesis and fabrication of crumpled N-doped graphene electrode
In the present work, the crumpled N–doped graphene (N–rGO) was synthesized as reported previously.20 Briefly, 120 mg GO
15
was dispersed well in 100 mL D. I. water via ultrasonication after that 10 mL 50% cyanamide (NH2CN) solution was added into it and the resulting mixture was dried at 90°C with stirring. The obtained gray powder (GO–NH2CN) was first heated at 400°C for 1 h in air and after that at 920°C in an inert ( N2 97% + H2
20
3%) environment for 3 h.
For electrode fabrication, homogeneous slurry was made after mixing N–rGO powder, super P (conducting carbon) and PVDF (binder) in the ratio of 85:5:10 wt%. First, PVDF was allowed to dissolve in NMP solvent via stirring and after that an
25
appropriate amount of N-rGO was added into it and the mixture was further stirred for 10 h. The obtained homogeneous slurry was coated on to ~ 1 cm2 area of Ni foam substrate with the help of drawing brush. The electrode was dried in a vacuum oven at 70°C for 10 h and then pressed to be a thin foil at 10 MPa for 5
30
min. Before use Ni foam substrate was cleaned with acetone and etched in 3 M HCl solution.
2.5 Fabrication of Co3O4/rGO/CNT electrodes
To prepare working electrodes, Co3O4/rGO/CNT nanocomposites
35
were deposited on the etched and cleaned Ni substrates (10×30×1 mm) via electrophoretic deposition (EPD). To make Ni surface rough and clean, it was first etched in 10% HNO3 for 30 min and then washed with plenty of water and dried in a vacuum oven at 100°C for 12 h. For EPD process, the nickel foil substrate and a
40
platinum electrode were positioned face-to-face in the electrolyte solution at a distance of 1 cm aside and used as cathode and anode electrodes, respectively. To make electrolyte for EPD, ~
0.1 g Co3O4/rGO/CNTs nanocomposite powders were dispersed well in a solution of 80 mL isopropyl alcohol (IPA) via
45
ultrasonication for 30 min and 0.2 mL 37% HCl solution was added in it to make the surfaces of composite nanoparticles positively charged. For electrophoretic deposition of Co3O4/rGO/CNTs nanocomposites, a constant DC voltage of 50 V was applied between Ni substrate and Pt electrode in the well
50
dispersed electrolyte solution for ~ 2 min. After EPD, obtained uniform Co3O4/rGO/CNTs nanocomposite film on Ni substrate was dried in an oven at 100ºC for 8 h. The weight of the active nanocomposite film on the Ni substrate, as measured by the microbalance (PRECISA XR125SM-FR) with an accuracy of 0.1
55
µg, was ~ 0.2 mg. Same EPD process with identical conditions, as described above, was used to fabricate the electrodes of all nanocomposite samples, namely, 1GCoC, 2GCoC, 4GCoC, 2GCo2C and 2GCo. The scheme of nanocomposite synthesis and electrode fabrication is shown in Fig. 1.
60
Fig. 1. Scheme of Co3O4/rGO/CNT nanocomposite synthesis and the process of electrodes fabrication.
65
2.6 Fabrication of asymmetric pseudocapacitor system The Asymmetric pseudocapacitor cell was successfully designed in a simple two-electrodes configuration using crumpled N– doped graphene electrode as a cathode and 2GCoC nanocomposite electrode as an anode. Here, in order to avoid the
70
direct contact between anode and cathode a separator (DuPontTM Nafion® NRE211 membrane) was sandwiched between them. After pressing, 1 M KOH electrolyte solution was infiltrated into the assembly with a syringe, until all air was replaced. On the basis of specific capacitances, calculated from the CV curves in a
75
three–electrode cell, the loading mass ratio of active anode (2GCoC) and active cathode (N–rGO) materials for the fabrication of two–electrode asymmetric pseudocapacitor was estimated to be 0.287. In this asymmetric cell the mass loading of the active cathode and active anode materials were 0.7 mg and
80
RSC
Advances
Accepted
Manuscript
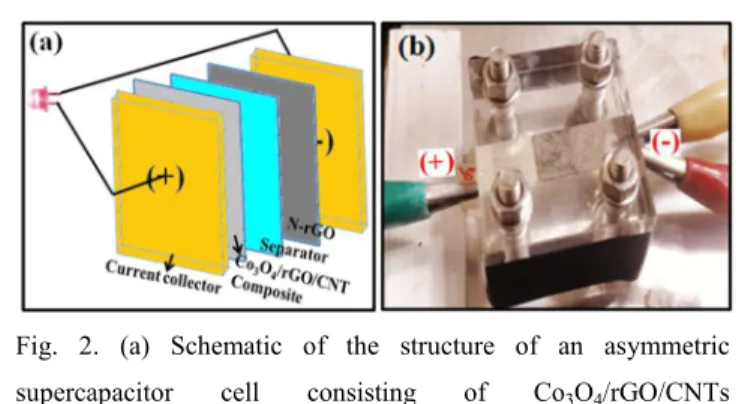
0.2 mg, respectively. The mass of each sample was measured by a high precision microbalance (PRECISA XR125SM-FR) with an accuracy of 1 µg. A schematic diagram and a digital photograph of our designed asymmetric cell are shown in Fig. 2.
5
Fig. 2. (a) Schematic of the structure of an asymmetric supercapacitor cell consisting of Co3O4/rGO/CNTs nanocomposite, N-rGO, a separator and two current collectors, and (b) digital photograph of the cell.
10
2.7 Structural characterization
To check crystallinity and to perform microstructural analysis, all the synthesized nanocomposite samples were thoroughly examined via X–ray diffractometer (XRD, Bede D2) and field-emission transmission electron microscope (FE-TEM, JEOL
15
JEM-2100F). The surface morphological investigations were carried out using Field emission scanning electron microscope (SEM, Hitachi SU8010). The specific surface area, pore size and pore size distribution of the nanocomposite sample were measured by BET surface area analyzer (BET, ASAP 2020). To
20
know the content of Co3O4 in the composite material, thermal-gravimetric analysis was executed from 50 to 900°C at 3°C min-1 ramping rate under air environment using thermogravimetric analyzer (TGA, TA Instruments Q500).
25
2.8 Electrochemical testing
To The electrochemical performance of Co3O4/rGO/CNTs nanocomposites based pseudocapacitors were analyzed by cyclic voltammetry (CV), galvanostatic charge/discharge (GCD) and electrochemical impedance spectroscopy (EIS) using CH
30
Instruments 618B electrochemical analyzer at room temperature. For electrochemical testing a three-electrode set-up was used, which contained a saturated calomel reference electrode (SCE), a counter electrode of platinum sheet, a working electrode of EPD grown Co3O4/rGO/CNTs nanocomposite film and an aqueous
35
electrolyte solution of 1 M KOH. The CV and GCD data were recorded in the potential range of -0.1 – 0.45 V versus SCE at
different scan rates and current densities. The specific capacitance (Fg-1) from CV curve was determined using the following equation: 40 ) ( ) ( i f E E E E v m dE E I C f i − ⋅ ⋅ =
∫
(1)where Ei and Ef, respectively, are the initial and the final voltages in the CV analysis, (Ef – Ei) is the potential window width, I (E) is the oxidation or reduction current (in amperes), m is the mass of active material and v is the scan rate.
45
The following equation was used to calculate the specific capacitance (Fg-1) from GCD curve:
m
V
t
I
C
⋅
∆
∆
⋅
=
(2)
where m is the mass of active material, ∆V is the potential
window for a full discharge, I is the discharge current and ∆t is
50
the time for a full discharge.
The EIS was studied over the frequency range of 0.1Hz – 100 KHz at an open circuit voltage with AC amplitude of 5 mV.
3. Results and discussion
55
3.1 Compositional and Morphological studies
The powder X-ray diffraction (XRD) patterns of GO, rGO, Co3O4 and Co3O4/rGO/CNTs nanocomposites (1GCoC, 2GCoC, 4GCoC synthesized with 1, 2, 4 mg/mL GO concentrations, respectively) powder samples are shown in Fig. 3. It can be seen in Fig. 3a that
60
the XRD pattern of GO possesses a characteristic intense peak (001) at 2θ = 9.829° with a layer–to–layer d–spacing of 0.8465 nm. Here in the hydrothermal synthesis process of nanocomposites, urea works as the reducing agent for GO. To make pristine rGO sample, we took GO solution with an
65
optimum GO/urea mass ratio (1:1) 22,23 and followed the same synthesis conditions as described above. Fig. 3a shows that after the reduction of GO to rGO by urea the GO peak at 2θ = 9.829° vanishes and a broad peak (002) with a d–spacing of 0.3585 nm emerges at 2θ = 15 to 35°. The higher d–spacing value of the GO
70
sample is attributed to the presence of a single–molecule–thick layer of water molecules that intercalate between the GO sheets attached along with other oxygen-containing functional groups.24 The broad peak in the XRD pattern of rGO sample suggests the presence of poor ordering of the rGO sheets along their stacking
75
direction. In Fig. 3b the XRD pattern of Co3O4 clearly
RSC
Advances
Accepted
Manuscript
demonstrates the presence of Co3O4 nanoparticles via the characteristic sharp peaks that are representative of the (111), (220), (311), (222), (400), (422), (511) and (440) planes of the cubic phase of Co3O4 ( JCPDS No. 42–1467). As shown in Fig. 3b, all the peaks of Co3O4 cubic phase appear in all the
5
synthesized Co3O4/rGO/CNT nanocomposites (1GCoC, 2GCoC, 4GCoC). A rectangle region “A” around 2θ ≈ 25° verifies the existence of rGO in the nanocomposite samples, as the bump in this region is increasing with increase in the GO concentration from 1mg/mL to 4 mg/mL (Fig. 3b). The average grain sizes of
10
pure Co3O4, 1GCoC,
Fig. 3. XRD spectra of (a) synthesized graphene oxide (GO), reduced graphene oxide (rGO), and (b) Co3O4 and its composites with CNTs and different GO concentrations.
15
The average grain sizes of pure Co3O4, 1GCoC, 2GCoC, 4GCoC nanocomposite samples were determined utilizing Debye– Scherrer formula (equation 3)
θ
β
λ
cos
9
.
0
=
t
(3)20
where β represents the full width at half maximum (FWHM) of X-ray peak in radians, λ is the wavelength (0.15406 nm for Cu Kα radiation) of the X-ray used and ‘t’ is the crystallite size. For grain size measurements same (311) XRD peak of all the samples has been used. On applying the above formula, the calculated
25
values of the average grain sizes for Co3O4, 1GCoC, 2GCoC, 4GCoC nanocomposites are ~ 23, 9, 7 and 10 nm, respectively. We observe that 2GCoC sample possesses smallest in-plane crystallite size (~ 7 nm) among the four test samples. Generally, smaller grain size possesses larger surface area, which being
30
intimately associated with the surface reactions plays an eminent role in deciding the specific capacitance of the material.25-28 During electrochemical investigations, among all samples 2GCoC exhibits better electrochemical performance, therefore, we further examine 2GCoC sample by FESEM, BET, TGA and
35
TEM.
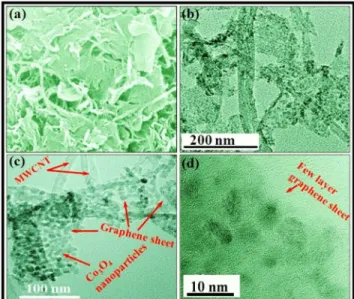
Fig. 4 represents the FESEM, TEM and HRTEM images of the 2GCoC nanocomposite sample. Fig. 4a is the FESEM image of the sample and it shows that in the nanocomposite Co3O4, rGO sheets and CNTs are mixed well and in proper
40
contact with each other. The TEM images, Figs. 4b and 4c show
Fig. 4. (a) FESEM image of 2GCoC nanocomposite, (b) and (c) TEM images of the composite, and (d) HRTEM image of the nanocomposite material.
45
that the rGO sheets and the CNTs are uniformly decorated with Co3O4 nanoparticles. The size of the nanoparticles is around 10 nm and this result is consistent with the XRD data, i.e. each nanoparticle is a single grain. Fig. 4d is the HRTEM image of the sample, it shows that the rGO sheet is about 3 – 4 layers thick.
50
Generally, thermogravimetric analysis (TGA) is executed to know the thermal stability of the material and to determine the content of constituent materials in the compositions material. Fig. 5a shows the TGA graph of 2GCoC nanocomposite recorded in air environment at a ramp rate of 3°C min-1 in the range of 50 –
55
900°C. The 8.5% weight loss of the sample between 50 – 250°C, owing to the evaporation of surface absorbed water and to the removal of interlayered water molecules. However, the additional weight loss in the range of 300 – 620°C is ascribed to the decomposition of hydrophilic functional groups, attached with the
60
rGO/CNTs surfaces during synthesis and acidic purification processes, and to the thermal decomposition of carbon material (rGO/CNTs) present in the composite.29,30 TGA analysis indicates that the residual weight of the 2GCoC nanocomposite represents
RSC
Advances
Accepted
Manuscript
the content of Co3O4 nanoparticles attached with the surface of rGO sheets and CNTs and it was calculated to be ~ 80%.
Fig. 5. (a) TGA curve of 2GCoC nanocomposite recorded in air at ramp rate of 3°C min-1, and (b) N2 adsorption–desorption
5
isotherm and inset shows the pore size distribution curve of the 2GCoC nanocomposite.
Fig. 5b demonstrates the typical nitrogen adsorption /desorption isotherm of the 2GCoC nanocomposite sample. The presence of notable hysteresis loop in the isotherm is attributed to
10
the existence of mesopores between composite nanoparticles. The analysis of nitrogen sorption results reveal that the 2GCoC nanocomposite possesses BET surface area equal to 121 m2g-1, a narrow mesoporous distribution at around 1.9 – 4.3 nm and the average pore size 17.5 nm with dominant pore size of 2.4 nm
15
(mesopores) as shown in the inset of Fig. 5b. It has reported as the size of hydrated ions in the electrolyte solution lies in the range of 6 – 7.6 Å, the pore size distribution of the material in the range of 8 – 50 Å is the most desirable aspect to increase the specific capacitance of the composite material.31
20
To get suitable composition of the constituent materials in a nanocomposite for better supercapacitor performance, various samples were synthesized via hydrothermal process and their electrochemical properties were investigated through cyclic voltammetry (CV), galvanostatic charge/discharge (GCD) and
25
electrical impedance spectroscopy (EIS) measurements in 1 M KOH electrolyte. Fig. 6 shows the electrochemical performance of 1GCoC, 2GCoC and 4GCoC nanocomposite electrodes. The CV curves of all the samples possess a sharp redox peak, which corresponds to the electrochemical charge transfer reactions Co2+
30
/Co3+ (equation 4) ( Fig. 6a ) 32
− − ↔ + + +H O OH CoOOH e O Co3 4 2 3 (4)
It implies that in these nanocomposite samples pseudocapacitive charge storage mechanism is dominant, in which charge storage process takes place due to reversible redox reactions occurring on
35
the surface of the active material. The effect of GO concentration on the specific capacitance of the nanocomposite samples is shown in Fig. 6b. The specific capacitances of the samples synthesized with 1, 2 and 4 mg/mL GO concentrations calculated from the CV data at the scan rate of 5 mVs-1 are 156, 850 and 408
40
Fg-1, respectively. Fig. 6c shows the charging and discharging (GCD) curves of all the three samples measured at the current density of 1 Ag-1 in the potential window of -0.1 – 0.45 V in 1 M KOH aqueous electrolyte at 25°C. In these curves, the nonlinear behavior of the GCD curves verifies the results from the CV
45
measurements and confirms that the main contribution to the capacitance comes from the redox reactions at the surface of Co3O4 nanoparticles in the composite.
Fig. 6. (a) CV curves of 1GCoC, 2GCoC and 4GCoC samples in
50
1 M KOH at a scan rate of 5 mVs-1, (b) specific capacitance as calculated by CV curves (c) GCD curves at current density of 1 Ag-1, and (d) Nyquist plots of the samples.
Fig. 6d represents the Nyquist plots of 1GCoC, 2GCoC and
55
4GCoC nanocomposite samples as obtained from EIS. These curves reveal characteristic features of the electron transportation between the electrolyte and the electrode surface. The effective series resistance (ESR) or solution resistance (Rs) (the point where Nyquist plot intersect the Z´–axis in the range of high
60
frequency) is the collective resistance of ionic resistance of electrolyte, intrinsic resistance of substrate and active electrode material, and contact resistance at the electrode and current collector interface. Rs is inversely proportional to the power density therefore smaller the value of ESR better will be the
65
RSC
Advances
Accepted
Manuscript
power density of the system.33 From EIS curve the values of Rs for 1GCoC, 2GCoC and 4GCoC nanocomposite electrodes come out to be 1.89, 1.79 and ~ 1 Ω, respectively. Here, we simply conclude that on increasing the concentration of graphene oxide (mg/mL) composite, the internal resistance of the composites is
5
decreasing.
To explore the importance of CNTs in the above synthesized nanocomposite samples, we changed the concentration of CNTs in our best nanocomposite sample, i.e. 2GCoC, keeping all other parameters invariable. We synthesized
10
two more samples, namely, 2GCo, and 2GCo2C in addition to 2GCoC sample and compare their electrochemical performances. Sample 2GCo is without CNTs, in 2GCoC the ratio of GO/CNTs is 10:1 and in 2GCo2C the ratio of GO/CNTs is 10:2. The electrochemical performances of these samples are shown in Fig.
15
7. The CV curves in Fig. 7a show that in all the samples, the
Fig. 7. (a) CV curves of 2GCo, 2GCoC and 2GCo2C samples in 1 M KOH at a scan rate of 5 mVs-1, (b) specific capacitance as calculated by CV curves, (c) GCD curves at current density of 1
20
Ag-1, and (d) Nyquist plots of the samples and inset shows the magnified “A” region.
charge storage mechanism is governed by pseudocapacitive behavior. The effect of GO/CNTs ratio on the specific
25
capacitance of the nanocomposites is shown in Fig. 7b. We observe that in all the synthesized samples GO/CNT ratio 10:1 is optimum because the sample, 2GCoC, having this ratio exhibits highest specific capacitance. The specific capacitance values calculated from the CV data for 2GCo, 2GCoC and 2GCo2C
30
samples at the scan rate of 5 mVs-1 in the potential window -0.1 – 0.45 V and in 1 M KOH aqueous electrolyte come out to be 230, 850 and 353 Fg-1, respectively. Fig. 7c represents the GCD curves for 2GCo, 2GCoC and 2GCo2C nanocomposites measured at the current density of a 1 Ag-1. The Nyquist plots of 2GCo, 2GCoC
35
and 2GCo2C nanocomposites, as obtained from EIS, are shown in Fig. 7d. These curves show that the value of Rs for these nanocomposites is decreasing with increasing the concentration of CNTs in the sample. From the magnified region “A” of the curves, the value of Rs for 2GCo, 2GCoC and 2GCo2C
40
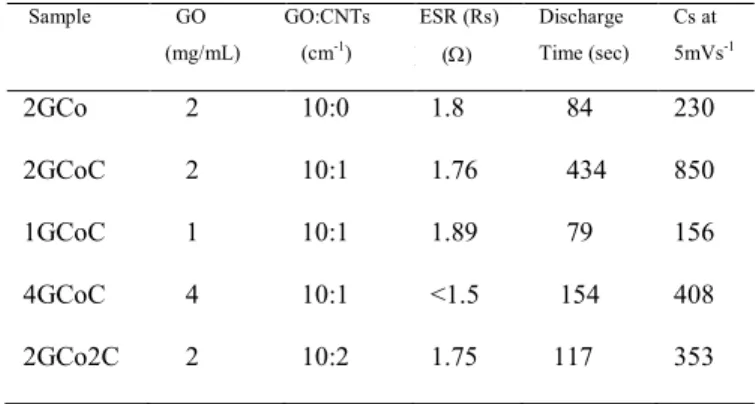
nanocomposites are 1.79, 1.76 and 1.75 Ω, respectively (Fig. 7d). Synthesis parameters and electrochemical properties of all the samples have been summarized in Table 1.
Sample GO (mg/mL) GO:CNTs (cm-1) ESR (Rs) ( (Ω) Discharge Time (sec) Cs at 5mVs-1 2GCo 2 10:0 1.8 84 230 2GCoC 2 10:1 1.76 434 850 1GCoC 4GCoC 2GCo2C 1 4 2 10:1 10:1 10:2 1.89 <1.5 1.75 79 154 117 156 408 353 45
From the above discussion, we conclude that 2GCoC sample, synthesized with 2 mg/mL GO concentration and GO/CNTs ratio 10:1, exhibits highest specific capacitance. Now, to get additional information concerning the pseudocapacitive nature and electrochemical behavior of 2GCoC nanocomposite,
50
we executed the detailed analysis of CV, GCD, and long-term stability test for this sample in a three electrode configuration cell. Fig. 8a shows the CV curves with different scan rates in the potential window -0.1 – 0.45 V in 1 M KOH aqueous electrolyte at room temperature. It can be seen, as the scan rate increases, the
55
redox peaks become less conspicuous, manifesting the slow faradaic reactions mainly occur at low scan rate values. It is evident that with the increase in scan rate, due to electrochemical polarization, the cathodic and the anodic peaks in the CV curves shift towards lower and higher potential regions, respectively. It
60
represents the quasi-reversibility feature of the redox reactions in the system.34 The calculated specific capacitance values at different scan rates of 5, 10, 15, 25, 50, 75 and 100 mVs-1 are 850, 790, 740, 660, 552, 495 and 403 Fg-1, respectively.
RSC
Advances
Accepted
Manuscript
Fig. 8b depicts the charge/discharge behavior of 2GCoC nanocomposite electrode at different current density values and similar to CV results it also verifies the pseudocapacitive nature
5
Fig. 8. (a) CV curves of 2GCoC in 1 M KOH at scan rates of 5, 10, 15, 25, 50, 75 and 100 mVs-1 , (b) GCD curves at current density of 1, 2, 3, 5, 8, 10, 15 and 20 Ag-1, (c) cycling stability test at current density of 2 Ag-1 and inset shows the GCD curves of 1st and 1000th cycles, and (d) Nyquist plots before and after
10
stability test.
of the composite material. The specific capacitances, calculated from GCD curves employing equation 2, at current density values of 1, 2, 3, 5, 7, 10, 15, 20 and 25 Ag-1 come out to be 790, 738,
15
709, 682, 650, 638, 600, 585 and 568 Fg-1, respectively as shown in Fig. S1 (see supporting information). Furthermore, we do not observe any noticeable deformity in the GCD curves with increase in the current density, referring the 2GCoC nanocomposite electrode is well tolerant. For 2GCoC
20
nanocomposite, the capacitance value of 790 Fg-1 at 1 Ag-1 is higher than the capacitance values reported for several Co3O4/rGO nanocomposites, as can be seen from the Table S1 (Supporting Information). The capacitance retention of the 2GCoC nanocomposite electrode is ~ 81 % when the current
25
density was increased from 1 Ag-1 to 10 Ag-1, indicating 2GCoC nanocomposite possesses excellent rate capability. This remarkable rate capability of the 2GCoC nanocomposite electrode can be attributed to the mesoporous structure and conducting network formed by rGO sheets and CNTs in the
30
nanocomposite, which allow rapid electron transportation to and
from the electrochemically active sites. The long cycle stability is another important parameter for evaluating the electrochemical performance of the electrode material. The cyclic stability of the 2GCoC nanocomposite was evaluated for 1000 cycles in 1 M
35
KOH electrolyte at a constant GCD current density of 2 Ag-1 (Fig. 8c). It can be seen that after 1000 charge/discharge cycles, the 2GCoC nanocomposite can retain ~ 73% of initial capacitance value. This attenuation in the capacitance value during long cycle test is ascribed to the redox reactions occurring at the electrode
40
surface. The inset in Fig. 8c shows the GCD curves of 1st and 1000th cycles. The shape of the curve has not changed much after 1000 cycles. During long cycle test the electrochemically active sites in the electrode material are gradually consumed, and the internal resistance of the electrode has increased as shown in Fig.
45
8d.
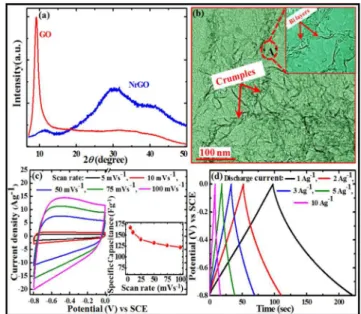
Further, we have designed an asymmetric supercapacitor (ASC) using 2GCoC nanocomposite electrode as an anode and crumpled N-doped graphene (N–rGO) as a cathode. Fig. 9a represents the XRD spectra of GO and N-rGO. It shows that GO
50
has completely reduced during synthesis process. Fig. 9b is the
Fig. 9. (a) XRD spectra of GO and N-rGO, (b) TEM images of the N-rGO and inset shows the HRTEM image taken at point “A”, (c) CV curves of N-rGO sample in 1 M KOH at scan rates
55
of 5, 10, 50, 75 and 100 mVs-1 and inset shows the specific capacitance calculated from CV curves, and (d) GCD curves at current density of 1, 2, 3, 5 and 10 Ag-1.
TEM image of crumpled N–rGO and inset shows the HRTEM
60
image of it. Fig. 9b reveals that our synthesized crumpled N–rGO
RSC
Advances
Accepted
Manuscript
sample mostly consists of bilayers. Fig. 9c shows the CV curves of crumpled N–rGO with different scan rates in the potential window -0.8 – 0 V in 1 M KOH aqueous electrolyte at room temperature. It reveals that N–rGO possesses specific capacitance of 167 Fg-1 at 5 mVs-1 and 156 Fg-1 at 10 mVs-1. Fig. 9d
5
represents the GCD curves of N–rGO at different current densities.
For asymmetric supercapacitor, the charge balance is done following the relationship of q+ = q-, where q+ and q- are the charges stored in positive and negative electrode.35,36 The charge
10
storage of each electrode depends on mass of electrode (m), specific capacitance (C) and potential window of charge-discharge process (∆E) following the relation given in equation (5)
q=C×∆E×m
(5)
15
Considering charge balance q+ = q-, the mass balance will be
+ + − − − + ∆ × ∆ × = E C E C m m
(6)
The specific capacitances (Cs) of 2GCoC and N-rGO samples calculated at 10 mVs-1 are 790 Fg-1 (-0.1 – 4.5 V) and 156 Fg-1 (-0.8 – 0V), respectively. On substituting these values in equation
20
(6), the calculated optimal mass ratio in ASC is 0.287.
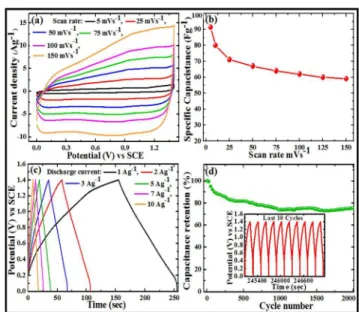
Fig. 10a shows the typical CV curves of optimized asymmetric pseudocapacitor at different scan rates in the potential window 0 – 1.4 V in 1 M KOH aqueous electrolyte at room temperature. It is observed, as the scan rate increases, the
25
total current increases and all the CV curves look like quasi-rectangular. Fig. 10b represents the specific capacitance of asymmetric pseudocapacitor calculated at different scan rates. The calculated specific capacitance values at different scan rates of 5, 15, 25, 50, 75, 100, 125 and 150 mVs-1 are 91 , 80, 71, 67,
30
64, 62, 60 and 59 Fg-1, respectively. Here, to calculate specific capacitance total mass of active materials on the electrodes has utilized. Fig. S2 (see supporting information) shows a linear relationship between average peak current and square root of scan rate, exhibiting mass transport controlled process in the
35
system.37,38
Fig. 10c depicts the GCD behavior of the asymmetric pseudocapacitor at various current densities. From the GCD curves, the specific capacitances at current densities of 1, 2, 3, 5, 7 and 10 Ag-1 come out to be 71.4, 70, 68.6, 67.2, 66 and 64.3 Fg
-40
1
, respectively. The capacitance retention of the asymmetric pseudocapacitor is ~ 90% when the current density was increased
from 1 Ag-1 to 10 Ag-1, indicating asymmetric pseudocapacitor possesses excellent rate capability. We observe a linear relationship between IR drop and current density (Fig. S3,
45
supporting information).From the linear fit we conclude that this asymmetric pseudocapacitor has small internal resistance, which favors a high discharge power delivery in the practical applications.
50
Fig. 10. (a) CV curves of asymmetric supercapacitor in 1 M KOH at scan rates of 5, 25, 50, 75, 100, 125 and 150 mVs-1, (b) specific capacitance calculated from CV curves, (c) GCD curves at current density of 1, 2, 3, 5, 7 and 10 Ag-1, and (d) cycling
55
stability test at current density of 1 Ag-1 and inset shows last 10 GCD cycles.
Fig. 10d represents the long cycle stability test of asymmetric pseudocapacitor performed for 2000 cycles in 1 M
60
KOH electrolyte at a constant charge/discharge current density of 1 Ag-1. After 2000 GCD cycles, the asymmetric pseudocapacitor retains ~ 75% of initial capacitance value, which demonstrates a good cyclic performance. The inset in Fig. 10d shows the last 10 cycles, which still possesses a good symmetric charge/discharge
65
characteristic feature proving the long period durability.
Furthermore, On the basis of the charge/discharge test results, the power density (Wkg-1) and energy density (Whkg-1) of asymmetric pseudocapacitor are also calculated using the equations (7) and (8), respectively.39
70 2 ) ( 6 . 3 2 1 V C E S ∆ × =
(7)
RSC
Advances
Accepted
Manuscript
× 3600 ∆ = t E P
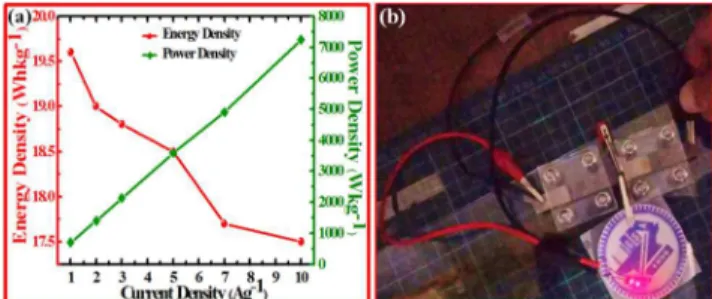
(8) where ∆V is the potential window, t represents discharging time (s). The values of energy density and power density calculated on the basics of equations (7) and (8) are plotted in Fig. 11a. It shows that asymmetric pseudocapacitor exhibits maximum
5
energy density 19.6 Whkg-1 and maximum power density 7245 Wkg-1. Our designed asymmetric pseudocapacitor can light up a red emitting diode, as shown in Fig. 11b.
Fig. 11. (a) Energy density and power density as function of
10
current density, and (b) a red LED light up by two asymmetric supercapacitors connected in series.
Conclusions
In summary, we have synthesized a good quality
15
Co3O4/rGO/CNT nanocomposite powder sample via hydrothermal approach. EPD technique has been utilized to make the electrode of Co3O4/rGO/CNT nanocomposites for supercapacitor application. The XRD and TEM analyses verify the successful synthesis of cubic phase Co3O4 nanoparticles, GO,
20
rGO and CO3O4/rGO/CNT nanocomposites. It has been observed that the concentration of GO (mg/mL) and the ratio of GO/CNTs have significant influence on the electrochemical properties of the nanocomposite material. The 2GCoC nanocomposite exhibits high specific capacitance (850 Fg-1 at 5 mVs-1, and 790 Fg-1 at 1
25
Ag-1), excellent rate capability ~ 81% and ~ 73% capacitance retention after 1000 cycles. Good electrochemical performance of 2GCoC nanocomposite is attributed to the mesopores, good surface area and a conducting network formed by rGO and CNTs in the composite. These results indicate that our designed
30
Co3O4/rGO/CNTs nanocomposite is appropriate for practical pseudocapacitor applications. Furthermore, the asymmetric pseudocapacitor assembled using 2GCoC as an anode and N– rGO as a cathode exhibits excellent (~ 90%) rate capability,
maximum energy density and power density of 19.6 Whkg-1 and
35
7245 Wkg-1, respectively, in 1 M KOH aqueous electrolyte. These results indicate that our designed asymmetric pseudocapacitor is appropriate for practical applications.
Acknowledgements
40
This work was supported by the Ministry of Science and Technology of Taiwan under contract No. MOST 104–3113– E009–003.
Notes and references
45
a
Department of Electronics Engineering and Institute of Electronics, National Chiao Tung University, Hsinchu 300, Taiwan
b
Department of Materials Science and Engineering, National Chiao Tung University, Hsinchu 300, Taiwan
50
*Corresponding authors. Tel: 886-3-5731879; Email:
tseng@cc.nctu.edu.tw (T.Y.Tseng)
1 T. R. Cook, D. K. Dogutan, S. Y. Reece, Y. Surendranath, T.
55
S. Teeth and D. G. Nocera, Chem. Rev., 2010, 110, 6474. 2 A. Chauhan and R. P. Saini, Renew. Sust. Energ. Rev., 2014,
38, 99.
3 H. Jiang, P. S. Lee and C. Li, Energy Environ. Sci., 2013, 6, 41.
60
4 P. Simon and Y. Gogotsi, Nat. Mater., 2008, 7, 845.
5 A. G. Pandolfo and A. F. Hollenkamp, J. Power Sources, 2006, 157, 11.
6 X. Lang, A. Hirata, T. Fujita and M. Chen, Nat. Nanotechnol., 2011, 6, 232.
65
7 L. Zhang and X .S. Zhao, Chem. Soc. Rev., 2009, 38, 2520. 8 G. Wang, L. Zhang and J. Zhang, Chem. Soc. Rev., 2012, 41,
797.
9 S. Vaquero, J. Palma, M. Anderson and R. Marcilla, Int. J. Electrochem. Sci., 2013, 8, 10293.
70
10 G. Yu, X. Xie, L. Pand, Z. Baod and Y. Cui, Nano Energy, 2013, 2, 213.
11 H. Wei, J. Zhu, S. Wu, S. Wei and Z. Guo, Polymer, 2013, 54 1820.
12 Z. Li, Z. Zhou, G. Yun, K. Shi, X. Lv and B. Yang, Nanoscale
75 Res. Lett., 2013, 8, 473.
RSC
Advances
Accepted
Manuscript
13 R. R. Salunkhe, J. Tang, Y. Kamachi, T. Nakato, J. H. Kim and Y. Yamauchi, ACS Nano, 2015, 9, 6288.
14 L. Y. Chen, Y. Hou, J. L. Kang, A. Hirata and M. W. Chen, J. Mater. Chem. A, 2014, 2, 8448.
15 X. Ren, C. Guo, L. Xu, T. Li, L. Hou and Y. Wei, ACS Appl.
5
Mater. Interfaces, 2015, 7, 19930.
16 A. Abdolmaleki, H. Kazerooni, M. B. Gholivand, H. Heydari and A. Pendashteh, Ionics, 2015, 21, 515.
17 C. Guan, X. Qian, X. Wang, Y. Cao, Q. Zhang, A. Li and J. Wang, Nanotechnology, 2015, 26, 094001.
10
18 W. Gu and G. Yushin, Energy Environ., 2014, 3, 424. 19 T. Wang, L. X. Wang, D. L. Wu, W. Xia and D. Z. Jia, Sci.
Rep., 2015, 5, 9591.
20 Z. Wen, X. Wang, S. Mao, Z. Bo, H. Kim, S. Cui, G. Lu , X. Feng and J. Chen, Adv. Mater., 2010, 24, 5610.
15
21 D. C. Marcano, D. V. Kosynkin, J. M. Berlin, A. Sinitskii, Z. Sun, A. Slesarev, L. B. Alemany, W. Lu and J. M. Tour, ACS Nano, 2010, 4, 4806.
22 K. Gopalakrishnan, A. Govindaraj and C. N. R. Rao, J. Mater. Chem. A, 2013, 1, 7563.
20
23 S. Wakeland, R. Martinez, J. K. Grey and C. C. Luhrs, Carbon, 2010, 48, 3463.
24 N. Kumar, A. K. Srivastava, H. S. Patel, B. K. Gupta and G. D. Varma, Eur. J. Inorg. Chem., 2015, 11, 1912.
25 G. Lee G, C. V. Varanasi and J. Liu, Nanoscale, 2015, 7,
25
3181.
26 S. Kondrat, P. Wu, R. Qiao and A. Kornyshev, Nat. Mater., 2014, 13, 387.
27 I. E. Dubois, S. Holgersson, S. Allard and M. E. Malmström, Water-Rock Interaction, 2010, ISBN 978-0-415-60426-0.
30
28 I. E. Dubois, S. Holgersson, S. Allard and M. E. Malmström,
Proceedings in Radiochemistry: A Supplement to
Radiochimica Acta, 2011, 1, 75.
29 B. P. Singh, D. Singh, R. B. Mathur and T. L. Dhami, Nanoscale Res. Lett., 2008, 3, 444.
35
30 C. J. Hung, P. Lin and T. Y. Tseng, J. Power Sources, 2014, 259, 145.
31 L. Cao, M. Lu and H. L. Li, J. Electrochem. Soc., 2005, 152 A871.
32 B. Wang, Q. Liu, J. Han, X. Zhang, J. Wang, Z. Li, H. Yan
40
and L. Liu, J. Mater. Chem. A, 2014, 2, 1137.
33 M. S. Halper and J. C. Ellenbogen, Supercapacitors: A brief overview, MITRE Nanosystems Group (2006).
34 L.B. Kong, J.W. Lang, M. Liu, Y.C. Luo and L. Kang, J. Power Sources, 2009, 194, 1194.
45
35 M.-C. Liu, L. Kang, L.-B. Kong, C. Lu, X.-J. Ma, X.-M. Li and Y.-C. Luo, RSC Adv., 2013, 3, 6472.
36 Z. Wua, X. Pub, X. Jia, Y. Zhua, M. Jinga, Q. Chena and F. Jiaoa, Electrochim Acta, 2015, 174, 238.
37 S. K. Meher, P. Justin and G. R. Rao, ACS Appl. Mater.
50
Interfaces, 2011, 3, 2063.
38 Y. Wang and Q. Chen, ACS Appl. Mater. Interfaces, 2014, 6 6196.
39 J. Bhagwan, A. Sahoo, K. L. Yadav and Y. Sharma, Electrochim. Acta, 2015, 174, 992. 55 60 65 70 75 80 85
RSC
Advances
Accepted
Manuscript
Table of contents entry
5
Demonstration of Co3O4/rGO/CNT nanocomposites electroche- mical properties. The nanocomposite (2GCoC) synthesized with 2 mg/mL GO concentration and GO/CNTs ratio of 10:1 shows best electrochemical performance. Asymmetric supercapacitor
10
designed with 2GCoC anode and crumpled N-doped graphene as cathode exhibits maximum energy density and power density of 19.6 Whkg-1 and 7245 Wkg-1, respectively, in 1 M KOH aqueous electrolyte. 15