Mingsian R. Bai
e-mail: [email protected]Yenchih Lu
Department of Mechanical Engineering, National Chiao-Tung University, 1001 Ta-Hsueh Road, Hsin-Chu 300, Taiwan, Republic of ChinaOptimal Implementation of
Miniature Piezoelectric Panel
Speakers Using the Taguchi
Method and Genetic Algorithm
A thin and miniature piezoelectric panel speaker has been developed in this paper. The system is modeled using the energy method in conjunction with the finite element method. The electrical system, mechanical system and acoustic loading are considered in com-bined fashion. The genetic algorithm (GA) and the Taguchi method are employed to achieve optimal designs with low fundamental frequency and high acoustic output. The designs resulting from the optimization are then implemented and evaluated by experi-ments. These experiments were carried out on the basis of quantitative and subjective performance measures. The experimental results indicate that the piezoelectric panel speakers are capable of producing comparable acoustic output with significantly less electrical power than the conventional voice-coil panel speakers.
关DOI: 10.1115/1.1759695兴
1 Introduction
The 3C industry 共Computer, Communication, and Consumer兲 has recently emerged as one of the most rapidly growing indus-tries of modern days. Commercial products such as personal data assistants共PDAs兲, mobile phones, MP3 players are currently mak-ing their way into the market and everyone’s life. From the design point of view, one of the chief concerns of 3C products is minia-turization. This is particularly true for the loudspeaker that is an important component of 3C products. Panel speakers provide a potential solution to meet the requirement of miniaturization关1兴. Apart from small size, panel speakers also offer advantages of omni-directional radiation, linearity, insensitivity to room bound-ary condition and bi-polar radiation关2兴. A detailed analysis of the panel speaker can be found in 关1兴. Despite all the advantages, panel speakers suffer from two drawbacks that limit their use in practical 3C applications. First, the exciter for a panel speaker is traditionally the voice-coil type and could reach only approxi-mately 2 mm thickness, which is still too thick to apply in many 3C products such as mobile phones. Second, the electro-acoustic efficiency driven by the voice-coil exciters was found to be quite low关1兴, which presents problem of power consumption to mobile electronic products. These physical limitations associated with the conventional voice-coil exciters hence motivate the present devel-opment of an alternative way of excitation for panel speakers.
In this paper, panel speakers excited by piezoelectric ceramics are proposed, in an attempt to overcome the problems encountered in voice-coil exciters关3兴. Relatively high efficiency of piezoelec-tric material makes the piezoelecpiezoelec-tric panel speaker an ideal device for many battery-powered products. Although the piezoelectric panel speakers have been around for some time, these devices mainly exist in the forms of narrowband acoustic radiators such as buzzers, sounders, sirens, etc., where sound quality is generally not of the major concern. By contrast, this work seeks to meet the requirements of quality loudspeakers for speech and music ren-dering. To this end, optimization techniques are utilized to achieve practical designs with minimum fundamental frequency and the maximum sound pressure output.
This paper is organized as follows. First, the dynamic model of
the piezoelectric speaker was derived using the energy method and the finite element method共FEM兲. Unlike Ref. 关1兴, the electri-cal system, mechanielectri-cal system and acoustic loading are consid-ered as a coupled system during dynamic modeling. This is im-portant for a light structure like a panel speaker, especially for low frequencies where acoustic mass loading is not negligible. Sec-ond, the Taguchi method and the genetic algorithm共GA兲 are em-ployed to optimize the speaker design. The Taguchi method is used for a preliminary search, whereas the GA is used to ‘‘fine tune’’ the design parameters. Designs resulting from the optimiza-tion are then implemented and evaluated experimentally. In order to evaluate the speaker performance, quantitative measures as well as subjective indices are measured and summarized.
2 Modeling of Piezoelectric Panel Speakers
In the following derivation of equation of motion for the piezo-electric panel speaker, the piezo-electrical system, mechanical system and the acoustic loading are modeled as a coupled system.
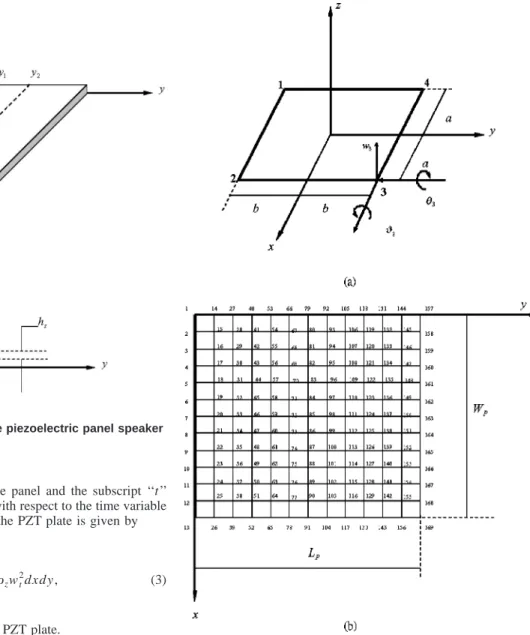
2.1 Energy Method and Variation Principle. The basic structure of a piezoelectric panel speaker consists of a rectangular piezoelectric ceramic plate and a thin rectangular panel of length Lpand width Wp, as shown in Fig. 1. Let the lateral displacement field be w⫽w(x,y,t). The bending strain energy of the panel is given by关4兴 Up⫽1 2Dp
冕
0 Lp冕
0 Wp 关wxx2 ⫹wy y 2 ⫹2wxx wy y⫹2共1⫺兲wxy2兴dxdy, (1) where Dp⫽Ephp 3/12(1⫺2) is the bending stiffness of the panel, hpis the thickness of the panel, Epis the Young’s modulus of the panel, and is the Poisson’s ratio of the panel. The subscript ‘‘xx’’ denotes the second partial derivative with respect to the space coordinate x; similar rule applies to the other variables. It should be clear from the context, where all subscripts in the following equations that are not in the definition of the variable should be interpreted as differentiation with respect to the variable. In addi-tion, the kinetic energy of the panel is given by
Tp⫽1 2
冕
0 Lp冕
0 Wp pwt 2 dxdy , (2)Contributed by the Technical Committee on Vibration and Sound for publication in the JOURNAL OFVIBRATION ANDACOUSTICS. Manuscript received August 2003; Revised January 2004. Associate Editor: R. F. Keltie.
wherep is the area density of the panel and the subscript ‘‘t’’ denotes the first partial derivative with respect to the time variable t. Similarly, the kinetic energy of the PZT plate is given by
Tz⫽1 2
冕
x 1 x2冕
y1 y2 zwt2dxdy , (3)wherezis the area density of the PZT plate.
In this paper, the piezoelectric equations are based on the h-form and the PZT plate is a hexagonal crystal class共6mm兲. The h-form of the linear piezoelectric equations is written as
冋
T1 T2 T6 E3册
⫽冋
c11 D c12 D 0 ⫺h31 c12 D c11 D 0 ⫺h31 0 0 c66 D 0 ⫺h31 ⫺h31 0 33 S册
冋
S1 S2 S6 D3册
, (4)where T is the stress, S is the strain, D is the dielectric displace-ment, E is the field strength, h is the piezoelectric voltage con-stant, cD is the elastic stiffness under the condition of constant dielectric displacement, andSis the permittivity under the con-dition of constant strain.
By the Kirchhoff plate theory, it is assumed that the transverse shear deformation is zero and angles of rotation are small. The strains are assumed to follow
S1⫽⫺zwxx, S2⫽⫺zwy y, S6⫽⫺2zwx y, (5)
By Eqs.共4兲 and 共5兲, the internal energy of the PZT plate can be written as关5兴 Uz⫽21
冕
hp h冕
y1 y2冕
x1 x2 共T1S1⫹T2S2⫹T6S6⫹E3D3兲dxdydz ⫽c11 D共h3⫺hp3兲 6冕
y1 y2冕
x1 x2 共wxx2⫹w y y 2兲dxdy ⫹c12 D共h3⫺h p 3兲 3冕
y1 y2冕
x1 x2 wxxwy ydxdy ⫹h31D3共h2⫺hp 2兲 2冕
y 1 y2冕
x1 x2 共wxx⫹wy y兲dxdy ⫹33 S D3 2共h⫺hp兲 2冕
y1 y2冕
x1 x2 dxdy ⫺2c66 D共h3⫺hp3兲 3冕
y 1 y2冕
x1 x2 wxy 2 dxdy , (6) where h⫽hp⫹hz. Fig. 1 Schematic diagram of the piezoelectric panel speakerFig. 2 FEM mesh structure for modeling the piezoelectric panel speaker„a…a 12-dof plate element, with dofs indicated at node 3„b…complete mesh with 144 elements for the piezoelec-tric speaker
On the other hand, the virtual work done by the non-inertial forces and the external voltage can be expressed as
␦Wvir⫽
冕
y1 y2冕
x1 x2 f共x,y,t兲␦wdxdy⫹冕
y1 y2冕
x1 x2 vz共t兲␦D3dxdy , (7) where f (x,y ,t) denotes the external force on the surface andvz(t) denotes the voltage applied to the PZT.2.2 FEM Model. Since the piezoelectric ceramic and the vibrating panel are very thin, two-dimensional finite elements should suffice in the subsequent analysis. In the FEM formulation, the lateral displacement w of an element is interpolated by third degree polynomials of physical coordinates关6兴
w⫽xa, (8)
where
x⫽关1,x,y,x2,xy ,y2,x3,x2y ,xy2,y3,x3y ,xy3兴
is the physical coordinate vector and
a⫽关a1,a2,a3,a4,a5,a6,a7,a8,a9,a10,a11,a12兴T
is the coefficient vector to be determined. Assume the element is of length 2b and width 2a. The nodal degree of freedoms共dof兲 consist of lateral deflections wi and rotations wi/x⫽i and wi/y⫽i, i⫽1, 2, 3, 4, as shown in Fig. 2(a). The dofs of the element are grouped into a vector
d⫽关w1,1,1,w2,2,2,w3,3,3,w4,4,4兴T
The mesh configuration of finite elements is shown in Fig. 2(b). To express the aj, j⫽1,2, . . . ,12 in terms of the physical ordi-nates and the slopes at four corners, (x,y )⫽(⫺a,⫺b), (x,y) ⫽(a,⫺b), (x,y)⫽(a,b) and (x,y)⫽(⫺a,b), we make the fol-lowing substitutions
w⫽w1, w/x⫽1, w/y⫽1 at 共x,y兲⫽共⫺a,⫺b兲, w⫽w2, w/x⫽2, w/y⫽2 at 共x,y兲⫽共a,⫺b兲,
w⫽w3, w/x⫽3, w/y⫽3 at 共x,y兲⫽共a,b兲, w⫽w4, w/x⫽4, w/y⫽4 at 共x,y兲⫽共⫺a,b兲
into Eq.共8兲 and obtain
冤
w1 1 1 ] w4 4 4冥
⫽冤
1 ⫺a ⫺b a2 ab b2 ⫺a3 ⫺a2b ⫺ab2 ⫺b3 a3b ab3
0 1 0 ⫺2a ⫺b 0 3a2 2ab b2 0 ⫺3a2b ⫺b3
0 0 1 0 ⫺a ⫺2b 0 a2 2ab 3b2 ⫺a3 ⫺3ab2
] ] ]
1 ⫺a b a2 ⫺ab b2 ⫺a3 a2b ⫺ab2 b3 ⫺a3b ⫺ab3
0 1 0 ⫺2a b 0 3a2 ⫺2ab b2 0 3a2b b3
0 0 1 0 ⫺a 2b 0 a2 ⫺2ab 3b2 ⫺a3 ⫺3ab3
冥
冤
a1 a2 a3 ] a10 a11 a12
冥
or in matrix notation d⫽Ta Therefore, a⫽T⫺1d (9)With Eq.共9兲 inserted into 共8兲, the lateral displacement w of the element can be rewritten as
w⫽xT⫺1d (10)
On the other hand, the displacement field w can also be inter-polated over an element using the shape function matrix N
w⫽Nd (11)
which identifies the shape function matrix N as
N⫽xT⫺1 (12)
Substituting Eq.共11兲 into 共6兲 and assembling the element stiff-ness matrices into the global matrix, the internal energy of the PZT plate can be expressed as
Uz⫽I1DTK1D⫹I2DTK2D⫹I3DTK3D⫹I4DTK4q⫹I5q2
⫺I6DTK6D, (13) where I1⫽c11 D共h3⫺hp3兲/6, I 2⫽c11 D共h3⫺hp3兲/6, I 3⫽c12 D共h3⫺hp3兲/3, I4⫽h31共h2⫺hp2兲/2Ae, I5⫽33共h⫺hp兲/2Ae, I6⫽2c66 D共h3⫺hp3兲/3, K1⫽
兺
n⫽1 s冕
⫺b b冕
⫺a a B1 T B1dxdy , wxx⫽B1d, B1⫽2N/x2, K2⫽兺
n⫽1 s冕
⫺b b冕
⫺a aB2TB2dxdy , wy y⫽B2d, B2⫽2N/y2,
K3⫽
兺
n⫽1 s冕
⫺b b冕
⫺a a B1 T B2dxdy , K4⫽兺
n⫽1 s冕
⫺b b冕
⫺a a 共B1⫹B2兲Tdxdy K6⫽兺
n⫽1 s冕
⫺b b冕
⫺a a B5 T B5dxdy , wxy⫽B5d, B5⫽2N/xy,D⫽兺
n⫽1 s d,where s is the total number of elements, D3⫽q/Ae, q is the
electric charge on the electrodes, Ae is the area of each element and D is the global dof vector.
By the same token, the strain energy and kinetic energy of the vibrating panel can be expressed as
Up⫽12DTK7D, (14)
Tp⫽12pD˙ T
K8D˙ , (15)
In addition, the kinetic energy of the PZT plate can be written as Tz⫽12zD˙
T
K9D˙ , (16)
The virtual work done by the external force and electric charge is expressed as
␦Wvir⫽␦DTf⫹vz␦q, (17)
The relevant symbols in Eqs.共14兲–共17兲 are defined as follows
D˙⫽dD/dt,K7⫽
冕
⫺b b冕
⫺a a B7 T DKB7dxdy , B7 T⫽关B 1 B2 2B5兴, DK⫽冋
Dp Dp 0 Dp Dp 0 0 0 共1⫺兲 2 Dp册
, K8⫽冕
⫺b b冕
⫺a a NTNdxdy ,K9⫽冕
⫺b b冕
⫺a a NTNdxdy , f⫽兺
n⫽1 s冕
⫺b b冕
⫺a a f共x,y,t兲dxdy,vz⫽1 Aen兺
⫽1 s冕
⫺b b冕
⫺a a vz共t兲dxdy 2.3 The Lagrange’s Equation. The dynamic model of the piezoelectric panel speaker can be obtained by substituting the preceding energy terms into the Lagrange’s equation冦
d dt冉
L D˙T冊
⫺ L DT⫽f ⫺L q⫽vz , (18)where the Lagrangian L⫽Up⫹Uz⫺Tp⫺Tz. With some manipu-lations, the dynamic model of a piezoelectric panel speaker can be shown as
再
关共pK8⫹zK9兲2⫺2I1K1⫺2I2K2⫺2I3K3⫹2I6K6⫺K7兴D⫺I4K4q⫽f ⫺I4K4T
D⫺2I5q⫽vz , (19)
where D˙⫽v⫽ jD, D¨⫽⫺2D.
2.4 Acoustic Loading. Although the acoustic loading is a distributed type of external force, an analysis can still be carried out, using the following discrete approximation. Let p and v be the pressure vector and velocity vector measured at discrete points on the structure surface. In physical coordinates, p and v can be related with a radiation impedance matrix Z关7兴
p⫽Zv (20)
For a baffled planar radiator, the matrix Z can be approximated as
Z⫽acs
冤
1⫺e⫺ jk冑Ae/ jkAe 2 e⫺ jkr12 r12 ¯ jkAe 2 e⫺ jkr1n r1n jkAe 2 e⫺ jkr21 r21 1⫺e⫺ jk冑Ae/ ¯ ] ] ] ] jkAe 2 e⫺ jkrm1 rm1 ¯ ¯ 1⫺e⫺ jk冑Ae/冥
, (21) wherea is the air density, csis the sound speed, k is the wave number, rmn is the distance between the nodes m and n (rmn ⫽rnm, 1⭐m,n⭐N). Thus, the external force vector f is simply the pressure multiplied by the effective element area Aef⫽Aep⫽AeZv⫽ jAeZD (22) 2.5 Proportional Damping. In order to incorporate the damping mechanism into the system, proportional damping关8兴 is assumed in this paper for simplicity. That is, the damping matrix
C is given by
C⫽␣Md⫹Kd, (23)
where␣ and  are constants. In our problem, 100⬍␣⬍250 and 5⫻10⫺7⬍⬍1.5⫻10⫺6. Mdand Kddenote the mass matrix and stiffness matrix, respectively, and are calculated according to the following equations
Md⫽2I5共lK8⫹zK9兲,
Kd⫽2I5共⫺2I1K1⫺2I2K2⫺2I3K3⫹2I6K6⫺K7兲⫹I4K4K4 T
With the damping matrix C added to Eq.共19兲, the displacement vector D can be solved as follows
D⫽⫺I4共K⫹ jC兲⫺1K4vz, (24) where
K⫽兵2I5关共pK8⫹zK9兲2⫺2I1K1⫺2I2K2⫺2I3K3⫹2I6K6 ⫺K7⫺ jAeZ兴⫹I4K4K4
T其
2.6 Radiated Sound Pressure. Now that the surface dis-placements have been obtained from Eq.共24兲, the radiated sound pressure at any field point can be calculated using the following matrix Eq.关7兴
pf ar⫽Ev, (25)
where pf aris the radiated sound pressure vector, v is the surface velocity vector that can be calculated by differentiating displace-ments obtained from Eq. 共24兲, and E is the propagation matrix. For a baffled planar radiator, the propagation matrix E can be approximated as E⫽ j0cskAe 2
冤
e⫺ jkr11 r11 e⫺ jkr12 r12 ¯ e⫺ jkr1n r1n e⫺ jkr21 r21 e⫺ jkr22 r22 ¯ e⫺ jkr2n r11 ] ] ] e⫺ jkrm1 rm1 e⫺ jkrm2 rm2 ¯ e⫺ jkrmn rmn冥
, (26)where Ae is the effective element area and rmn is the distance between the element n and the field point m.
3 Optimal Design of Piezoelectric Panel Speakers 3.1 Taguchi Method. The Taguchi method is an experimen-tal design procedure well suited for examining a multi-factor de-sign problem using a minimum number of observations 关9兴. A general Taguchi procedure provides three kinds of functions: sys-tem design, parameter design, and tolerance design. For our prob-lem at hand, we focus primarily on parameter design. The goal of parameter design is to pin-point the optimal configuration of a system according to a cost function. The cost function we wish to maximize in our problem is
ft⫽10
( pavg⫺94)/20
f0 ⫻10,000,
(27)
where f0 is the first resonance frequency with sound pressure
level greater than 40 dB, pavg is the average of magnitude of
sound pressure level共in dB兲 above the frequency f0.
To illustrate the Taguchi procedure, we start with a L8(4⫻24)
orthogonal array shown in Table 1. The notation L8(4⫻2 4
) means that the experimental design requires eight observations and five factors: the first one at four levels and the other four at two levels. In Table 1, the numbers 1⬃2 indicate the corresponding levels of a factor. The values of cost function are calculated according to the orthogonal array at the upper part of Table 1. For example, the value of cost function corresponding to the second level of factor B共Young’s modulus of panel material兲 is the algebraic average of the 4 occurrences of level 2 among the 8 runs:
fBt⫽fBt2⫹ fBt4⫹ fBt6⫹ fBt8
4 ⫽24.7788,
Similar procedure applies to the other entries of cost function calculation. The larger values of the cost function correspond to better performances achieved by a particular combination of pa-rameter.
A preliminary search of optimal design of the panel speaker is summarized in Tables 1 and 2. In each table, the dimensions of the panel are 42 mm⫻84 mm⫻0.1 mm. The parameters considered in the design are the PZT position, Young’s modulus of panel
material, PZT shape, ratio of PZT area versus panel area, and suspension. Various levels of each parameter are examined in these tables. Because there are many levels of PZT positions 共fac-tor A兲, we subdivided the cases into 3 tables. The fundamental frequency f0of Run 4 appears somewhat high because, according
to the setting in Table 1, the panel speaker in Run 4 is made of stiffer material 共the Young’s modulus⫽60 GPa) and is simply supported共as opposed to the compliant support in the other case兲. Higher damping results in larger cost function. Damping does help the acoustic output at least at the nearfield. From the results, we also found that large values of cost function occurred when the PZT position is between nodes 31 and 68, Young’s modulus of panel material is between 0.6 and 600 GPa, and the PZT shape is square. As indicated by the results obtained using the Taguchi procedure, the ratio of PZT area versus the panel area should be as large as possible. This is due to the fact that the cost function, with a modal analysis based on the fundamental mode, can be shown to be a monotonically increasing function of area, and a monotoni-cally decreasing function of thickness. Hence, the area of the PZT is no longer considered in the following GA optimization. The type of suspension appeared inconsequential. Next, we decided to ‘‘fine-tune’’ only two design parameters, the Young’s modulus of panel and the PZT position.
3.2 The Genetic Algorithm„GA…. GA is one of the
pow-erful methods in solving optimization problems 关10兴. Analogous to the natural selection of evolution, a typical GA session involves three basic genetic operations, reproduction, crossover and muta-tion. These operations are used in each generation to generate new population with different chromosomes in which the design pa-rameters are encoded. With evolution of sufficient number of gen-erations, the optimal solution corresponding to the largest fitness function can be found. The principal difference between GA and other optimization methods is that GA operates on multiple start-ing points in random fashion, makstart-ing it less susceptible to the problem of local optima.
The first step of GA is to encode the design parameters into binary strings called chromosomes. The resolution of a parameter space is determined by the formula
Table 1 The first set of optimal parameters obtained using the Taguchi method. The upper part is theL8„4Ã24…orthogonal array Factor Run A B C D E 1 1 1 1 1 1 2 1 2 2 2 2 3 2 1 1 2 2 4 2 2 2 1 1 5 3 1 2 1 2 6 3 2 1 2 1 7 4 1 2 2 1 8 4 2 1 1 2 Factor Level The ftof each level
A共PZT position兲 1 2 3 4 57 55 31 29 25.0096 40.0299 37.1684 6.5007 B共Young’s modulus of Panel material兲 6 GPa 60 GPa 29.5755 24.7788 C共PZT shape兲 1:1 1:2 45.0582 9.2960 D共PZT Area: Panel Area兲 1:9 1:4 10.1983 44.1560
E共Suspension兲 Simply supported Spring supported
26.1170 28.2373
Run 1 2 3 4 5 6 7 8
f0 (Hz) 150 200 100 1000 200 150 500 300
pavg (dB) 86.2292 87.1675 91.8806 78.6667 75.2395 94.2445 84.8024 79.1988
REp⫽ Ep U⫺EpL 2lp⫺1 , (28) where Ep U and Ep L
are the upper and lower limits of the parameter to encode, e.g., Young’s modulus of the panel. If 1 GPa⭐Ep ⭐200 GPa and the desired resolution is REp⫽0.1945, lp⫽10 and if Ep⫽2.7507, the chromosome is encoded as 关0000001010兴.
The Fitness function serves as the performance index for GA. A chromosome with high fitness has higher probability of reproduc-ing offsprreproduc-ing in the next generation. Our goal of the GA optimi-zation is to minimize the fundamental frequency f0and to
maxi-mize the average sound pressure level pavgin the bandwidth 12.8
kHz, as shown in Fig. 3(a). The same fitness function defined in Eq.共27兲 is used in the optimization procedure.
Reproduction directs the search of GA towards the best indi-viduals. The reproduction probability of the chromosome is deter-mined by the fitness function. The chromosome of the present population is reproduced in the next generation according to the probability
Si⫽ fci 兺kP⫽1l
fck
, (29)
where fciis the fitness function of the ithchromosome and Plis the population size. For instance, there are four chromosomes, c1⬃c4, in the 0thgeneration with fitness functions 30, 9, 68 and
52. Substituting these values into Eq.共29兲 leads to the reproduc-tion probabilities S1⫽0.1887, S2⫽0.0566, S3⫽0.4277, S4 ⫽0.3271, respectively. These probabilities are then concatenated into a real line, as shown in Fig. 3(b). Clearly, the chromosomes c3and c4are the most likely to reproduce in the next generation.
In the present population, four random numbers between 0 and 1 are generated. For example, if the four random numbers are 0.3644, 0.1835, 0.9237 and 0.4427, the chromosomes survive to next generation will be c3, c1, c4and c3, respectively.
Crossover serves to exchange the information of chromosomes via a probabilistic process in the mating pool. First, the crossover ratio Cr is defined. In general, 0.8⭐Cr⭐1 and we choose Cr ⫽0.9. Two chromosomes in the present population are selected randomly. Second, an arbitrary splice point at the chromosomes is selected. Third, the chromosomes codes after the splice point are interchanged. To illustrate, assume two chromosomes c1 and c2
with the splice point at the third bit: c1⫽011⌬0111 and c2 ⫽101⌬1001. After crossover, two new chromosomes are gener-ated: c˜1⫽011⌬1001 and c˜2⫽101⌬0111.
However, the gene will become increasingly homogeneous if one gene begins to dominate after several generations and even-tually results in premature convergence. To alleviate this problem, mutation is introduced into the GA procedure. Let the mutation ratio be Mr. In general, 0⭐Mr⭐0.01 and we choose Mr⫽0.01. The mutation point is determined randomly. Mutation is done by alternating the gene from zero to one, and vice versa. For ex-ample, a chromosome c1with the mutation point at the third bit is c1⫽101⌬10100. After mutation, the chromosome becomes c˜1 ⫽100⌬10100.
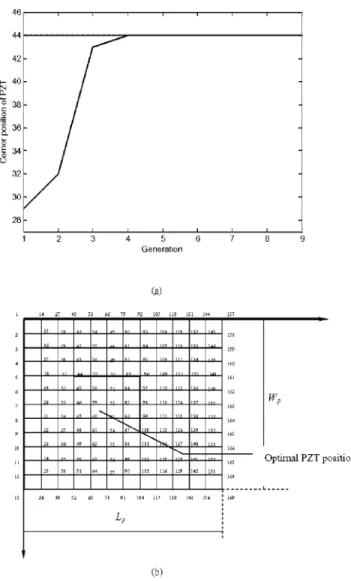
The aforementioned GA procedure was applied to the design of the piezoelectric panel speaker. The parameters to optimize in-clude the PZT position and the Young’s modulus of the panel. The learning curve of the PZT position is shown in Fig. 4(a). With only 5 iterations, the fitness function has converged. From Fig. 4(b), we found the optimal PZT position on the panel to be 1/4 of long side, 1/3 of the short side. On the other hand, the learning Table 2 The second and third sets of optimal parameters obtained using the Taguchi method
Factor
Level The ftof each level
A共PZT position兲 1 2 3 4 57 56 81 43 19.6073 42.2398 24.6517 36.0920 B共Young’s modulus of Panel material兲 6 GPa 600 GPa 32.4006 28.8948 C共PZT shape兲 1:1 1:3 59.0211 2.2743 D共PZT Area: Panel Area兲 36:144 49:144 29.1084 32.1870
E共Suspension兲 Simply supported Spring supported
20.5801 40.7153 Run 1 2 3 4 5 6 7 8 f0 (Hz) 150 400 100 1200 250 150 900 150 pavg (dB) 89.1464 66.7733 92.4828 69.6750 78.2962 90.1393 72.5775 94.5764 Factor Level The ftof each level
A共PZT position兲 1 2 3 4 33 32 68 69 26.7669 49.9882 57.3610 23.7653 B共Young’s modulus of Panel material兲 6 GPa 0.6 GPa 37.9973 40.9434 C共PZT shape兲 1:1 1:4 77.8504 1.0902 D共PZT Area: Panel Area兲 49:144 64:144 25.2752 53.6655
E共Suspension兲 Simply supported Spring supported
41.9260 37.0147
Run 1 2 3 4 5 6 7 8
f0 (Hz) 100 150 100 800 750 50 1050 150
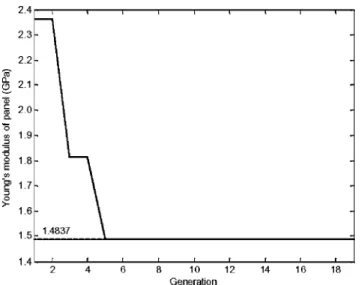
curve of the Young’s modulus of the panel is shown in Fig. 5. The optimal Young’s modulus is found within approximately 6 itera-tions. Similarly, the optimal Young’s modulus of the panel is found to be 1.48 GPa.
In addition, the Taguchi method was used again to reach a final design. The dimensions of the panel are 35 mm⫻25 mm ⫻0.1 mm, which are close to those of a mobile phone. The pa-rameters to optimize are the PZT shape, panel material, damping, perforation of cabinet and suspension. The results are summarized in Table 3. From Table 3(a), the optimal design was found to be: PZT shape is a rectangular plate (2 cm⫻2 cm or 1.5 cm⫻3 cm) or a circular disk with radius 1 cm, treated with damping, carbon fiber (0°, 90°), no perforation, and long side suspended. Simi-larly, from Table 3(b), the optimal design was found to be: car-bon fiber (0°, 90°), PZT shape is rectangular (1.5 cm⫻3 cm), treated with damping, no perforation, and suspended with foam material.
4 Numerical Simulation and Experimental Investiga-tions
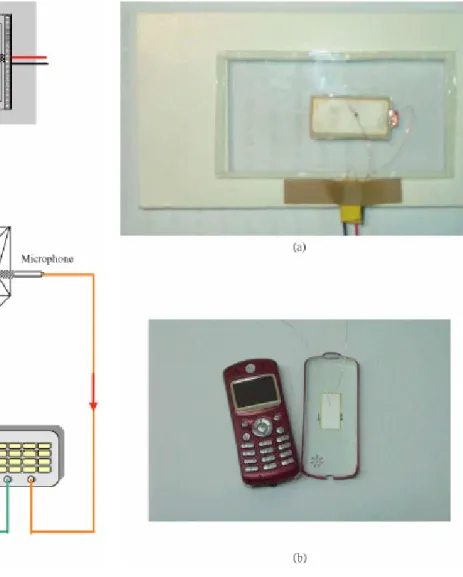
In this section, numerical simulations and the experimental in-vestigations were undertaken to verify the proposed optimal de-signs of the piezoelectric panel speaker. The piezoelectric panel speakers are embedded in a baffle while testing and measured in an anechoic room. The implemented piezoelectric panel speaker and experimental arrangement are shown in Fig. 6. The relevant data of the PZT and the panel are summarized in Table 4. The piezoelectric panel speaker implemented on a practical mobile phone is also shown in Fig. 7.
4.1 Frequency Response of On-axis Sound Pressure. The on-axis pressure at 0.5 m from the baffled piezoelectric panel speaker was measured. Random signal of 30 Vrms, band-limited to 12.8 kHz was used as the input. This input voltage level may look higher than the input level used in common voice-coil loud-speakers. This is due to the high input capacitive impedance of the PZT, where a high voltage but small current driver is generally required. Thus, a DC-DC converter is needed to boost the battery voltage to the required level. Based on Eqs. 共24兲 and 共25兲, the frequency responses obtained from experiment and the simulation are compared in Fig. 8, where the condition of damping is as-sumed as␣⫽150,⫽10⫺6. The results of the piezoelectric panel speaker model are in reasonable agreement with the experiment in terms of gain level and the first resonance. The discrepancy of the second resonance could be due to mismatch of boundary condi-tions and material constants between the numerical simulation and the experiment. In particular, the effective stiffness and damping at the suspension is very difficult to model. This could contribute to the errors in the frequency response at high order modes.
Using the FEM model as a simulation platform and Taguchi/GA as an optimization tool, we further examine the design configura-tions that maximize the ratio of average gain level and the funda-mental frequency. Figure 9 shows the effect of the PZT positions. The optimal design共PZT at 1/4 of long side, 1/3 of the short side, as shown in Fig. 4(b)) results in f0⫽232 Hz, pavg⫽68.55 dB, Fig. 3 Pictorial descriptions for optimization of panel speaker
design„a… frequency response. f0 is the first resonance fre-quency greater than 40 dB.pavg is average sound pressure above the frequencyf0 „b… the reproduction probabilities of four chromosomes, c1Èc4, with fitness functions, 30, 9, 68, and 52, respectively, concatenated in a real line.
Fig. 4 Optimization of panel speaker design using GA„a…the learning curve of the position of PZT. The result has converged within about 5 iterations.„b…The optimal position of PZT found by GA.
which amounts to the cost function 0.30, while a non-optimal design共PZT mounted at the center兲 results in f0⫽266 Hz, pavg
⫽67.26 dB, which amounts to the cost function 0.25. The design at the optimal position of the PZT performed better than using a non-optimal one. The first fundamental resonance frequency of the optimal position reduces to approximately 50 Hz. In Fig. 10, the frequency responses of the piezoelectric panel speakers are compared for two panel materials with different Young’s modulus.
The Young’s modulus of the PC panel is 2.7 GPa, which is close to the optimal value obtained from the GA. This nearly optimal design results in f0⫽240 Hz, pavg⫽80.61 dB, which amounts to
the cost function 0.34, while a non-optimal design共copper兲 results in f0⫽224 Hz, pavg⫽66.21 dB, which amounts to the cost
func-tion 0.29. The sound pressure level produced by the PC panel is about 14 dB higher than that produced by the non-optimal copper panel.
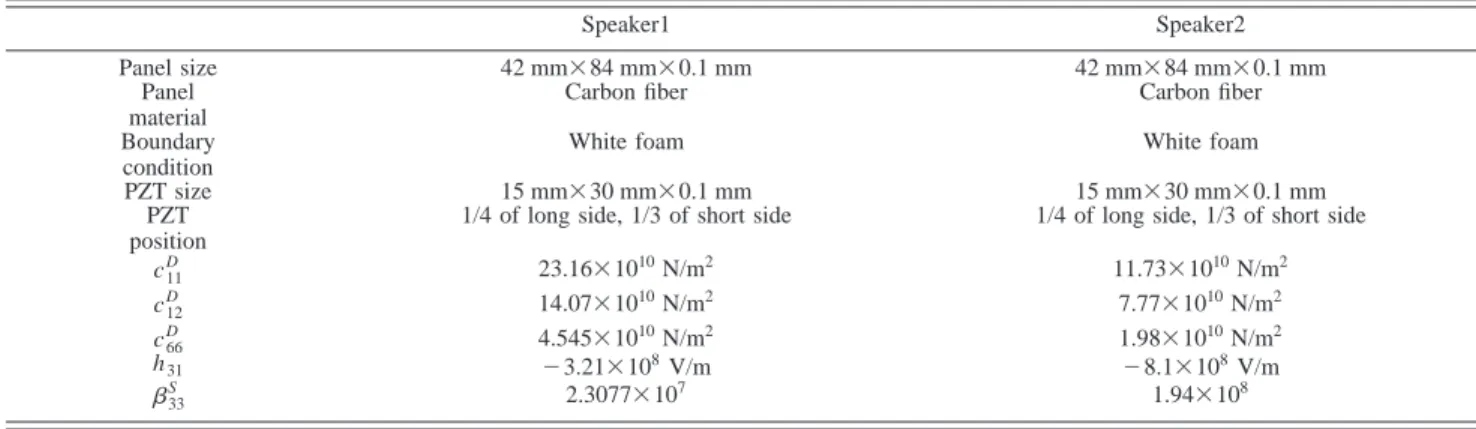
4.2 Sensitivity. Sensitivity was also employed as a perfor-mance index in this paper. The input signal is the random noise of 30 Vrms, band-limited to 12.8 kHz. The relevant data of the panel speakers are listed in Table 5. Sound pressure level was measured on-axis at the distance 0.5 m from the source, under the free-field condition. With 0.117 W input electric power, the sensitivity of Speaker1 measured 88.3 dB. The same measurement was repeated for another panel speaker driven by a different PZT material. With 0.078 W input electric power, the sensitivity of Speaker2 mea-sured only 80.2 dB. These results suggest a higher piezoelectric coefficient (h31) leads to higher sensitivity.
4.3 Efficiency. The efficiency is defined as the ratio of the radiated acoustical power to the input electrical power. The input electrical power is calculated according to
Win⬇1 2
兺
i⫽1 N E关兩Vi兩2兴Re共Zi兲 兩Zi兩2 ⌬ f ⫽ 1 2兺
i⫽1 N PvviRe冉
1 Zi冊
⌬ f (30) where N is number of frequencies, Vi and Zi are the Fourier transforms of the input voltage and the electrical impedance at the ith frequency, E关.兴 is the expectation operator, and Pvvi is the power spectral density of the input voltage at the ith frequency.Fig. 5 The learning curve of the optimal Young’s modulus of panel. The result has converged within about 6 iterations.
Table 3 The optimal configurations determined by the Taguchi method for a GA session
Factor
Level The ftof each level
A共PZT shape兲 1 2 3 4
Disk (r⫽1 cm) Plate (1 cm⫻1 cm) Plate (2 cm⫻2 cm) Plate (1.5 cm⫻3 cm)
0.4054 0.0771 0.4478 0.5008
B共Damping兲 With damping Without damping
0.4964 0.2192
C共Panel material兲 (Thickness⫽0.1 mm)
Carbon fiber (0°,0°) Carbon fiber (0°,90°)
0.3036 0.4119
D共Perforation兲 Perforation No perforation
0.2550 0.4605
E共Suspension兲 Long side suspended Short side suspended
0.4965 0.2190 Run 1 2 3 4 5 6 7 8 f (Hz) 1200 700 2000 2200 500 1600 1200 3000 pavg (dB) 70 60 62 50 60 72 75 60 Factor Level The ftof each level
A共Panel material兲 (Thickness⫽0.1 mm)
1 2 3 4
Laminate Carbon fiber (0°,90°) Carbon fiber (0°,0°) Copper
0.2127 1.4561 0.9592 0.9930
B共PZT shape兲 Plate (1.5 cm⫻3 cm) Plate (2 cm⫻2 cm)
0.7107 1.0998
C共Damping兲 Without damping With damping
0.5873 1.2231
D共Perforation兲 Perforation No perforation
0.7845 1.0260
E共Suspension兲 White foam Black foam
1.5516 0.2589
Run 1 2 3 4 5 6 7 8
f0 (Hz) 1400 1000 1900 800 2000 700 750 2450
In this work, ISO 3745 was employed for measuring the radi-ated sound power in the anechoic room关11兴. The measured effi-ciency of the Speakers 1, 2 and 5 were ⫽0.76%, 0.56% and 0.78%, respectively. As expected, the material with a higher pi-ezoelectric coefficient (h31) produced higher efficiency. For
refer-ence, the efficiency of a panel speaker driven by a voice-coil Fig. 6 Experimental arrangement of the piezoelectric panel speaker „a… physical construction of the piezoelectric panel speaker„b…the experimental setup for the performance mea-surement.
Fig. 7 Photos of piezoelectric panel speakers„a…a baffled pi-ezoelectric panel speaker. The panel material is transparent PC. „b… A piezoelectric panel speaker implemented on a mobile phone.
Fig. 8 Comparison of the on-axis pressure response of the FEM simulation and the measurement
Table 4 Relevant data of the PZT and the panel used in the simulation and experiments, to verify the FEM model. Dimen-sions of the piezoelectric panel speaker are 60 mmÃ60 mm
Ã0.3 mm.
Parameter Value
Aluminum plate size 60 mm⫻60 mm⫻0.2 mm density 2790 kg/m3
Young’s modulus 73.1 GPa Poisson’s ratio 0.33 PZT size 20 mm⫻20 mm⫻0.1 mm 33 S 2.3077⫻107 h31 ⫺3.21⫻108V/m c11 D 23.16⫻1010N/m2 c12 D 14.07⫻1010N/m2 c66 D 4.545⫻1010N/m2 Õ
exciter was found to be 0.075%, which is almost one order less than the piezoelectric counter part. This indicates that piezoelec-tric panel speakers are very efficient and well suited for many battery-powered devices.
4.4 Subjective Listening Test. As mentioned previously, one of the goals of the present study is to enhance the piezoelec-tric device to a level for audio purpose. Therefore, subjective lis-tening test were carried out to assess the audio quality delivered by the piezoelectric panel speakers. Five kinds of piezoelectric panel speakers, listed in Table 6, were used in the listening test. Four subjective indices, loudness, clarity, liveness, and warmth are employed in the test. Specically, ‘‘clarity’’ is intelligibility of audio signal, ‘‘naturalness’’ is the fluidity of rendering, ‘‘liveness’’ is the middle and high frequency reverberation (500 Hz ⬃2 kHz), and ‘‘warmth’’ is the low frequency reverberation 共less than 500 Hz兲 关12兴. There were eleven subjects taking part in the listening test. All of these subjects listened to a segment of music and another segment of speech. The results of listening test are shown in Figs. 11 and 12. It was found that the speaker No. 1 produced the highest loudness, but the worst performance in the
Fig. 9 On-axis pressure response responses of the piezoelec-tric panel speaker are compared for an optimal design obtained using GA and a non-optimal position
Fig. 10 Frequency responses of the piezoelectric panel speaker. The effect of Young’s modulus of panel is investi-gated. The Young’s modulus of the PC panel is close to the optimal value obtained from the GA procedure
Fig. 11 Results of the subjective listening test for the music input. Five configurations of piezoelectric panel speakers are compared. The average and spread of test result are indicated on the figure
Table 5 Relevant data of the PZT and the panel for two panel speaker configurations, used in the simulation and experiments. Dimensions of the piezoelectric panel speaker are 60 mmÃ60 mmÃ0.3 mm
Speaker1 Speaker2
Panel size 42 mm⫻84 mm⫻0.1 mm 42 mm⫻84 mm⫻0.1 mm
Panel material
Carbon fiber Carbon fiber
Boundary condition
White foam White foam
PZT size 15 mm⫻30 mm⫻0.1 mm 15 mm⫻30 mm⫻0.1 mm
PZT position
1/4 of long side, 1/3 of short side 1/4 of long side, 1/3 of short side
c11 D 23.16⫻1010N/m2 11.73⫻1010N/m2 c12 D 14.07⫻1010N/m2 7.77⫻1010N/m2 c66 D 4.545⫻1010N/m2 1.98⫻1010N/m2 h31 ⫺3.21⫻108V/m ⫺8.1⫻108V/m 33 S 2.3077⫻107 1.94⫻108
other indices共total score⫽29 and 31, respectively, for music and speech listening兲. On the other hand, the panel speaker No. 5 appears overall the best piezoelectric panel speaker for both music and speech listening共total score⫽40 and 38, respectively兲. 5 Conclusions
Optimal design and implementation of miniature piezoelectric panel speakers have been presented in this paper. A FEM-based model has been developed to serve as the simulation platform. Optimal designs have been obtained with the aid of the Taguchi method and GA method. The Taguchi method is intended for the preliminary search of optimal configuration and experimental de-sign. The GA method proves effective in fine-tuning the design parameters. Based on these two methods, an optimal design
meth-odology for piezoelectric panel speakers is presented in this paper. The performance and adequacy as a broadband loudspeaker of the proposed device is investigated. As confirmed by the numerical and experiment results of various indices, the piezoelectric panel speaker using the optimal configuration indeed produced better performance than the non-optimal ones.
From the experimental results, the advantages of the piezoelec-tric panel speaker are two-fold. The piezoelecpiezoelec-tric panel speaker achieves an impressive efficiency共approximately 10:1兲 over the voice-coil driven counterpart. In addition, the thickness of piezo-electric panel speaker measures only 0.2 mm, which is also much less than the 2.4 mm of the voice-coil counterpart. Overall, the piezoelectric panel speaker has displayed the potential for the 3C applications.
Acknowledgments
Thanks are due to the illuminating discussions with NXT, New Transducers Ltd, UK. The work was supported by the Nation Science Council in Taiwan, Republic of China, under the project number NSC 91-2212-E009-032.
References
关1兴 Bai, M. R., and Huang, T., 2001, ‘‘Development of Panel Loudspeaker Sys-tem: Design, Evaluation and Enhancement,’’ J. Acoust. Soc. Am., 109, pp. 2751–2761.
关2兴 Azima, H., 1998, ‘‘NXT, Up Against Wall,’’ Audio Magazine, September, pp. 34 – 41.
关3兴 Waanders, J. W., 1991, Piezoelectric Ceramics Properties and Applications, Philips Components, Eindhoven.
关4兴 Langhaar, H. L., 1962, Energy Methods in Applied Mechanics, John Wiley and Sons, New York.
关5兴 Tiersten, H. F., 1969, Linear Piezoelectric Plate Vibration, Plenum press, New York.
关6兴 Davis, C. R., 1989, Concepts and Applications of Finite Element Analysis, John Wiley and Sons, New York.
关7兴 Berkhoff, A. P., 2000, ‘‘Sensor Scheme Design for Active Structural Acoustic Control,’’ J. Acoust. Soc. Am., 108, pp. 1037–1045.
关8兴 Meirovitch, L., 1986, Elements of Vibration Analysis, McGraw-Hill, Sin-gapore.
关9兴 Hicks, C. R., and Turner, K. V., 1999, Fundamental Concepts in the Design of Experiments, Oxford University Press, New York.
关10兴 Holland, J. H., 1962, ‘‘Outline for a Logical Theory of Adaptive System,’’ J. Assoc. Comput. Mach., 3, pp. 297–314.
关11兴 Turner, J. D., and Prtylove, A. J., 1991, Acoustics for Engineers, McMillan Education, New York.
关12兴 Zwicker, E., and Fastl, H., 1999, Psycho-acoustics: Fact and Models, Springer-Verlag, New York.
Fig. 12 Results of the subjective listening test for the speech input. Five configurations of piezoelectric panel speakers are compared. The average and spread of test result are indicated on the figure.
Table 6 Five configurations of piezoelectric panel speaker used for a subjective listening test. The dimensions of the panel speaker are 42 mmÃ84 mmÃ0.1 mm. The PZT is the same as that used in Speaker 1 of Table 5
Speaker number
Panel material
Panel size
共mm兲 PZT size共mm兲 PZT position共mm兲 Boundarycondition No.1 Carbon fiber 42⫻84⫻0.1 15⫻30⫻0.1 共14,21兲 White foam No.2 PC 42⫻84⫻0.1 15⫻30⫻0.1 共14,21兲 White foam No.3 Laminate 42⫻84⫻0.1 15⫻30⫻0.1 共14,21兲 White foam No.4 Carbon fiber⫹ damping 42⫻84⫻0.1 15⫻30⫻0.1 共14,21兲 White foam No.5 Acrylic fiber 42⫻84⫻0.1 15⫻30⫻0.1 共14,21兲 White foam Õ