Open Access
Research article
Risk-adjusted cesarean section rates for the assessment of physician
performance in Taiwan: a population-based study
Chao-Hsiun Tang
1, Han-I Wang
1, Chun-Sen Hsu
2,3, Hung-Wen Su
3,
Mei-Ju Chen
4and Herng-Ching Lin*
1Address: 1School of Health Care Administration, Taipei Medical University, Taipei, Taiwan, 2Department of Obstetrics and Gynecology, College
of Medicine, Taipei Medical University, Taipei, Taiwan, 3Department of Obstetrics and Gynecology, Taipei Medical University – Wan Fang
Hospital, Taipei, Taiwan and 4Health Promotion Division, Department of Health, Taipei City Government, Taipei, Taiwan
Email: Chao-Hsiun Tang - chtang@tmu.edu.tw; Han-I Wang - b8608013@tmu.edu.tw; Chun-Sen Hsu - morri@tmu.edu.tw; Hung-Wen Su - 90144@wanfang.gov.tw; Mei-Ju Chen - beer@health.gov.tw; Herng-Ching Lin* - henry11111@tmu.edu.tw
* Corresponding author
Abstract
Background: Over the past decade, about one-third of all births nationwide in Taiwan were
delivered by cesarean section (CS). Previous studies in the US and Europe have documented the need for risk adjustment for fairer comparisons among providers. In this study, we set out to determine the impact that adjustment for patient-specific risk factors has on CS among different physicians in Taiwan.
Methods: There were 172,511 live births which occurred in either hospitals or obstetrics/
gynecology clinics between 1 January and 31 December 2003, and for whom birth certificate data could be linked with National Health Insurance (NHI) claims data, available as the sample for this study. Physicians were divided into four equivalent groups based upon the quartile distribution of their crude (actual) CS rates. Stepwise logistic regressions were conducted to develop a predictive model and to determine the expected (risk-adjusted) CS rate and 95% confidence interval (CI) for each physician. The actual rates were then compared with the expected CS rates to see the proportion of physicians whose actual rates were below, within, or above the predicted CI in each quartile.
Results: The proportion of physicians whose CS rates were above the predicted CI increased as
the quartile moved to the higher level. However, more than half of the physicians whose actual rates were higher than the predicted CI were not in the highest quartile. Conversely, there were some physicians (40 of 258 physicians) in the highest quartile who were actually providing obstetric care that was appropriate to the risk. When a stricter standard was applied to the assessment of physician performance by excluding physicians in quartile 4 for predicting CS rates, as many as 60% of physicians were found to have higher CS rates than the predicted CI, and indeed, the CS rates of no physicians in either quartile 3 or quartile 4 were below the predicted CI.
Conclusion: Overall, our study found that the comparison of unadjusted CS rates might not
provide a valid reflection of the quality of obstetric care delivered by physicians, and may ultimately lead to biased judgments by purchasers. Our study has also shown that when we changed the standard of quality assessment, the evaluation results also changed.
Published: 09 October 2006
BMC Public Health 2006, 6:246 doi:10.1186/1471-2458-6-246
Received: 22 April 2006 Accepted: 09 October 2006 This article is available from: http://www.biomedcentral.com/1471-2458/6/246
© 2006 Tang et al; licensee BioMed Central Ltd.
This is an Open Access article distributed under the terms of the Creative Commons Attribution License (http://creativecommons.org/licenses/by/2.0), which permits unrestricted use, distribution, and reproduction in any medium, provided the original work is properly cited.
BMC Public Health 2006, 6:246 http://www.biomedcentral.com/1471-2458/6/246
Page 2 of 9 (page number not for citation purposes)
Background
The rise in cesarean section (CS) delivery rates in Western nations and many developing countries has become an issue of major public health concern. Over the past dec-ade, about one-third of all births nationwide in Taiwan were delivered by CS, with the proportion having fluctu-ated between 32.39% and 34.47% [1]; indeed, cesarean deliveries have now become the most common of all major surgical procedures currently being undertaken under the country's National Health Insurance (NHI) pro-gram. Although considerable controversy remains as to whether elective CS can provide any benefits, either to the newborn child or to the parturient [2,3], the medical costs associated with the high CS rate in Taiwan have neverthe-less become a tremendous financial burden on the island's finite healthcare resources.
In order to ensure the optimum level of quality care for pregnant women and their infants, the Bureau of NHI (BNHI) has placed the CS rates of all providers under close scrutiny, adopting actual quarterly average rates by region and/or hospital accreditation levels, as a means of evaluating hospital/physician obstetric practice patterns [4]. However, numerous studies have consistently pro-vided evidence to show that differences in case mixes among patient populations of different healthcare provid-ers in a wide range of settings may lead to bias in the judg-ment of whether a provider truly has a high CS rate. Those studies suggest that prior to any comparison being under-taken between different providers, all CS rates should be adjusted for risks [5-9]. A pioneering study in Taiwan by Hsu et al. [10] pointed out the unfairness of using crude CS rates as a means of comparing hospital performance within the Taipei Municipal Hospital System, and also the inappropriateness of drawing conclusions based on crude rates on the link between hospital practice patterns and quality of care.
Prior research into risk-adjusted CS rates tended to focus on profiles of hospital CS rates; thus, to the best of our knowledge, no study has yet been carried out on case mix adjustment based upon profiles of individual physicians' CS rates. This clearly hinders the efforts by policymakers to develop effective interventions aimed at lowering the CS rates at the physician level. This study therefore took advantage of a unique dataset which merges birth certifi-cate data with the NHI claims data, to determine the impact that adjustment for patient-specific risk factors has on CS rates among different physicians in Taiwan. The findings of this study will not only facilitate more-accu-rate comparisons of CS more-accu-rates among physicians, but can also help policymakers target their interventions at spe-cific physicians.
Methods
Data collection
All live births (n = 176,399) occurring in either hospitals or obstetrics/gynecology clinics between 1 January and 31 December 2003, and for whom birth certificate data could be linked with the NHI claims data, were selected as the sample for this study. The mother's date of birth, along with her unique personal identification number, provided the link between the birth certificate data and the NHI claims data.
The birth certificate dataset contains various parental demographics (including age, the highest education level achieved, marital status, and county of residence), infant gestational age (in weeks), birth weight (in grams) and gender, as well as details on multiple pregnancies and the mother's gravidity. The NHI claims data contain informa-tion on all deliveries occurring in NHI-contracted hospi-tals and clinics (over 92% of all healthcare institutions), including the method of delivery, the characteristics of the hospital/clinic and attending physicians, as well as one principal diagnosis code, and up to four secondary diag-nosis codes for each hospital admission, from the Interna-tional Classification of Disease, Ninth Revision, Clinical Modification (ICD-9-CM).
Those cases with missing data (n = 924), and those cases for which delivery was carried out by physicians who had fewer than 20 deliveries in 2003 (n = 2964), were excluded from the sample. The reason for the exclusion of the latter group of physicians was to ensure that all physi-cians included within this study had adequate obstetrics practical experience. We were ultimately left with a study sample of 172,511 deliveries for analysis in this study, comprising 60,079 births by CS and 112,432 vaginal deliveries.
The availability of unique physician identifiers within the claims data for each medical claim submitted enabled us to identify the same physician carrying out one or more deliveries in 2003; data for that year indicated that 1031 physicians delivered the babies of the 172,511 sampled patients. We divided the physicians into four equivalent groups based upon the quartile distribution of their crude (actual) CS rates during the period of study. Those physi-cians whose CS rates fell into the top quartile had the highest crude CS rates, while those falling into the bottom quartile had the lowest crude CS rates.
The institutional review board (IRB) at Taipei Medical University, Taipei, Taiwan granted ethical approval for the study.
Variable definitions
'Case mix' represents those factors demonstrated in the lit-erature to increase the risk of CS delivery. In this study, we categorized these factors into obstetric, pregnancy, and other risk factors.
Obstetric risk factors
Numerous studies have documented a breech presenta-tion, dystocia, and fetal distress as obstetric factors which are indications for a CS [5,11-14]; however, while these are common indications for a CS, dystocia and fetal dis-tress diagnoses are often very subjective, and, indeed, are often not risk factors in themselves. The inclusion of these factors in the regression, along with preexisting risk fac-tors, may well have masked many important differences by 'adjusting away' subjective practice differences among physicians. Furthermore, since dystocia may be related to fetal macrosomia, and fetal distress may be related to var-ious other conditions (including diabetes, hypertension, and collagen vascular disease), this may once again have introduced potential redundancies into the regression. There is also a lack of standard clinical criteria for defining dystocia and fetal distress [8,10], with obstetricians in dif-ferent healthcare institutions possibly applying the terms to quite-different conditions; thus, the variability in the proportions of patients diagnosed with dystocia and fetal distress may be partially attributable to differences in defining these conditions, rather than differences in the physician/patient mix. We therefore selected malpresenta-tion (ICD-9-CM codes 652, 761.7, 763.0, or 763.1), a pro-lapsed cord (663.0), antepartum hemorrhage, abruptio placenta, and previa placenta (641, 762.0 or 762.1) to bet-ter define and represent the obstetric risk factors likely to result in a CS.
Pregnancy risk factors
A number of independent factors, all of which seem clin-ically relevant and are known to physicians prior to deliv-ery, were included in this study. A woman was considered to have a pregnancy risk factor if she had one or more of the following conditions: a previous CS history (654.2), genital herpes (647.6), diabetes mellitus (648.0, 648.8, or 775.0), anemia (648.2), cardiac disease (648.5 or 648.6), arterial hypertension (642.0, 642.1, 642.2, 642.3, 642.9, or 760.0), eclampsia/preeclampsia (642.4, 642.5, 642.6, or 642.7), polyhydramnios/oligohydramnios (657.0 or 658.0), infection of the amniotic cavity (658.4), a congen-ital/acquired abnormality of the cervix or vagina (654.6 or 654.7), iso-immunization with Rh antigen (656.1), insuf-ficient or excessive fetal growth (656.5 or 656.6), cerebral occlusion-hemorrhage (430, 431, 432, 433, or 434), pre-mature labor (644), a multiple gestation (651), prepre-mature rupture of the membrane (658.1), or cervical incompe-tence (654.5).
Other risk factors
Certain variables from the database were also recorded to create clinically meaningful categories. These variables included maternal age (in years) at the time of the infant's birth, infant gender, and parity. Maternal ages were grouped into < 20, 20–34 and ≥ 35 years. Since birth-weight and gestational week are highly correlated, to pre-vent redundancy by including both parameters, gestational age was selected to capture the effect of pre-term (< 37 weeks) or postdate delivery (≥ 42 weeks). Insufficient or excessive fetal growth (656.5 or 656.6) was also included as a pregnancy risk factor to further distin-guish the risk of intrauterine growth retardation or macro-somia for a given gestational age. Parity was recorded as whether or not a mother was parous.
Statistical analysis
All of the statistical analyses within this study were per-formed using the SAS statistical package (SAS System for Windows, version 8.2, Cary, NC). The χ2 test was first
per-formed as a means of assessing whether there were any significant variations in the distribution of patient popu-lation risks across the physician quartiles, and second, to evaluate whether there were any significant differences, again by physician quartiles, in the cesarean delivery rates among women for each of the risk factors.
A univariate analysis was first carried out as the primary method of calculating the odds of a cesarean delivery, in order to determine whether there was any association with the potential risk factors. Stepwise logistic regres-sions were then conducted on parturients delivered by physicians in all four quartiles (referred to as model 1) to first develop a predictive model, and second, as a means of minimizing the number of predictive risk factors within the formula. A p value of < 0.05 was required for entry of a risk factor into the model. Given the sufficiently large volume of sample patients adopted for the current study, it was extremely unlikely that any important variables would have been overlooked.
Having computed the predicted risk of CS for each woman based upon the predictive model, these predicted risks were then aggregated by physician to determine the expected (risk-adjusted) CS rate and 95% confidence interval (CI) for each physician. The actual rates were then compared with the expected CS rates for each physician so as to determine how many of the physicians were below, within, and above the predicted CI in each physician quartile.
The main problem with risk adjustment, however, is the way in which an appropriate 'gold standard' is applied. Deriving a logistic equation and then applying it back to the same population from which it was derived is a
well-BMC Public Health 2006, 6:246 http://www.biomedcentral.com/1471-2458/6/246
Page 4 of 9 (page number not for citation purposes) accepted technique; however, there is a certain circular
logic to this method, since the gold standard is partially defined by practices that are themselves outliers, such as the case in model 1.
Since the average CS rates for physicians in quartile 4 were as high as 52%, we therefore treated physicians in quartile 4 as outliers and repeated the logistic regression using only those parturients delivered by physicians in quartiles 1, 2, and 3. The results of this analysis are referred to as model 2. Based upon the regression results from model 2, we then recalculated the predicted CS rate and the 95% CI for each physician in the four quartiles, and again deter-mined how many of the physicians were below, within, and above the predicted CI in each physician quartile. Our intuition was that there would be even-greater variation in predicted cesarean section rates under model 2 than under model 1.
Results
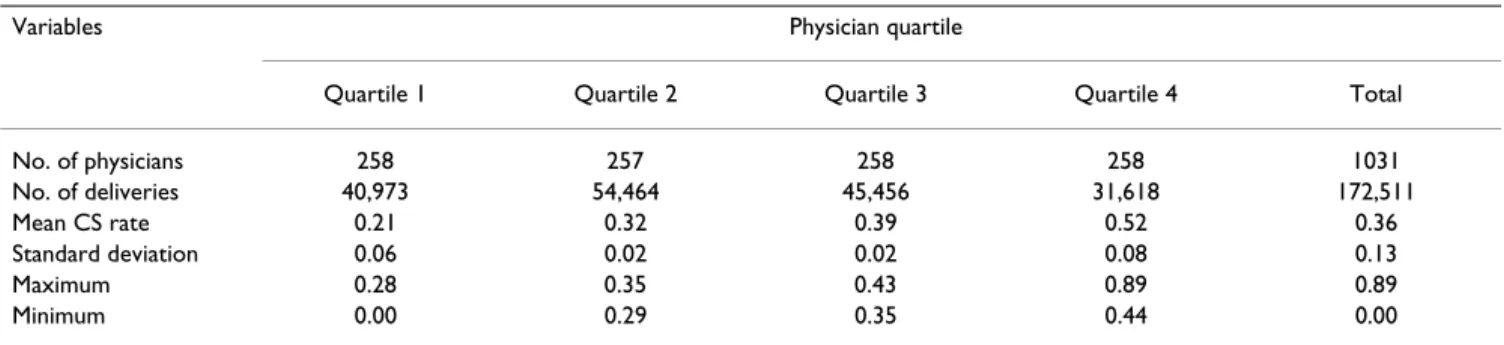
The total number of deliveries and mean CS rates are sum-marized in Table 1 by physician quartiles. Of all the deliv-eries carried out in Taiwan in 2003, the overall CS rate was 36%, with the mean CS rates being 21% for physician quartile 1; 32% for quartile 2; 39% for quartile 3; and 52% for quartile 4.
In total, 258 physicians delivered 40,973 babies in the first quartile, 257 physicians delivered 54,464 babies in the second quartile, 258 physicians delivered 45,456 babies in the third quartile, and 258 physicians delivered 31,618 babies in the fourth quartile.
Table 2 presents the CS rate and frequency for each risk factor by physician quartile. As expected, the presence of risk factors considerably increased from the lower quartile to the higher quartiles. As results of the χ2 test showed,
there were statistically significant variations in the distri-bution of patient population risks across physician quar-tiles in almost all of the risk factors, with the exceptions of a prolapsed cord, genital herpes, diabetes mellitus, arterial
hypertension, polyhydramnios/oligohydramnios, and congenital/acquired abnormalities of the cervix or vagina. Similarly, the χ2 test in Table 2 also indicated that with the
notable exception of those cases involving a prolapsed cord, on presentation of each of the risk factors, the deci-sion to perform a surgery significantly increased from the lower quartile to the higher quartiles.
Results of the univariate analysis in Table 3 suggest that those with a significantly greater likelihood of undergoing a CS included parturients who were multiparous, had a multiple gestation, were preterm, were aged over 35 years, were undergoing premature labor, or had malpresenta-tion, a prolapsed cord, antepartum hemorrhage, a previ-ous history of CS, insufficient or excessive fetal growth, genital herpes, diabetes mellitus, had anemia, cardiac dis-ease, arterial hypertension, eclampsia/preeclampsia, poly-hydramnios/oligohydramnios, an infection of the amniotic cavity, a congenital/acquired abnormality of the cervix or vagina, or cervical incompetence.
All of the risk factors included within the univariate anal-ysis were retained in the stepwise regression analanal-ysis for adjusting the CS rates. The results for model 1 in Table 3 indicate that after controlling for all the risk factors within the model, the adjusted odds ratio for most of the obstet-ric- and pregnancy-related complications were of consid-erably greater magnitude compared to the unadjusted risks, while those of premature labor and maternal age were reduced. However, with the exceptions of premature rupture of the membrane and parity, the direction of the relationship between the CS rate and all other variables remained unchanged. Nulliparous women and women with premature rupture of the membrane were no longer protective against CS, but instead, incurred increased risk. The results of the stepwise logistic regression, using partu-rients delivered by physicians in quartiles 1, 2, and 3, are presented in model 2 of Table 3. Within the model, with the exception of cervical incompetence, the direction of Table 1: Mean cesarean section (CS) rates by physician quartile
Variables Physician quartile
Quartile 1 Quartile 2 Quartile 3 Quartile 4 Total
No. of physicians 258 257 258 258 1031 No. of deliveries 40,973 54,464 45,456 31,618 172,511 Mean CS rate 0.21 0.32 0.39 0.52 0.36 Standard deviation 0.06 0.02 0.02 0.08 0.13 Maximum 0.28 0.35 0.43 0.89 0.89 Minimum 0.00 0.29 0.35 0.44 0.00
BM C Public Health 2 006, 6:246 http://ww w.b iomed central.com/1 471 -2 458 Page (page nu mber not for cit a tion pur distribution of patient risks rate for patient risks Quartile 1 Quartile 2 Quartile 3 Quartile 4
No. % CS rate No. % CS rate No. % CS rate No. % CS rate p value p value Obstetric factors
Malpresentation 2314 5.65 97.84 3881 7.13 99.15 3559 7.83 98.65 2982 9.43 99.56 < 0.0001 < 0.0001 Prolapsed cord 12 0.03 91.67 31 0.06 100.00 15 0.03 86.67 13 0.04 84.62 0.14 0.20 Antepartum hemorrhage, abruptio/previa
placenta
335 0.82 89.55 811 1.49 94.45 783 1.72 93.49 982 3.11 97.76 < 0.0001 < 0.0001
Pregnancy factors
Previous CS history 3373 8.23 95.67 5879 10.79 96.19 6233 13.71 97.83 5201 16.45 98.96 < 0.0001 < 0.0001 Insufficient or excessive fetal growth 232 0.57 64.66 379 0.70 73.09 365 0.80 84.93 280 0.89 88.21 < 0.0001 < 0.0001 Genital herpes 12 0.03 50.00 21 0.04 80.95 23 0.05 56.52 21 0.07 95.24 0.10 0.0066 Diabetes mellitus 185 0.45 35.14 194 0.36 56.19 175 0.38 64.00 117 0.37 79.49 0.11 < 0.0001 Anemia 583 1.42 42.88 745 1.37 58.66 486 1.07 63.58 472 1.49 81.14 < 0.0001 < 0.0001 Cardiac disease 13 0.03 46.15 42 0.08 64.29 30 0.07 50.00 31 0.10 80.65 0.0047 0.0477 Arterial hypertension 175 0.43 41.71 217 0.40 63.59 162 0.36 61.73 111 0.35 78.38 0.25 < 0.0001 Eclampsia/preeclampsia 282 0.69 62.41 369 0.68 82.66 403 0.89 83.62 330 1.04 92.73 < 0.0001 < 0.0001 Polyhydramnios/oligohydramnios 92 0.22 33.70 107 0.20 60.75 106 0.23 65.09 74 0.23 67.57 0.56 < 0.0001 Infection of the amniotic cavity 57 0.14 49.12 82 0.15 74.39 76 0.17 92.11 85 0.27 87.06 0.0001 < 0.0001 Congenital/acquired abnormality of cervix/
vagina
7 0.02 42.86 14 0.03 79.57 16 0.04 93.75 13 0.04 100.00 0.22 0.0053 Premature labor 1269 3.10 24.11 1798 3.30 42.32 1626 3.58 53.75 1186 3.75 63.83 < 0.0001 < 0.0001 Premature rupture of membranes 1283 3.13 19.56 1974 3.62 26.55 1715 3.77 31.66 1092 3.45 48.08 < 0.0001 < 0.0001 Cervical incompetence 8 0.02 12.50 22 0.04 27.27 23 0.05 39.13 40 0.13 75.00 < 0.0001 0.0002 Other risk factors
Nulliparous 19,726 48.14 20.86 26,622 48.88 29.38 22,882 50.34 37.24 15,504 49.03 50.79 < 0.0001 < 0.0001 Gestational weeks < 37 3008 7.34 34.71 4419 8.11 43.77 3932 8.65 54.43 2983 9.43 64.30 - < 0.0001 ≥ 42 131 0.32 22.90 198 0.36 36.36 145 0.32 40.69 102 0.32 50.00 < 0.0001 0.0002 Multiple gestation 975 2.40 65.33 1400 2.57 77.57 1432 3.15 85.61 1441 4.56 90.35 < 0.0001 < 0.0001 Maternal age ≥ 35 yr 4212 10.28 34.59 5752 10.56 47.79 5699 12.54 54.17 4753 15.03 64.09 < 0.0001 < 0.0001
BMC Public Health 2006, 6:246 http://www.biomedcentral.com/1471-2458/6/246
Page 6 of 9 (page number not for citation purposes) the relationship between the CS rate and all other risk
fac-tors remained unchanged, with the adjusted odds ratio for most of the obstetric- and pregnancy-related complica-tions being of similar magnitudes when compared to the results of model 1. Cervical incompetence was excluded from the prediction of the CS rate in model 2.
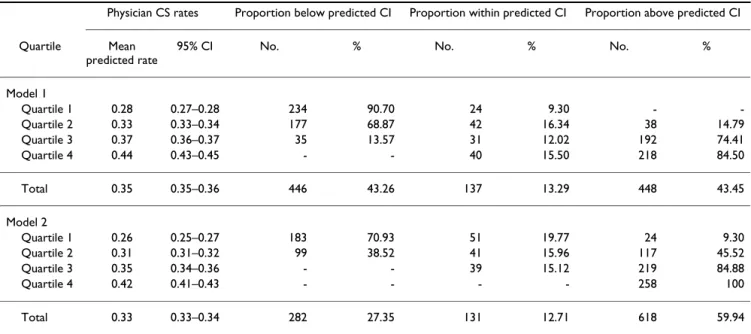
Both the likelihood ratio and the Hosmer-Lemeshow test were significant in models 1 and 2, at p < 0.0001, indicat-ing that while the risk factors considered in both models were significant, in terms of predicting the probability of a CS, the fit was nevertheless imperfect. However, the number of concordant pairs was very high, with the respective c-statistic for models 1 and 2 respectively being 0.870 and 0.872, thereby indicating that the predictive accuracy of the logistic model was good in both models. Each of the models derived from the stepwise logistic regression analysis in Table 3 was used to generate a pre-dicted CS rate for each physician based upon the patient mix for that physician. The actual CS rates, the predicted rates generated by models 1 and 2, and the percentages of physicians whose actual rates were below, within, or above the predicted 95% CI are presented in Table 4 by physician quartile.
The overall results from model 1 show that of 1031 phy-sicians, 448 physicians (43.45%) had CS rates which were above the predicted CI; as expected, the proportion of physicians whose CS rates were above the predicted 95% CI increased for the higher quartiles. In the lowest quar-tile, no physician's actual rate was above the predicted CI, while in the highest quartile, the actual rates of as many as 218 physicians (84.85%) were above the predicted CI. Of the 448 physicians whose actual rates were greater than the predicted CI, 230 physicians (51.34%) were not in the highest quartile of actual rates; on the other hand, of the 446 physicians whose actual rates were below the pre-dicted CI, 212 physicians (47.53%) were not in the lowest quartile.
When a stricter standard was applied to the assessment of physician performance, the results from model 2 in Table 4 indicated that compared to the results of model 1, there were increases in the numbers of physicians whose CS rates were above the predicted CI in each quartile. Overall, as many as 60% of the physicians were found to have higher CS rates than the predicted CI.
In addition, within model 2, CS rates of 24 physicians in the lowest quartile were now higher than the predicted CI. Moreover, the actual rates of all the physicians in the high-Table 3: Final model of the stepwise regression analysis
Risk factor Model 1* Model 2*
Crude OR (95% CI) Adj. OR (95% CI) Adj. OR (95% CI)
Multiple gestation 8.5 (7.9–9.1) 12.4 (11.5–13.5) 11.7 (10.7–12.8)
Multiparous 1.1 (1.1–1.2) 0.4 (0.4–0.4) 0.4 (0.4–0.4)
Gestation period (weeks) < 37 1.9 (1.8–2.0) -
-≥ 42 1.1 (0.9–1.3) 2.2 (1.8–2.7) 2.4 (1.9–2.9)
Maternal age (years) < 20 0.4 (0.4–0.5) 0.6 (0.5–0.6) 0.6 (0.5–0.6)
≥ 35 2.2 (2.1–2.2) 1.9 (1.9–2.0) 1.9 (1.8–2.0)
Malpresentation 206.8 (175.4–243.8) 468.0 (396.6–552.3) 481.2 (404.3–572.8)
Prolapsed cord 24.5 (9.9–60.7) 61.7 (24.4–156.1) 107.0 (32.9–347.9)
Antepartum hemorrhage, abruptio placenta, and previa placenta 35.3 (30.0–41.6) 95.6 (81.0–112.8) 86.9 (72.5–104.2)
Previous CS history 100.8 (92.6–109.7) 291.0 (266.6–317.7) 287.2 (261.6–315.3)
Insufficient or excessive fetal growth 6.9 (6.0–7.9) 13.1 (11.4–15.2) 13.0 (11.0–15.2)
Genital herpes 5.0 (3.0–8.2) 10.4 (6.1–17.7) 8.0 (4.4–14.5) Diabetes mellitus 2.4 (2.1–2.8) 3.1 (2.5–3.7) 2.8 (2.3–3.5) Anemia 2.9 (2.7–3.1) 3.6 (3.2–4.0) 3.3 (2.9–3.7) Cardiac disease 3.2 (2.2–4.6) 6.0 (4.0–9.0) 5.1 (3.2–8.3) Arterial hypertension 2.8 (2.4–3.3) 4.4 (3.7–5.3) 4.4 (3.6–5.4) Eclampsia/preeclampsia 8.2 (7.2–9.4) 15.4 (13.4–17.8) 14.6 (12.5–17.1) Polyhydramnios/oligohydramnios 2.5 (2.1–3.1) 3.5 (2.7–4.4) 3.7 (2.8–4.8)
Infection of amniotic cavity 6.5 (5.0–8.6) 11.3 (8.5–15.1) 11.5 (8.3–16.0)
Congenital/acquired abnormality of cervix or vagina 9.8 (4.6–20.8) 19.8 (8.9–44.0) 19.6 (8.7–44.6)
Premature labor 1.6 (1.5–1.7) 1.5 (1.4–1.6) 1.6 (1.4–1.7)
Premature rupture of the membrane 0.8 (0.8–0.9) 1.4 (1.3–1.5) 1.4 (1.3–1.5)
Cervical incompetence 1.8 (1.2–2.8) 2.8 (1.7–4.6)
est quartile were above the predicted CI, and indeed, the CS rates of no physicians in either quartile 3 or quartile 4 were below the predicted CI.
Discussion
CS rates have been used for a decade or so as a means of comparing obstetric practices across different providers, with many studies throughout this period having docu-mented the need for risk adjustment for fairer compari-sons among providers [5-10]. In 2000, the American College of Obstetricians and Gynecologists (ACOG) rec-ommended that all CS rates should be risk-adjusted (case-mix adjusted) prior to any comparisons being made [15]; however, while this may be desirable, in many areas or countries, such adjustment is usually not feasible, largely due to the lack of adequate data sources.
The CS rate in Taiwan has hovered between 32% and 34% since implementation of the NHI program in 1995. Although lower than the respective CS rates of 36% and 40% found in Brazil and Chile, the CS rate in Taiwan is nevertheless much higher than the 15% limit recom-mended by the World Health Organization [16].
Inappropriate CS procedures increase maternal and neo-natal morbidity and healthcare costs; however, the BNHI has continually adopted crude CS rates as its measure of quality in obstetrics management, and this can clearly lead to unfair assessments of those providers who are serv-ing high-risk populations, since these providers will obvi-ously have higher CS rates, and will therefore appear to be providing a lower quality of care.
By examining all 172,511 births in Taiwan in 2003, the present study took advantage of a unique population-based dataset which merges birth certificate data with the NHI claims data of this population to show how adjust-ments of patient risk factors can significantly change the overall assessment of a physician's obstetrics perform-ance.
Our data specifically demonstrate that more than half of all physicians with inappropriately high rates were not in the highest quartile, and that these would be overlooked if the assessment was only targeted at those physicians in the highest quartile of unadjusted rates. Conversely, we also found that some physicians (40 of 258 physicians) in the highest quartile were actually providing obstetric care that was appropriate to the risk. However, our data also demonstrate that when stricter standards were applied to the evaluation of physician performance, a discernibly higher proportion of physicians were seen to be produc-ing inappropriately high CS rates. In particular, we suggest that all of the physicians in quartile 4 should be placed under close scrutiny.
The CS prediction model adopted for this study was the logistic regression method, which is very similar to that used in analyses undertaken in the US and Europe [5-9]. In general terms, the factors associated with CS are largely similar between various regions or countries; however, due to differences in the data sources or specific patient populations under examination, the odds ratios associ-ated with each of the variables may vary.
Table 4: Predicted cesarean section rates by physician quartile
Physician CS rates Proportion below predicted CI Proportion within predicted CI Proportion above predicted CI
Quartile Mean
predicted rate
95% CI No. % No. % No. %
Model 1 Quartile 1 0.28 0.27–0.28 234 90.70 24 9.30 - -Quartile 2 0.33 0.33–0.34 177 68.87 42 16.34 38 14.79 Quartile 3 0.37 0.36–0.37 35 13.57 31 12.02 192 74.41 Quartile 4 0.44 0.43–0.45 - - 40 15.50 218 84.50 Total 0.35 0.35–0.36 446 43.26 137 13.29 448 43.45 Model 2 Quartile 1 0.26 0.25–0.27 183 70.93 51 19.77 24 9.30 Quartile 2 0.31 0.31–0.32 99 38.52 41 15.96 117 45.52 Quartile 3 0.35 0.34–0.36 - - 39 15.12 219 84.88 Quartile 4 0.42 0.41–0.43 - - - - 258 100 Total 0.33 0.33–0.34 282 27.35 131 12.71 618 59.94
BMC Public Health 2006, 6:246 http://www.biomedcentral.com/1471-2458/6/246
Page 8 of 9 (page number not for citation purposes) In contrast to many prior studies [6-8], our results show
that prior to adjustment, multiparous women are at higher risk of cesarean delivery, mainly attributable to their prior history of a CS. Our data show that of the 87,777 births to parous women, 31,747 (36.17%) were delivered by CS, and 17,594 (55.42%) of these were repeat CSs. The data also reveal that of the 84,734 nullipa-rous women, 28,332 (33.44%) underwent a CS.
There are limitations to this study which should be noted. First, the possibility may exist for differential misclassifi-cation in obstetric/pregnancy risks for CS and vaginal delivery, since women who deliver vaginally tend to underreport complications much more than do those who undergo a CS. Second, the analysis in this study relied upon linked administrative data; however, some of the prior studies evaluating the use of a CS indicated that the use of administrative data may yield similar or higher discrimination than models based upon medical records [17,18]. It has been noted that across different medical institutions, medical record coders may have inconsistent coding practices, while clinicians may have very different views on diagnosis. Third, we do not have access to infor-mation on whether an obstetrician collaborated with midwives or family physicians who themselves do not have training/privileges to perform a CS. Such collabora-tion may have inflated an obstetrician' s apparent CS rate and elevated him/her into the uppermost percentile. Finally, our study was based on a dataset of linked birth certificate and NHI claims data for a single country, which may not be representative of other regions or countries. Thus, we recommend caution when interpreting these results, or attempting to apply them to other regions or countries.
Conclusion
Our study arrived at the same general conclusions reported in the literature in both the US and Europe: that is, comparisons of unadjusted CS rates might not validly reflect the quality of obstetric care being provided, and may ultimately lead to biased judgments by health care purchasers. It is worth noting that the same issues which apply to obstetrics care in the US and Europe also apply to non-Western cultures, such as Taiwan.
While it is clearly important to be able to identify the risk factors associated with CS, in order to optimize the utili-zation of both resources and personnel, risk adjustment using average performance as a benchmark is not neces-sarily a true measure of quality [19]. Our study results also show that when we changed the standard of quality assessment, the evaluation results changed.
This study represents the first attempt within a developing country to use a population-based dataset as a means of
calculating risk-adjusted CS rates in order to identify those physicians who are above or below the average practice in a high CS rate setting, which prevails in Taiwan. We believe that this represents a cornerstone with regard to the design of effective strategies for the monitoring of the 'epidemic' CS rates currently existing in Taiwan.
Abbreviations
BNHI, Bureau of National Health Insurance; CI, confi-dence interval; CS, cesarean section; NHI, National Health Insurance.
Competing interests
The authors declare no financial or non-financial associa-tions exists that might pose a conflict of interest in this study.
Authors' contributions
The individual contributions of each of the authors are as follows. C.-H. Tang identified the study issue, designed the methods, analyzed the data, and drafted the manu-script. C.-S. Hsu, H.-W. Su, and M.-J. Chen helped concep-tualize the ideas and synthesize the analyses. H.-I. Wang performed the statistical analysis and participated in the writing of the manuscript. H.-C. Lin assisted with the anal-yses and editing. All of the authors helped to interpret the findings and revise the manuscript drafts, and approved the final manuscript.
Acknowledgements
The authors would like to thank the Bureau of National Health Insurance for its technical assistance with regard to the processing of the data for this study. The authors are also extremely grateful for the financial support pro-vided by Taipei City Hospital, Zhong Xing Branch, and Taipei Medical Uni-versity – Wan Fang Hospital (95TMU-WFH-11).
References
1. Department of Health: Health and National Health Insurance Annual
Statistics Information Services [http://www.doh.gov.tw/statistic/
index.htm]. 2004/04/19
2. Minkoff H, Chervenak FA: Elective primary cesarean delivery. N
Engl J Med 2003, 348:946-950.
3. Sachs BP, Kobelin C, Castro MA, Frigoletto F: The risks of
lower-ing the cesarean – delivery rate. N Engl J Med 1999, 340:54-57.
4. National Health Insurance Medical Expenditure Negotiation Commit-tee: Negotiation indices for global budget payment system under the
National Health Insurance Program Taipei, Taiwan: Department of
Health, Executive Yuan; 2004.
5. Librero J, Peiro S, Calderon SM: Inter-hospital variations in
cae-sarean sections. A risk-adjusted comparison in the Valencia public hospitals. J Epidemiol Community Health 2000, 54:631-636.
6. Bailit JL, Dooley SL, Peaceman AN: Risk adjustment for
inter-hos-pital comparison of primary caesarean rates. Obstet Gynecol
1999, 93:1025-1030.
7. Glantz JC: Caesarean delivery risk adjustment for regional
inter-hospital comparisons. Am J Obstet Gynecol 1999, 181:1425-1431.
8. Aron DC, Harper DL, Shepardson LB, Rosenthal GE: Impact of
risk-adjusting caesarean delivery rates when reporting hos-pital performance. JAMA 1998, 279:1968-1972.
9. Keeler EB, Park RE, Bell RM, Gifford DS, Keesey J: Adjusting
cae-sarean delivery rates for case mix. Health Serv Res 1997, 32:511-528.
Publish with BioMed Central and every scientist can read your work free of charge "BioMed Central will be the most significant development for disseminating the results of biomedical researc h in our lifetime."
Sir Paul Nurse, Cancer Research UK Your research papers will be:
available free of charge to the entire biomedical community peer reviewed and published immediately upon acceptance cited in PubMed and archived on PubMed Central yours — you keep the copyright
Submit your manuscript here:
http://www.biomedcentral.com/info/publishing_adv.asp
BioMedcentral
10. Hsu CC, Shieh GR, Wu CS, Shen HC, Tang CH: Risk adjustment
for inter-hospital comparisons of caesarean section rates in Taipei municipal hospitals. Eur J Obstet Gynecol Reprod Biol 2006, 127:190-197.
11. Lin HC, Sheen TC, Tang CH, Kao S: Association between
mater-nal age and the likelihood of a cesarean section: a popula-tion-based multivariate logistic regression analysis. Acta Obstet Gynecol Scand 2004, 83:1178-1183.
12. Henry OA, Gregory KD, Hobel CJ, Platt LD: Using ICE-9 codes to
identify indications for primary and repeat caesarean sec-tions: agreement with clinical records. Am J Public Health 1995, 85:1143-1146.
13. Stafford RS: Caesarean section use and source of payment: an
analysis of California hospital discharge abstracts. Am J Public Health 1990, 80:313-315.
14. Anderson GM, Lomas J: Determinants of the increasing
caesar-ean birth rate. Ontario data 1979–1982. N Engl J Med 1984, 311:887-892.
15. American College of Obstetricians and Gynecologists Task Force on Caesarean Delivery: Evaluation of caesarean delivery Washington, DC: American College of Obstetricians and Gynecologists; 2000. 16. World Health Organization: Appropriate technology for birth.
Lancet 1985, 2:436-437.
17. DiGiuseppe DL, Aron DC, Payne SM, Snow RJ, Dierker L, Rosenthal GE: Risk adjusting cesarean delivery rates: a comparison of
hospital profiles based on medical record and birth certifi-cate data. Health Serv Res 2001, 36:959-977.
18. Korst LM, Gregory KD, Gornbein JA: Elective primary cesarean
delivery: accuracy of administrative data. Paediatr Perinat Epide-miol 2004, 18:112-119.
19. Korst LM, Gornbein JA, Gregory KD: Rethinking the cesarean
rate: how pregnancy complications may affect interhospital comparison. Med Care 2005, 43:237-245.
Pre-publication history
The pre-publication history for this paper can be accessed here:
http://www.biomedcentral.com/1471-2458/6/246/pre pub