行政院國家科學委員會專題研究計畫 期末報告
基於意象之文化觀光市場區隔:以造訪我國之國際旅客為
例
計 畫 類 別 : 個別型 計 畫 編 號 : NSC 100-2410-H-003-119- 執 行 期 間 : 100 年 08 月 01 日至 101 年 08 月 31 日 執 行 單 位 : 國立臺灣師範大學歐洲文化與觀光研究所 計 畫 主 持 人 : 劉以德 計畫參與人員: 碩士班研究生-兼任助理人員:涂雅喬 碩士班研究生-兼任助理人員:黃璽允 碩士班研究生-兼任助理人員:賈涵珺 報 告 附 件 : 出席國際會議研究心得報告及發表論文 公 開 資 訊 : 本計畫可公開查詢中 華 民 國 101 年 11 月 26 日
中 文 摘 要 : 本研究旨在探究基於意象之文化觀光市場區隔途徑之適切 性。在確認 14 個文化吸引點之意象項目後,本研究針對來訪 台灣的國際旅客進行問卷調查,並依其對於各意象項目進行 重要性評比。以因素和群集分析,以及事後區隔法,共界定 了四個意象區隔,包含藝術與博物館、文化遺產和生活文化 等,並蒐集了 594 份問卷。研究結果揭示了許多理論和實務 之意涵,包含文化距離理論、文化雜食理論、目的地熟悉論 (經驗和資訊層面)、文化觀光客類型論等。 中文關鍵詞: 文化觀光;文化觀光客;目的地意象;市場區隔;因素群集 分析
英 文 摘 要 : This research aims at testing the effectiveness of using image–based approach to segment the cultural tourism market. Identifying 14 image attributes of cultural attractions, Taiwan's inbound tourists were then surveyed to rate the importance of these
attributes. Applying factor–cluster and a posteriori segmentation approach, four discrete image segments were identified, including arts and museum, heritage, living culture, and resulted in a sample of 954
respondents. The research findings reveals several theoretical and empirical implications, including the propositions of cultural distance,
omnivorous/univorous, experiential and informational familiarity of destination and the two–dimensional model of cultural tourist typology.
英文關鍵詞: cultural tourism; cultural tourist; destination image; market segmentation; factor-cluster analysiis
行政院國家科學委員會補助專題研究計畫
□
成果報告
□期中進度報告
計畫名稱
基於意象之文化觀光市場區隔:以造訪我國之國際旅客為例
計畫類別:
□
個別型計畫 □整合型計畫
計畫編號:NSC 100-2410-H-003 -119
執行期間:100 年 8 月 1 日至 101 年 8 月 31 日
執行機構及系所:國立台灣師範大學歐洲文化與觀光研究所
計畫主持人:劉以德 副教授
成果報告類型(依經費核定清單規定繳交):
□
精簡報告 □完整報告
中 華 民 國 101 年 11 月 24 日
Image–based Segmentation of Cultural Tourism Market: The
Perceptions of Taiwan’s Inbound Visitors
ABSTRACT
This paper aims at testing the effectiveness of using image–based approach to segment the cultural tourism market. Identifying 14 image attributes of cultural attractions, Taiwan’s inbound tourists were then surveyed to rate the importance of these attributes. Applying factor–cluster and a posteriori segmentation approach, four discrete image segments were identified, including arts and museum, heritage, living culture, and resulted in a sample of 954 respondents. The research findings reveals several theoretical and empirical implications, including the propositions of cultural distance, omnivorous/univorous, experiential and informational familiarity of destination and the two–dimensional model of cultural tourist typology.
Keywords: cultural tourism; cultural tourist; destination image; market segmentation; factor-cluster
INTRODUCTION
Cultural tourism is now recognized as a mainstream tourism activity and a form of special interest tourism (McKercher et al., 2002). Recognizing the growth of the cultural tourism market, several authors (e.g. Chandler and Costello, 2002; Dolnicar, 2002; McKercher, 2002; McKercher and du Cros, 2003; Nyaupane et
al., 2006; Sánchez‐Rivero and Pulido‐Fernández, 2012) stated the importance of recognizing the growing
differentiation within cultural tourism markets. As suggested by McKercher et al. (2002, p.26), “the cultural tourism market is not homogeneous and that different types of attractions will appeal to different types of cultural tourist”. In this context, segmentation studies are increasingly popular amongst planners and managers of destination areas, since they may contribute to a more cost–effective design and promotion of more satisfactory tourism products. Nevertheless, only few attempts have been made to study the characteristics of the culture tourism market segment (e.g. Dolnicar, 2002; McKercher, 2002; McKercher et
al., 2002; McKercher and du Cros, 2003). None of these studies tried to investigate the issue on the basis of
the perceived images of cultural tourists.
Destination image is commonly accepted as important pull factors for the success and development of a tourist destination. Understanding how visitor characteristics influence these factors is critical for destination differentiation and positioning (Prayag, 2010). Frías et al. (2012) also noted that understanding the factors that influence image would help identify target markets and determine which image should be promoted to which segment of the market. As argued by Leisen (2001), image–based segmentation is crucial to a destination's marketing success. Marketers may identify the images held by travellers and select those segments that represent the most receptive target markets. However, little effort has been made to segment the travel market based on images. Also, according to McKercher et al. (2002), knowledge of the cultural tourism market is still in its early stages, and most of the research tends to treat cultural tourists as an undifferentiated market.
The present study addresses this gap in the literature by empirically examining the inbound visitors’ perceptions of the Taiwan’s cultural offerings and dividing them into visitor groups based on their perceptions various image attributes. It is argued that image–based segmentation is a form of benefit segmentation that assumes a destination’s attributes equate with the benefits sought by tourists. It has therefore the potential to be a valid technique for identifying discrete cultural tourism market segments. The second contribution of this study is to construct and measure the image of cultural attractions that has received relatively little attention in the tourism literature. Since there is a lack of information about the characteristics of image related to cultural tourism, in this exploratory research, the first step is to conceptualize cultural tourism and determine the main image attributes. Then, the scale developed was tested in an empirical manner. In addition, unlike most of the previous studies on cultural tourism segmentation, such as McKercher (2002), McKercher et al. (2002) and McKercher and du Cros (2003), this study adopts a posteriori segmentation approach in order to yield a more in–depth and objective results.
Having set the context of the study, next the article reviews the literature on cultural tourism, cultural tourist, destination image and segmentation variables. Methodology, in terms of the research design and analytic approach, is described in the third section. Thereafter, the findings are presented, discussed and the relevant theoretical and managerial implications are drawn. Finally, the paper concludes with the implications and future research suggestions.
LITERATURE REVIEW
Cultural tourism and cultural tourist
The definitions suggested in literature to pin down the concept of cultural tourism are extremely diverse. Richards (1996) roughly grouped all definitions in two broad categories: the ‘sites and monuments approach’ and the ‘conceptual approach’. The first point of view concentrates on the cultural attractions visited by tourists and thus makes measurement very easy. Sites include theatres, museums, historical sites, music and dance and similar points of attraction. The latter approach is more general and less directly measurable, with the main emphasis of the cultural tourist being to learn about the country they are visiting, especially the history, heritage and way of life. Cultural tourism is usually defined using an operational definition (i.e. the ‘sites and monuments approach’). Based on the operational definition, cultural tourist can be defined as those who visit, or intend to visit, a cultural tourism attraction, such as art gallery, museum, archaeological and historic site, religious centres, attend a performance or festival, or participate in a wide range of other activities at any time during their trip (Bonn et al., 2007; McKercher, 2002; McKercher et al., 2002; McKercher and du Cros, 2003; Richards, 1996). However, this kind of definition can be problematic since it ignores the main reason for travelling and subsequent travelling behaviours.
As argued by McKercher (2002), as cultural tourism continues to grow in popularity, site managers and destination marketers will face the strategic challenge of developing a better understanding of this market. The use of an operational definition cannot help to develop products to best match the needs of the tourists. There is also a need to consider the heading of cultural tourism in a broader sense. According to Barbieri and Mahoney (2010), a contemporary understanding of culture tourism includes not only tangible aspects, but also
intangible cultural elements, such as appreciation of way of living. This study views therefore cultural tourism as visitation to appreciate any form of social, artistic or intellectual activity, including visiting indigenous communities, heritage and religious sites and attending performing arts, festivals and special events and tasting local gastronomy.
Up to now, most cultural tourism studies have focused on understanding three areas: the pull factor of different cultural attractions, the composition attributes of the cultural tourist and the identification of different segments of cultural tourists (Barbieri and Mahoney, 2010). Several studies have pursued different segmentations to identify and profile the various types of cultural tourists. (e.g. Barbieri and Mahoney, 2010; Dolnicar, 2002; Hughes and Allen, 2005; Kerstetter et al., 1998; Prentice et al., 1998; Silberberg, 1995; Stebbins, 1996; Van der Ark and Richards, 2006). One of the most representative works is the studies of McKercher (2002), McKercher et al. (2002) and McKercher and du Cros (2003) who developed a typology of cultural tourists based on how importance (or centrality) of cultural tourism is to the travelling decision and the depth of experience sought. Both elements, centrality and depth of experience, exist along a continuum and result in the following five types of cultural tourists: (1) purposeful cultural tourist, with high centrality and deep experience; (2) sightseeing cultural tourist, with high centrality and shallow experience; (3) casual cultural tourist, with modest centrality and shallow experience; (4) incidental cultural tourist, with low central-ity and shallow experience; and (5) serendipitous cultural tourist, with low centralcentral-ity and deep experience.
Image-based segmentation
A commonly adopted definition of image is that it is a set of beliefs, ideas, and impressions that people have of a place or destination (Baloglu and McCleary, 1999; Kotler et al 2003). It is widely accepted that destination image is an integral and influential part of the traveler’s decision process and consequently travelling behaviours. Several studies have tried to investigate the construct of destination image. For instance, Echtner and Ritchie (1993) proposed that image consists of three dimensions: attribute / holistic, functional / psychological, and common / unique. More recent studies (e.g. Baloglu and McCleary, 1999; Beerli and Martín, 2004a, 2004b) tended to consider image as two closely interrelated concepts: perceptive / cognitive evaluation. Further, the image of a destination is created through a combination of what is communicated by the destination and what is understood by the tourist. Therefore, destination image can be analyzed from two points of view: projected and perceived images (Andreu et al., 2001).
Analyzing destination image has become an important strand of tourism research. Destination image is important because of the role it plays in the potential tourist’s decision–making process. It is also significant because of how it affects the level of satisfaction with the tourist experience (Baloglu and McCleary, 1999; Beerli and Martín, 2004a, 2004b; O'Leary and Deegan, 2005; Royo–Vela, 2009). Tourism research into destination image (e.g. Baloglu and McCleary, 1999a; Beerli and Martín, 2004a, 2004b) has also confirmed its importance for both marketing and the tourist decision making process. In fact, the influence of tourism image on the choice of holiday destination has been considered by various authors in consumer behavior literature. Therefore, it is thought that destinations with stronger positive image will have a higher probability of being included and chosen in the process of decision making (Frías et al., 2008).
According to Prayag (2010), researchers have in general approached the analysis of destination images from three perspectives: analysis of image components, competitive analysis and segmentation analysis. This study falls within the segmentation category and attempts to identify the influence of socio–demographics and travelling characteristics on image perceptions. Several studies have investigated the factors influencing the formation of image, for example, Baloglu and McCleary (1999a) proposed a general theoretical model of factors which differentiates between stimulus factors (information sources and previous experience) and personal factors (travelling motivations and socio–demographics). According to this concept, several recent studies have confirmed socio–demographic characteristics (e.g. Beerli and Martín, 2004a; Leisen, 2001; Prayag, 2010; Tasci, 2007) and travelling characteristics (e.g. Beerli and Martín, 2004a; Boo and Busser, 2005; Leisen, 2001; Prayag, 2010; Vogt and Andereck, 2003) as appropriate variables for image segmentation.
Segmentation variables
The key to identify the market segments is to select suitable variables which discriminate people having different response characteristics to a product or service. A number of different segmentation variables have been utilized in the market segmentation literature. The effectiveness of market segmentation depends on the identification of segments that are measurable, accessible, substantial, actionable and differentiable (Kotler et
al., 2002), so the selection of variables used for segmentation is of great importance. The following section
will justify in details the segmentation variables adopted in this article.
(1) Socio–demographic characteristics. According to Baloglu and McCleary (1999) and Beerli and Martín (2004a, 2004b), most image formation and destination selection models have incorporated socio–demographic variables, such as gender, age, occupation, education, social class, marital status, and country of origin, as the influencing factors of the perceptions of places. However, such studies have presented contrasting results. Within the field of cultural tourism studies, it lacks also a consensus of the influences of socio–demographic factors on cultural consumption. Richards (1996) argued that people with higher levels of income and mobility in general reveal greater levels of consumption of cultural activities. There is a general perspective that the market of cultural tourism is likely to be composed of travellers with high socio–economic status, high levels of education, adequate leisure time, and often having occupations related to the cultural industries and education. Some recent studies (e.g. Hughes and Allen, 2005; Kim et al., 2007; Smith, 2003) also demonstrated that age, education and income are positively associated with participation in cultural tourism. However, as argued by McKercher et al. (2002), McKercher and du Cros (2003) and Prentice et al. (1998), since tourism is experiential and that experience is sought by groups of tourists across socio–demographic strata, benefit segmentation may be more applicable than strict socio-–demographic segmentation. DiMaggio and Mukhtar (2004) and Kim et al. (2007) also noted that the over–simplified socio–demographic characterizations do not seem to reflect the nature of increasingly diversified cultural tastes in post–modern society. In this study, the socio–demographic variables considered include gender, age education and occupation, which will be used to test the propositions of above studies.
(2) Cultural distance. “Cultural distance refers to the extent to which the culture of the area from which the tourist originates differs from the culture of the host region.” (McKercher and Chow, 2001, p.23) Several
researchers (Basala and Klenosky, 2001; McKercher and du Cros, 2003; Ng et al., 2007; O’Leary and Deegan, 2003) suggested cultural similarity / difference influences intention to visit destinations. Thus, an important marketing issue is to determine whether cultural similarity or cultural difference is a stronger driver of tourism destination choice. McKercher and Chow (2001) and McKercher and du Cros (2003) found that tourists from more culturally distant places were more highly motivated to travel for cultural reasons and sought deeper experience, whereas tourists from culturally proximate regions were less interested in cultural tourism and sought superficial, entertainment orientated experiences. They concluded that the greater the cultural distance (or strangeness, otherness) the greater the role that cultural tourism can play in attracting international visitors. Chen and Kerstetter (1999) also attempted to analyze the differences in destination images arising from cultural factors focusing on the tourists’ geographical or country of origin. In this study, nationality is used as a proxy of cultural distance measurement.
(3) Destination familiarity. The effects of destination familiarity on destination image and travel intention have been examined by a number of tourism studies (e.g. Baloglu and McCleary, 1999; Baloglu, 2001; Beerli and Martín, 2004a, 2004b; Chen and Lin, 2012; Prentice, 2004). According to Baloglu’s (2001), destination familiarity is influenced not only by previous visitation (experiential familiarity) but also by the exposure to destination related information (informational familiarity). Baloglu (2001) and a number of subsequent studies (Beerli and Martín, 2004a, 2004b; Chen and Lin, 2012; Lee et al., 2008; Prentice, 2004) have tested the positive effects of destination familiarity on destination image and travel intention. Information sources, also known as stimulus factors (Baloglu and McCleary 1999a) or image forming agents (Gartner 1993), are the forces which influence the forming of perceptions and evaluations. They refer to the amount and diverse nature of information sources to which individuals are exposed, including destination information acquired as a result of having visited the place (Beerli and Martín, 2004a, 2004b; Frías et al., 2008). So as to experiential familiarity, the number of visits, the duration and the degree of involvement with the place during the stay are common factors considered (Beerli and Martín, 2004a). In this study, number of visits, duration of stay and information sources are selected to examine the impacts of destination familiarity on tourist’s perceived images.
(4) Motivation and depth of experience. As mentioned above, the importance (or centrality) of cultural motives in driving destination choice and depth of experience (or level of engagement with the attraction) have been confirmed by McKercher (2002), McKercher et al. (2002) and McKercher and du Cros (2003) as effective variables to segment the cultural tourism market. Earlier studies (e.g. Richards, 1996; Silberberg, 1995) also tried to segment the market by the importance or centrality of cultural tourism in the trip decision. In all cases, substantial differences were found in the intensity of participation and range of activities pursued (McKercher et al., 2002; McKercher, 2002). Motivation will influence the number and type of activities pursued, awareness levels of primary and secondary cultural attractions and other trip factors (McKercher, 2002). Various image related studies also stated that motivations influence the image forming process and the choice of destination (Baloglu and McCleary 1999; Beerli and Martín, 2004a, 2004b). Motivation captures however only one dimension of cultural tourism. It is recognized that different people will engage cultural tourism attractions at different levels, depending on their own interests, level of knowledge, time availability,
level of education, awareness of the site prior to the visit, and other factors (McKercher and du Cros, 2003). The issue has been examined by different authors from different concepts, such as Timothy’s (1997) cultural connectivity, Stebbins’s (1996) ‘serious leisure’ or Macintosh and Prentice’s (1999) perceived authenticity. Built on these studies, McKercher (2002) added depth of experience as a second dimension in recognizing that different tourists may have qualitatively different experiences even if the motivation levels are similar.
METHODOLOGY
The research process was composed of two phases. First, a list of image attributes of Taiwan’s images of cultural attractions was developed. It was done by a qualitative phase – literature review of existing scales related to image attributes of cultural tourism and content analysis of projected images online. Then, in the second phase, inbound tourists who visited Taiwan’s cultural attractions were surveyed, providing a quantitative dimension to this research.
As argued by Echtner and Ritchie (1993), unless considerable effort is expended in the design stages, attribute lists may be incomplete by failing to incorporate all of the relevant characteristics of the destination image. Consequently, the image attributes were generated in a staged process to ensure the content validity. The initial pool was composed of items used in other image studies reported in the literature and then fine–tuned to the study area – cultural tourism. The cultural tourism survey conducted by the Association for Tourism and Leisure Education (ATLAS) Cultural tourism Research Project (CTRP) is one of the most important studies focusing on the research of cultural tourism development within the European and global contexts. The CTRP was established in 1991 and similar survey has been conducted in 1992, 1997, 1999, 2001 and 2004 respectively. A specific focus of the 2004 survey was the image that cultural visitors had of the destination they were visiting. Twelve image items were developed based on destination features often promoted for cultural tourism, including ‘authentic sights’, ‘museums and cultural attractions’, ‘customs and traditions’ etc. (ATLAS, 2005). In addition, after a review of the tourist destination attractions and attributes included in the different scales developed in the literature, Beerli and Martín (2004a) identified nine dimensions of image attributes, where the dimension – ‘culture, history and art’ was regarded as the most relevant to this study. The initial pool was therefore established based on the above two studies.
According to Beerli and Martín (2004a, 2004b), the selection of the attributes used in designing a scale will depend largely on the attractions of each destination and it’s positioning. Suggested by O’Leary and Deegan (2005), content analysis of written information (e.g. websites, promotional materials) could provide a great deal of information about the images projected by a tourism destination. The website of Taiwan’s Tourist Bureau was therefore selected for content analysis in order to reflect better the cultural tourism offerings of Taiwan. Four Taiwan–specific attributes (i.e. indigenous culture, Hakka culture, local arts and crafts and industrial heritage) were added to the questionnaire. Furthermore, it is believed that cultural tourism covers all aspects of travel where visitors can learn about another area’s history and way of life. Thus, cultural factors in the context of tourism not only include ‘high’ cultures but also destination’s way of life, such as gastronomy, hospitality and popular culture.
items was developed. Table 2 contains the final list of attributes that were used in the survey. In the questionnaire, respondents were asked to rate each of 14 attributes on a Likert–type scale of 1 to 5 (in which 1 = not at all important and 5 = very important) according to the importance they attached to the attribute when choosing a cultural tourism destination. Other sections of the questionnaire include socio–demographic and travelling profiles of respondents, including nationality, gender, age, education, occupation, length of stay, number of visits, information sources etc. To test cultural tourist typology proposed by McKercher (2002) and McKercher and du Cros (2003), a further five point Likert scaled question (1 ‘did not influence the decision of visit’ to 5 ‘the main reason for coming to Taiwan’) was used to test centrality of cultural tourism in the travelling decision. Likewise, a four point scaled question was used to test depth of experience. The possible answers ranged from ‘mostly sightseeing/photography’ through to a chance ‘to develop a deep understanding of Taiwan's culture and heritage’. The survey was administered to a random sample of inbound visitors to Taiwan. Various cultural attractions in Taipei were chosen as the points of distribution during October 2011 and March 2012. Tourists were met and given the questionnaire during their visits. A total of 1,000 questionnaires were conducted, and 945 valid collected in the end.
The delineation of existing market segments within the marketplace usually necessitates the use of two market segmentation methods: a priori (or conceptual) and a posteriori (or data–driven) market segmentation (Dolnicar, 2004; Hanlan et al., 2006). With the a priori segmentation method, study subjects are partitioned into groups by attributes selected based on researchers’ prior knowledge of the segments. On the other hand, when the a posteriori approach is used, the starting point is typically an empirical data set. Quantitative analysis is then applied to this data in order to identify the sizes and number of visitor segments that are previously unknown. In this research, given its exploratory nature, an a posteriori segmentation approach is adopted since the characteristics of tourists segments are previously unknown. Further, while a priori segmentation is based on the discretionary selection of variables, a posteriori segmentation can be based entirely on empirically delineated segments; the outcome is therefore much more in–depth (Bieger and Laesser, 2002; Formica and Uysal 1998). Hanlan et al. (2006) and Prayag (2010) also argued that the post hoc approach can offer an improved understanding of the key factors influencing the choice of a tourist destination and provide marketers with actionable information.
In terms of analytical approach, the widely accepted factor–cluster segmentation analysis was used. First, image attributes were factor analyzed to identify the underlying benefits sought. Then, the factor score for each respondent was used in stage two for clustering visitors into market segments. The goal of cluster analysis is to arrive at clusters of homogeneous people which differ in meaningful ways and display small within–cluster variation, but large between cluster variation. In the third stage, chi–square tests were used to explore the differences between clusters in terms of categorical variables such as demographic and travelling characteristics.
RESULTS
Descriptive statistics
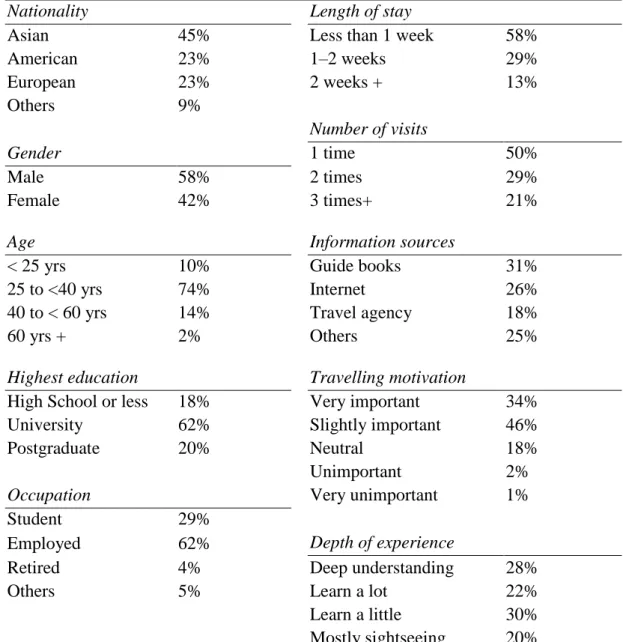
The descriptive statistics illustrating the socio–demographic and travelling profiles of respondents are shown in Table 1.
Table 1. Descriptive statistics: socio–demographic and travelling profiles
Nationality Length of stay
Asian 45% Less than 1 week 58%
American 23% 1–2 weeks 29% European 23% 2 weeks + 13% Others 9% Number of visits Gender 1 time 50% Male 58% 2 times 29% Female 42% 3 times+ 21%
Age Information sources
< 25 yrs 10% Guide books 31%
25 to <40 yrs 74% Internet 26%
40 to < 60 yrs 14% Travel agency 18%
60 yrs + 2% Others 25%
Highest education Travelling motivation
High School or less 18% Very important 34%
University 62% Slightly important 46%
Postgraduate 20% Neutral 18%
Unimportant 2%
Occupation Very unimportant 1%
Student 29%
Employed 62% Depth of experience
Retired 4% Deep understanding 28%
Others 5% Learn a lot 22%
Learn a little 30%
Mostly sightseeing 20%
Generally speaking, the majority of respondents were Asian (45%), male (58%), visitors aged from 25 to 40 years old (74%) and employed (62%). In terms of the travelling profiles, more than 50% stayed less than one week (58%) and were the first time visitors (50%). One third of respondents consulted mainly the guide books (31%), followed by internet (26%). To investigate further cultural tourist typology developed by McKercher (2002) and McKercher and du Cros (2003), five types of cultural tourist were identified using centrality of cultural tourism in destination choice (i.e. travel motives) and depth of experience as discriminators. Following McKercher (2002, p.34), the segments were defined based on the logical break points of the two
scaled questions. Purposeful cultural tourists were identified as those people who indicated that cultural reasons played a strong role in their decision to visit (4, 5) and who also had a deep experience (3, 4).Sightseeing cultural tourists indicated that cultural reasons played an important role in the decision to visit (4, 5), but who indicated that their experiences were fairly shallow (1, 2).Casual cultural tourists identified the midpoint in the motivation scale (3) and reported a shallow experience (1, 2). Incidental cultural tourists indicated that cultural tourism played little or no role in their decision to visit Taiwan (1, 2) and, concomitantly reported a shallow experience (1, 2).Serendipitous cultural tourists stated that cultural tourism played little or no role in their decision to visit (1, 2, 3) but had a deep experience (3, 4). The descriptive statistics revealed that, for 80% tourists, the importance of cultural attractions in their decisions to visit Taiwan played a very important (34%) or slightly important (46%) roles. One in three tourists (30%) stated that they had the opportunity to learn a little about Taiwan’s cultures, while nearly the same level of respondents (28%) indicated that they developed a deep understanding of Taiwan’s cultures.
Factor analysis
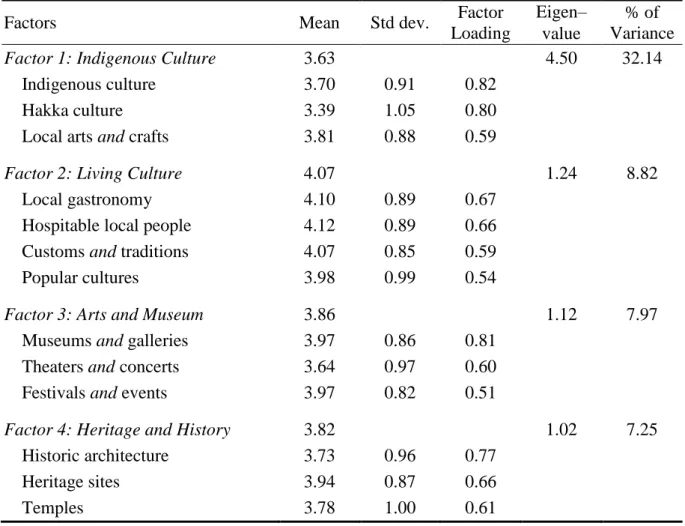
The next stage of data analysis involved the identification of underlying dimensions of the 14 image attributes using factor analysis (principal component analysis with varimax rotation). The KMO measure of sample adequacy (0.857) and the Bartlett's test of sphericity (2788.28, p= 0.000) confirmed the suitability of the data for factorization. This approach resulted in the extraction of four factors, explaining 56.19% of the total variance. Only factor loadings equal to or above 0.5, eigenvalues equal to or above 1 were chosen for interpretation. One original image attribute– industrial heritage, showed low communality and therefore was discarded. The discard does not signify its low importance but the diversity of these attributes, which needs to be considered individually. The reliability of these factors was assessed using Cronbach's alpha coefficients. Subscale reliabilities range from 0.71 to 0.93 and the overall reliability is 0.93. The factor solution along with the means and standard deviations of the variables is presented in Table 2.
– Factor 1, labelled as ‘Indigenous Culture’, consists of three items about Taiwan’s indigenous cultures, i.e. indigenous cultures, Hakka cultures and local arts and crafts.
– Factor 2, labelled as ‘Living Culture’, consists of four items reflecting the living, intangible, popular or less serious types of cultural consumption, i.e. local gastronomy, hospitable local people, customs and traditions and popular cultures.
– Factor 3, labelled as ‘Arts and Museum’, consists of three items, including museums and galleries, theatre and concerts as well as festivals and concerts.
– Factor 4, labelled as ‘Heritage and History’, consists of three types of tangible heritage, i.e. historic architecture, heritage sites and temples.
Cluster analysis
To identify tourist segments based on similar priority structures, the four image dimensions extracted from factor analysis were used as clustering variables. Determination of the number of clusters was based on the examination of the F–statistics from a two–, three–, four–, and five–cluster solution derived from a
K–means cluster analysis. The four–cluster solution was the most readily interpreted and most favourably met the criteria of measurable, accessible, substantial, actionable, and differentiable for effective segmentation (Kotler et al., 2002). ANOVA test showed that all the segments differed from each other, thus confirming that the segments are statistically different from each other in their mean scores.
Table 2. Result of factor analysis
Factors Mean Std dev. Factor
Loading
Eigen– value
% of Variance
Factor 1: Indigenous Culture 3.63 4.50 32.14 Indigenous culture 3.70 0.91 0.82
Hakka culture 3.39 1.05 0.80
Local arts and crafts 3.81 0.88 0.59
Factor 2: Living Culture 4.07 1.24 8.82
Local gastronomy 4.10 0.89 0.67
Hospitable local people 4.12 0.89 0.66
Customs and traditions 4.07 0.85 0.59
Popular cultures 3.98 0.99 0.54
Factor 3: Arts and Museum 3.86 1.12 7.97 Museums and galleries 3.97 0.86 0.81
Theaters and concerts 3.64 0.97 0.60
Festivals and events 3.97 0.82 0.51
Factor 4: Heritage and History 3.82 1.02 7.25 Historic architecture 3.73 0.96 0.77
Heritage sites 3.94 0.87 0.66
Temples 3.78 1.00 0.61
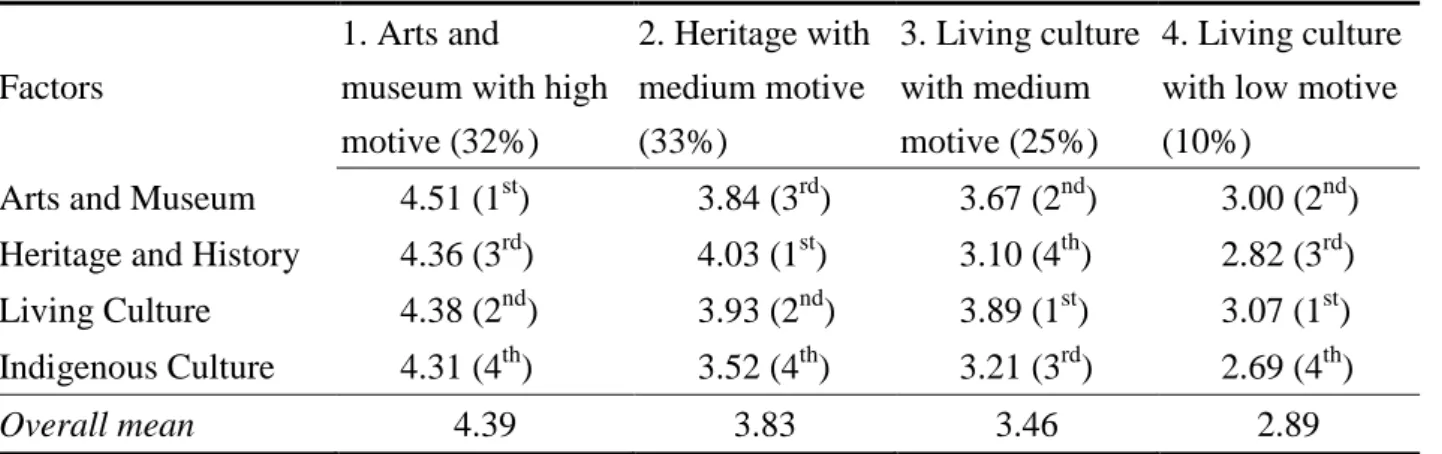
To delineate the clusters and to label them, the mean importance scores for each image dimension were calculated and then formed a priority structure for the four clusters. The results of cluster analysis, along with the corresponding cluster means and mean ranking across factors, are presented in Table 3. Based on the mean score characteristics with respect to the factors, these clusters were named as follows.
– Segment 1: Arts and museum with high motive (32%). This segment represents the second largest segment. It is different from other segments on the basis of the highest mean score assigned to arts and museum (4.51), and highly motivated to travel for cultural reasons (4.39). This segment, however, paid less attention to heritage (4.36), which differs significantly from the next segment.
– Segment 2: Heritage with medium motive (33%). This segment constitutes the largest segment of the market and attached the highest importance to heritage and history (4.03). Similar to segment 1, living culture was ranked as the second important factor by this segment; however, the overall importance attached to cultural attractions (3.83) is less than the previous segment (4.39). Segment 2 differs from segment 1 in that its
major concern is heritage rather than arts and museum – only ranked as the third place (3.84).
– Segment 3: Living culture with medium motive (25%). Compared to the above two segments, the most special feature of segment 3 is the highest importance level on living culture (3.89) and the lowest importance level on heritage and history (3.10). In terms of the overall means, this segment is ranked as the third place (3.46), so a label of medium motive was added.
– Segment 4: Living culture with low motive (10%). This segment is characterized by the smallest segment of the market and the lowest mean scores across all the factors. It has a similar priority structure to segment 3, namely both segments place higher importance on living culture, followed by arts and museum. The major difference between two segments lie in the lowest average importance score (2.89) assigned by this segment, so a label of low motive was attached to make a distinction from segment 3.
Table 3. Result of cluster analysis
Factors
1. Arts and
museum with high motive (32%) 2. Heritage with medium motive (33%) 3. Living culture with medium motive (25%) 4. Living culture with low motive (10%)
Arts and Museum 4.51 (1st) 3.84 (3rd) 3.67 (2nd) 3.00 (2nd) Heritage and History 4.36 (3rd) 4.03 (1st) 3.10 (4th) 2.82 (3rd) Living Culture 4.38 (2nd) 3.93 (2nd) 3.89 (1st) 3.07 (1st) Indigenous Culture 4.31 (4th) 3.52 (4th) 3.21 (3rd) 2.69 (4th)
Overall mean 4.39 3.83 3.46 2.89
Profiling of Segments
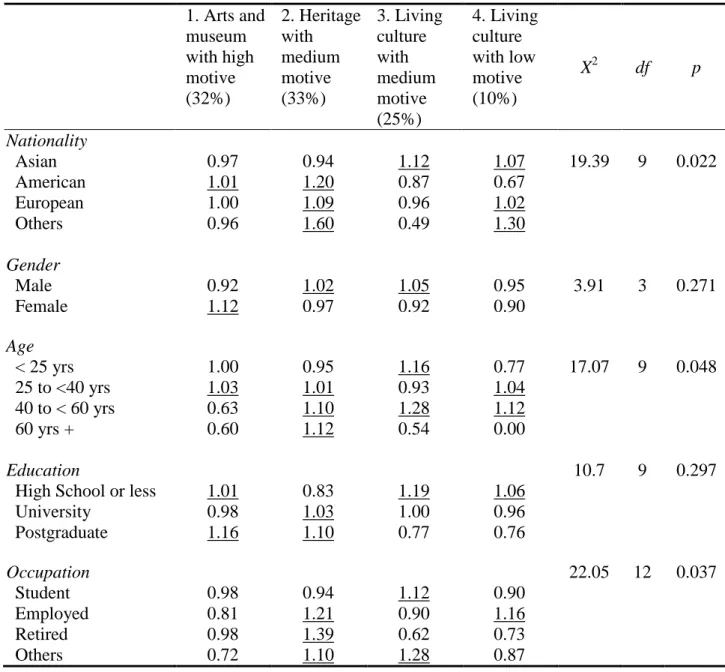
To further examine the differences among segments and provide practical information to formulate marketing strategy, the next stage of the analysis is to explore how these four customer segments differ. Each segment was cross–tabulated with external variables, including demographic and travelling characteristics. The differences were checked for statistical significance using chi–square tests. As shown in Table 4 and Table 5, only nationality, age, occupation, number of visits, travelling motivation and depth of experience accounted for significant differences in segment profiles. To avoid problems with different sample sizes across segments and among profiles, the data in Table 4 and Table 5 were normalized by using ratios. A ratio over 1.0 indicates well–represented and less than 1.0 indicates under–represented. For example, Asian visitors are highly represented in segment 3, with a ratio of 1.12, meaning that the percentage of ‘Asian’ in segment 3 is 12% higher than the overall percentage of the segment. In addition, to ease data interpretation, the well–represented ratios across segments were underlined. The implications of these findings are discussed as follows and only the profiles with statistically significant differences (p< 0.05) between segments were taken into account.
Table 4. Socio–demographic profiles of segments 1. Arts and museum with high motive (32%) 2. Heritage with medium motive (33%) 3. Living culture with medium motive (25%) 4. Living culture with low motive (10%) X2 df p Nationality Asian 0.97 0.94 1.12 1.07 19.39 9 0.022 American 1.01 1.20 0.87 0.67 European 1.00 1.09 0.96 1.02 Others 0.96 1.60 0.49 1.30 Gender Male 0.92 1.02 1.05 0.95 3.91 3 0.271 Female 1.12 0.97 0.92 0.90 Age < 25 yrs 1.00 0.95 1.16 0.77 17.07 9 0.048 25 to <40 yrs 1.03 1.01 0.93 1.04 40 to < 60 yrs 0.63 1.10 1.28 1.12 60 yrs + 0.60 1.12 0.54 0.00 Education 10.7 9 0.297
High School or less 1.01 0.83 1.19 1.06
University 0.98 1.03 1.00 0.96 Postgraduate 1.16 1.10 0.77 0.76 Occupation 22.05 12 0.037 Student 0.98 0.94 1.12 0.90 Employed 0.81 1.21 0.90 1.16 Retired 0.98 1.39 0.62 0.73 Others 0.72 1.10 1.28 0.87 DISCUSSIONS
As shown in Table 4, substantial differences were first noted by country of origin (X2= 19.39, p= 0.022). Western tourists were far more likely to travel to Taiwan for cultural reasons than visitors from Asian source markets. American and European visitors emphasized that cultural attractions, especially heritage and arts, played a very important role or was the major reason in their decision to visit Taiwan. More precisely, heritage (1.20) and arts (1.01) were well representative in the American market, while heritage (1.09) and living culture (1.02) drew particularly the attention of the European market. Western tourists also tended to embrace a wider range of cultural experiences than Asian tourists. On the contrary, culture had a lower importance while visitors from Asian countries made their decision of travelling. Further, they sought mainly the travelling experiences of living culture (1.21 and 1.07). As the perceived images of Asian to Western tourist changes across the cultural attractions continuum, McKercher and Chow’s (2001) and McKercher and du Cros’s (2003) arguments about the relationship between ‘cultural distance’ and types of cultural tourists
may offer further insights into the differences between Asian and Western tourists. They proposed that the culturally proximate market is generally interested in escapist, recreational and less culture motivated trips. On the other hands, culturally distant tourists tend to seek deeper cultural experiences.
Table 5. Travelling profiles of segments
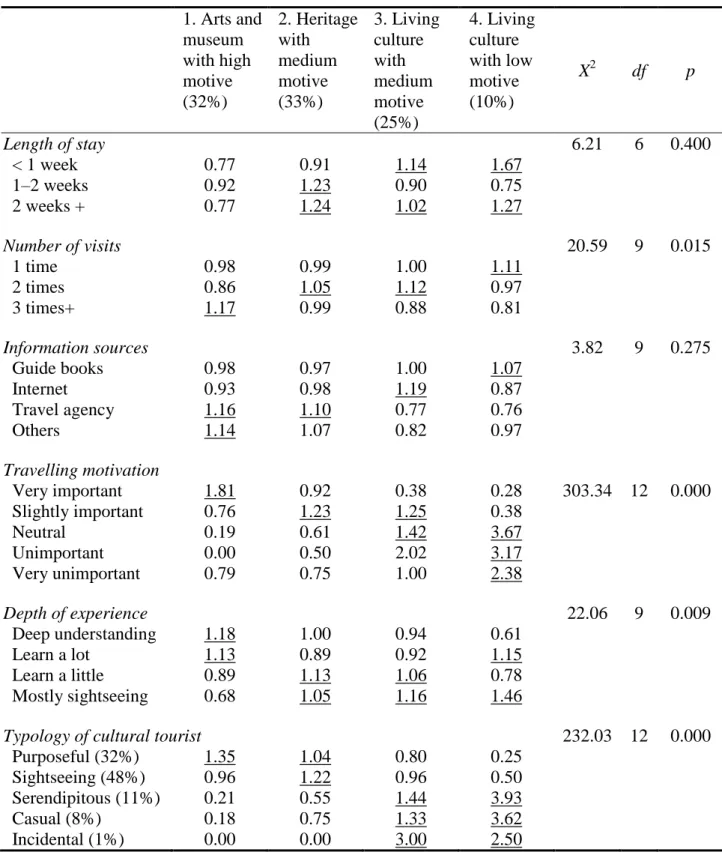
1. Arts and museum with high motive (32%) 2. Heritage with medium motive (33%) 3. Living culture with medium motive (25%) 4. Living culture with low motive (10%) X2 df p Length of stay 6.21 6 0.400 < 1 week 0.77 0.91 1.14 1.67 1–2 weeks 0.92 1.23 0.90 0.75 2 weeks + 0.77 1.24 1.02 1.27 Number of visits 20.59 9 0.015 1 time 0.98 0.99 1.00 1.11 2 times 0.86 1.05 1.12 0.97 3 times+ 1.17 0.99 0.88 0.81 Information sources 3.82 9 0.275 Guide books 0.98 0.97 1.00 1.07 Internet 0.93 0.98 1.19 0.87 Travel agency 1.16 1.10 0.77 0.76 Others 1.14 1.07 0.82 0.97 Travelling motivation Very important 1.81 0.92 0.38 0.28 303.34 12 0.000 Slightly important 0.76 1.23 1.25 0.38 Neutral 0.19 0.61 1.42 3.67 Unimportant 0.00 0.50 2.02 3.17 Very unimportant 0.79 0.75 1.00 2.38 Depth of experience 22.06 9 0.009 Deep understanding 1.18 1.00 0.94 0.61 Learn a lot 1.13 0.89 0.92 1.15 Learn a little 0.89 1.13 1.06 0.78 Mostly sightseeing 0.68 1.05 1.16 1.46
Typology of cultural tourist 232.03 12 0.000
Purposeful (32%) 1.35 1.04 0.80 0.25
Sightseeing (48%) 0.96 1.22 0.96 0.50 Serendipitous (11%) 0.21 0.55 1.44 3.93
Casual (8%) 0.18 0.75 1.33 3.62
The Asian visitors surveyed in the study came mainly from Japan, Korea, Honk Kong, Singapore and Mainland China. These countries all have similar cultural traditions, religions and societies as Taiwan, and can be regarded as being culturally proximate. The three Western markets examined (i.e. American, European and others) can be classified as being culturally distant. This finding enables the author to conclude that, as far as Taiwan is concerned, Asian and Western cultural tourists are fundamentally different. Generally, the greater the cultural distance, the more likely Taiwan’s heritage and arts are relevant to the visitors. The further the tourists’ home country is from Taiwan, the more likely they are more cultural motivated, since the cultural assets of Taiwan provide them a higher degree of otherness and an opportunity of cultural learning. However, Asian tourists tend to seek activities that are more entertaining or sightseeing oriented. Clearly, understanding the concept of cultural distance can be important to destination marketing.
In terms of the four demographic variables tested, significant differences were only found in age (X2= 17.07, p= 0.048) and occupation (X2= 22.05, p= 0.037) of the respondents. The findings correspond partially to previous research (e.g. McKercher, 2002; McKercher and du Cros, 2003) that suggested demographic variables are not accurate indicators of cultural tourism segmentation. Generally speaking, visitors aged less than 25 years old were more inclined to enjoy the living culture. On the other hand, those who aged between 25 to less than 60 years old were more motivated to visit Taiwan for high cultures and wished to learn about Taiwan’s arts and heritage. Visitors aged 60 years old or more showed a preference for visiting the heritage sites. This characteristic was also reflected by the occupation status, where students and retired people are dominant in segment 3 and 2 respectively. The employed or those who aged between 25 to less than 60 years old present an interesting case. They collected a wide array of experience, demonstrated by well–represented simultaneously in the segments of arts, heritage and living culture.
The above behavior patterns lead on to an interesting question of why some age or occupation groups pursue a wider range of cultural activities but the others have a more narrow cultural taste. The omnivorous/univorous framework introduced by some recent segmentation studies could be applied to explain the research findings. Please see Barbieri and Mahoney (2010); López–Sintas and García–Alvarez (2004) or Snowball (2010) for further explanation of the theoretical evolution of the omnivorous/univorous theory. As summarized by Snowball (2010, p.468): “although higher education and income groups were more likely to consume high culture, they were also more likely to consume a variety of popular cultural forms, what Peterson (1992) termed the cultural omnivores. Cultural univores, who consumed a much narrower range of cultural forms, were much more likely to have lower income and education levels”. As found by Peterson (1992) and Swanson et al. (2008), although higher education and occupational groups are more likely to report a taste for ‘‘high’’ culture, they also like a greater variety of popular or non–elite forms. On the other hand, those of lower education and occupational groups were much more likely to choose only one genre of cultural consumption and to be motivated by escapism. Further, older people are more likely to be motivated by aesthetic and educational activities.
A number of empirical works in academic literature (e.g. Baloglu and Mangaloglu 2001; Beerli and Martín, 2004a, 2004b) demonstrated that trip characteristics (such as length of stay, total trip duration and repeat visitation) and information sources all influence destination familiarity and perceived image. As
mentioned earlier, Baloglu (2001) operationalised the concept of destination familiarity as the composite of experiential and informational familiarity. In other words, destination familiarity can be accumulated through actual visitations to a destination (experiential familiarity) as well as exposure to destination related information in a consumer’s daily life (informational familiarity)(Chen and Lin,2012).
According to Table 5, no differences were noted among the length of stay (X2= 6.21, p= 0.400) and information sources (X2= 3.82, p= 0.275); however, significant differences emerged between segments in relation to the number of visits (X2= 20.59, p= 0.015). This finding corroborates previous studies that suggested past experience may be more important than information obtained from external sources (Baloglu, 2001; Ryan and Cave, 2005). When there is past experience, the criteria for decisions are strengthened, while the need to receive information becomes weaker. It appears that travelling experience plays a crucial role in influencing the cultural activities pursued, and can be of great use in segmenting the markets.
In terms of the importance among different image dimensions, first time visitors were motivated to visit Taiwan mainly by the living culture (1.11 for low motivation). For those who came to Taiwan for the second time, apart from the emphasis put on living culture (1.12 with low motive), they also preferred visiting heritage sites (1.05). By contrast, arts (1.17) held a great appeal to the visitors who visited Taiwan for the third time or more. However, the importance of living culture became lower order activity for these visitors. To sum up, more times the tourists come to Taiwan, heritage and arts become more important in their decision making. It is also a reflection that the first time visitors, half of the market, tend to participate for recreational and pleasure reasons and not for deep learning experiences.
Finally, since significant differences were noted in motivation (X2= 303.34, p= 0.000) and depth of experience (X2= 22.06, p= 0.009) (see Table 5), this study tested further the cultural tourism typology developed by McKercher (2002) and McKercher and du Cros (2003). Five types of cultural tourist were identified using centrality of cultural tourism in destination choice (i.e. motivation) and depth of experience as discriminators as explained earlier. Almost half of the research sample (48%) was classified as sightseeing cultural tourist, indicating that cultural reasons were an important reason for their visit to Taiwan; however their experiences were as being sightseeing orientated or as providing only limited learning opportunities. According to Table 5, nearly one third of the sample (32%) was identified as purposeful cultural tourist who was highly motivated to learn something about Taiwan’s culture and also had deep cultural experience. The other three types of cultural tourists account for only 20% as a whole. These people, with relatively small proportion of the sample, stated that cultural tourism played little importance in their travelling decision, although the depth of experience sought varied. These findings coincide partially with the findings of McKercher (2002) and McKercher and du Cros (2003); that is, the sightseeing cultural tourist dominates the market.
As demonstrated in Table 5, significant difference (X2= 232.03, p= 0.000) was noted in the images of different types of cultural tourists, supporting the studies of McKercher (2002) and McKercher and du Cros (2003) that centrality of cultural tourism in destination choice and depth of experience are validate variables in segmenting the cultural tourism market. Arts (1.35) and heritages (1.04) are of great importance for the purposeful cultural tourist. Heritages are also well representative (1.22) in the segment of sightseeing cultural
tourist. On the other hand, for those three types who were less motivated to travel for cultural reasons, namely serendipitous, casual and incidental cultural tourists, living culture had much higher importance in their travelling decisions. This finding explains further the relationship between the types of cultural tourist and the cultural activities pursued. A great discrepancy between the high cultural and popular cultural activities was found, where the underlying motivation of travelling played a significant role.
CONCLUSION
This paper tested the effectiveness of using image–based segmentation approach to identify segments of the cultural tourism market. Each destination has its own unique mix of cultural attractions that will appeal to different types of cultural tourists in different ways. Considering that the perceived images held by tourists affect significantly their travelling decisions, image–based segmentation may provide destination–specific information on preferred cultural experience which may provide guidelines for the allocation of promotional resources to the segments and the development of promotional messages. This study identified 14 image attributes of cultural attractions. Taiwan’s inbound tourists were then surveyed to rate the importance of these attributes. Four discrete image–based segments were identified according to the importance of images of cultural attractions in their decisions to visit Taiwan. This paper, hopefully, will advance the examination of cultural tourism by attempting to segment the market. The theoretical and managerial implications were summarized as follows.
First, significant differences were noted in the types of activities pursued depending on cultural distance, which has implications for the future development of cultural tourism. As suggested by McKercher and Chow (2001), different strategies need to be considered to develop the cultural tourism potential of a destination depending on the cultural distance of the target markets. The research findings suggest that near neighbors or culturally proximate markets may have less interest in the “high” cultures of a destination. For a destination like Taiwan, which has identified Asian countries, especially China, Japan and Korea, as its fastest dominant market, the clear inference is that Asian tourists come to Taiwan to pursue living culture. To succeed in this market, the destination management organizations should highlight relevant cultural elements in their promotional materials. For instance, stressing the uniqueness of Taiwan’s foods and way of life can be a strong marketing message for Asian tourists. It is also important to focus on the provisions of entertainment–oriented or sightseeing attractions for the culturally proximate markets. On the other hand, for the Western tourists, Taiwan will have to be positioned in another way. Since they are more cultural motivated and pursue deeper cultural experience, a strategy of offering more substantial and quality cultural tourism experience is therefore indispensable.
Second, the above discussions on the omnivorous/univorous framework demonstrated that the main source markets (the employed and those who aged between 25 to less than 60 years) are cultural omnivores. Knowing that over 80% of the market seeks diversity of experience, the tourism marketing authorities and tour operators should provide bundle sets of cultural experience that include both tangible and “high” cultures and an opportunity to experience Taiwan’s popular culture and way of life. To increase the appeal of destination, a well organized travel package that combine sightseeing tour, hands–on activities and
encountering with the locals can help to satisfy the diverse needs of the cultural tourists. The depth and variety of cultural experiences pursued can be affected not only by the cultural distance and the socio–demographic background of the visitors, but also the degree of destination familiarity. Since past travelling experience was noted to have significant influence on destination familiarity and perceived image, it is relevant to adopt some strangeness reduction strategies. For example, according to McKercher and du Cros (2003), it can be facili-tated by greater commoditization of the experience, greater emphasis on fun and entertainment and the provision of experience that can be consumed with little emotional or intellectual commitment.
This study tested further the cultural tourism typology proposed by McKercher (2002) and McKercher and du Cros (2003). Unlike a priori segmentation approach adopted by them, in which the segmentation variables were discretionarily selected, this study complements the previous works by applying a more objective and holistic a posteriori segmentation procedure. The results verified that centrality of cultural tourism in destination choice and depth of experience is validate variables in segmenting the cultural tourism market, but also identified a number of differences. These findings coincide partially with previous findings; that is, the sightseeing cultural tourist dominates the market. However, unlike their findings in which the purposeful cultural tourist represents a small niche market (11.8% in Hong Kong), this type of tourist has a greater share in Taiwan (32%). It may due to the fact that the survey was conducted in cultural attractions which have already separated the research sample from the rest of tourism population. The distribution of cultural tourists may also vary from destination to destination. As argued by McKercher (2002) and McKercher and du Cros (2003), it will be influenced by a number of factors, including the destination's position in the marketplace, its reputation as a cultural or heritage tourism destination, and the type of tourist attracted.
Finally, this study can serve as a springboard for several future research streams. First, the limitation of such an image–based method is difficult to make broad generalizations about cultural tourist perceptions between destinations. Replicating this study elsewhere would, no doubt, produce quite different segments. Future research can thus replicate this research design and explore potential additional market segments in other destinations. Second, the above findings revealed several theoretical discussions and implications, including the propositions of cultural distance, omnivorous/univorous, experiential and informational familiarity of destination and the two–dimensional model of cultural tourist typology. It would be interesting for further study to examine which elements influence more the perceived images.
REFERENCES
Andreu L, Bigne JE, Cooper C. 2001. Projected and perceived image of Spain as a tourist destination for British travellers. Journal of Travel and Tourism Marketing 9(4): 47–68.
ATLAS 2005. ATLAS Cultural Tourism Research Project 2004: Survey Report. The Association for Tourism and Leisure Education (ATLAS): Arnhem.
Baloglu S, McCleary KW. 1999. A model of destination image formation. Annals of Tourism Research 26(4): 868–897.
audience: an application of the univorous–omnivorous framework. International Journal of Tourism
Research 12(5): 481–496.
Basala S, Klenosky, D. 2001. Travel style preferences for visiting a novel destination: A conjoint investigation across the novelty–familiarity continuum. Journal of Travel Research 40(2): 172–183.
Beerli A, Martín JD. 2004a. Factors influencing destination image. Annals of Tourism Research 31(3): 657–681.
Beerli A, Martín JD. 2004b. Tourists’ characteristic and the perceived image of tourist destinations: A quantitative analysis – A case study of Lanzarote, Spain. Tourism Management 25(5): 623–636.
Bieger T, Laesser C. 2002. Market segmentation by motivation: the case of Switzerland. Journal of Travel
Research 41(1): 68–76.
Bonn MA, Joseph–Mathews SM, Dai M, Hayes S, Cave J. 2007. Heritage/cultural attraction atmospherics: creating the right environment for the heritage/cultural visitor. Journal of Travel Research 45(3): 345–354.
Boo S, Busser JA. 2005. The hierarchical influence of visitor characteristics on tourism destination images.
Journal of Travel & Tourism Marketing, 19(4): 55–67.
Chandler JA, Costello CA. 2002. A profile of visitors at heritage tourism destinations in East Tennessee according to Plog’s lifestyle and activity level preferences model. Journal of Travel Research 41(2): 161–166.
Chen CC, Lin YH. 2012. Segmenting Mainland Chinese tourists to Taiwan by destination familiarity: a factor–cluster approach. International Journal of Tourism Research 14(4): 339–352.
Chen PJ, Kerstetter DL. 1999. International students’ image of rural Pennsylvania as a travel destination.
Journal of Travel Research 37(2): 256–266.
DiMaggio P, Mukhtar T. 2004. Arts participation as cultural capital in the United States, 1982–2002: Signs of decline? Poetics 32(2): 169–194.
Dolnicar S. 2004. Beyond commonsense segmentation: a systematic of segmentation approaches in tourism.
Journal of Travel Research 42(3): 244–250.
Dolnicar S. 2002. Activity–based market sub–segmentation of cultural tourists. Journal of Hospitality and
Tourism Management 9(2): 94–105.
Echtner CM, Ritchie JR. 1993. The measurement of destination Image: an empirical assessment. Journal of
Travel Research 31(4): 3–13.
Formica S, Uysal M. 1998. Market segmentation of an international cultural – historic event in Italy. Journal
of Travel Research 36(4): 16–24.
Frías DM, Rodríguez MA, Castañeda JA. 2008. Internet vs travel agencies on previsit destination image formation: An information processing view. Tourism Management 29(1): 163–179.
Frías DM, Rodríguez MA, Castañeda JA, Sabiot CM, Buhalis D. 2012. The formation of a tourist destination’s image via information sources: the moderating effect of culture. International Journal of
Tourism Research 14(5): 437–450.
scaling techniques. Journal of Travel Research 28(2): 16–20
Hanlan J, Fuller D, Wilde S. 2006. An evaluation of how market segmentation approaches aid destination marketing. Journal of Hospitality and Leisure Marketing 15(1): 5–26.
Hughes HL, Allen D. 2005. Cultural tourism in Central and Eastern Europe: the views of ‘induced image formation agents’. Tourism Management 26(2): 173–183.
Kerstetter D, Confer J, Bricker K. 1998. Industrial heritage attractions: types and tourists. Journal of Travel
and Tourism Marketing 7(2): 91–104.
Kim H, Cheng CK, O’Leary JT. 2007. Understanding participation patterns and trends in tourism cultural attractions. Tourism Management 28(5): 1366–1371.
Kotler P, Armstrong G, Saunders J, Wong V. 2002. Principles of Marketing. 4th edn. Prentice Hall: New Jersey. Lee S, Scott D, Kim H. 2008. Celebrity fan involvement and destination perceptions. Annals of Tourism
Research 35(3): 809–832.
Leisen B. 2001. Image segmentation: the case of a tourist destination. Journal of Services Marketing 15(1): 49–64.
López–Sintas J, García–Á lvarez E. 2004. Omnivore versus Univore consumption and its symbolic: evidence from Spaniards’ performing arts attendance. Poetics 32(6): 463–483.
Macintosh AJ, Prentice RC. 1999. Affirming authenticity: consuming cultural heritage. Annals of Tourism
Research 26(3): 589–612.
McKercher B, Chow B. 2001. Cultural distance and cultural tourism participation. Pacific Tourism Review 5 (1/2): 21–30.
McKercher B, Ho P, du Cros H, Chow B. 2002. Activities based segmentation of the cultural tourism market.
Journal of Travel and Tourism Marketing 12(1): 23–46.
McKercher B. 2002. Towards a classification of cultural tourists. International Journal of Tourism Research
4(1): 29–38
McKercher B, Du Cros H. 2003. Testing a cultural tourism typology, International Journal of Tourism
Research 5(1): 45–58
Ng SI, Lee, JA, Soutar GN. 2007. Tourists’ intention to visit a country: the impact of cultural distance.
Tourism Management 28(6): 1497–1506.
Nyaupane GP, White DD, Budruk M. 2006. Motive–based tourist market segmentation: an application to native American cultural heritage sites in Arizona, USA. Journal of Heritage Tourism 1(2): 81–99
O’Leary S, Deegan J. 2003. People, pace, place: Qualitative and quantitative images of Ireland as a tourism destination in France. Journal of Vacation Marketing 9(3): 213–226.
O’Leary S, Deegan J. 2005. Ireland’s image as a tourism destination in France: attribute importance and performance. Journal of Travel Research 43(3): 247–56.
Peterson RA. 1992. Understanding audience segmentation: from elite and mass to omnivore and univore.
Poetics 21(4): 243–258.
Prayang G. 2010. Images as pull factors of a tourist destination: a factor–cluster segmentation analysis.
Prentice R. 2004. Tourist familiarity and imagery. Annals of Tourism Research 31(4): 923–945.
Prentice RC, Witt SF, Hamer C. 1998. Tourism as experience: the case of heritage parks. Annals of Tourism
Research 25(1): 1–24.
Richards G. 1996. Cultural Tourism in Europe. CAB International: Wallingford.
Royo–Vela M. 2009. Rural–cultural excursion conceptualization: a local tourism marketing management model based on tourist destination image measurement. Tourism Management 30(3): 419–428.
Ryan C, Cave J. 2005. Structuring destination image: a qualitative approach. Journal of Travel Research 44(2): 143–150.
Sánchez‐Rivero M, Pulido‐Fernández JI. 2012. Testing heterogeneous image in cultural/non–cultural tourism markets: a latent model approach. International Journal of Tourism Research 14(3): 250–268.
Silberberg T. 1995. Cultural tourism and business opportunities for museums and heritage sites. Tourism
Management 16(5): 361–365.
Smith MK. 2003. Issues in Cultural Tourism Studies. Routledge: Oxon.
Snowball JD, Jamal M, Willis, KG. 2010. Cultural consumption patterns in South Africa: an investigation of the theory of cultural omnivores. Social Indicators Research 97(3): 467–483.
Stebbins RA. 1996. Cultural tourism as serious leisure. Annals of Tourism Research 23(4): 948–950.
Swanson S, Davis J, Zhao Y. 2008. Art for arts’ sake? an examination of motives for arts performance attendance. Non–profit and Voluntary Sector Quarterly 37(2): 300–323.
Tasci ADA, Gartner WC. 2007. Destination image and its functional relationships. Journal of Travel Research
45(4): 413–425.
Timothy DJ. 1997. Tourism and personal heritage experience. Annals of Tourism Research 24(3): 751–754. van der Ark LA, Richards G. 2006. Attractiveness of cultural activities in European cities: A latent class
approach. Tourism Management 27(6): 1408–1413.
Vogt CA, Andereck KL. 2003. Destination perceptions across a vacation. Journal of Travel Research 41(4): 348–354.
國科會補助專題研究計畫成果報告自評表
請就研究內容與原計畫相符程度、達成預期目標情況、研究成果之學術或應用價
值(簡要敘述成果所代表之意義、價值、影響或進一步發展之可能性)
、是否適
合在學術期刊發表或申請專利、主要發現或其他有關價值等,作一綜合評估。
1. 請就研究內容與原計畫相符程度、達成預期目標情況作一綜合評估
▓達成目標
2. 研究成果在學術期刊發表或申請專利等情形:
論文:▓
已投稿至 SSCI 國際期刊 International Journal of Tourism Policy 審查中。3. 請依學術成就、技術創新、社會影響等方面,評估研究成果之學術或應用價
值(簡要敘述成果所代表之意義、價值、影響或進一步發展之可能性)(以
500 字為限)
This study aims at testing the effectiveness of using image–based approach to segment the cultural tourism market. Identifying 14 image attributes of cultural attractions, Taiwan’s inbound tourists were then surveyed to rate the importance of these attributes. Applying factor–cluster and a posteriori segmentation approach, four discrete image segments were identified, including arts and museum, heritage, living culture, and resulted in a sample of 954 respondents. The research findings reveals several theoretical and empirical implications, including the propositions of cultural distance, omnivorous/univorous, experiential and informational familiarity of destination and the two–dimensional model of cultural tourist typology.
This study can serve as a springboard for several future research streams. First, the limitation of such an image–based method is difficult to make broad generalizations about cultural tourist perceptions between destinations. Replicating this study elsewhere would, no doubt, produce quite different segments. Future research can thus replicate this research design and explore potential additional market segments in other destinations. Second, the above findings revealed several theoretical discussions and implications, including the propositions of cultural distance, omnivorous/univorous, experiential and informational familiarity of destination and the two–dimensional model of cultural tourist typology. It would be interesting for further study to examine which elements influence more the perceived images.
1