國
立
交
通
大
學
電機學院光電工程研究所
博 士 論 文
應用時序驅動之發光二極體背光源於
提升液晶顯示器之影像品質研究
Sequential Driving Light Emitting Diode Backlight for Image
Quality Enhancing on Liquid Crystal Display Applications
研 究 生:陳均合
指導教授:謝漢萍教授
應用時序驅動之發光二極體背光源於
提升液晶顯示器之影像品質研究
Sequential Driving Light Emitting Diode Backlight for Image
Quality Enhancing on Liquid Crystal Display Applications
研 究 生: 陳均合 Student:Chun-Ho Chen
指導教授: 謝漢萍 Advisor:Han-Ping D. Shieh
國 立 交 通 大 學
電機學院光電工程研究所
博 士 論 文
A ThesisSubmitted to Institute of Electro-Optical Engineering College of Electrical and Computer Engineering
National Chiao Tung University in partial Fulfillment of the Requirements
for the Degree of Doctor of Philosophy
in
Electro-Optical Engineering 2009
Hsinchu, Taiwan, Republic of China
應用時序驅動之發光二極體背光源於
提升液晶顯示器之影像品質研究
博士研究生:陳均合 指導教授:謝漢萍 教授
國立交通大學 光電工程研究所
摘 要
隨著液晶顯示器的普及,顯示器規格也朝著高畫質與低功耗的方向發展。發 光二極體(Light emitting diode, LED) 由於具有高色彩飽和度、局部控制的自 由 度 與 快 速 響 應 的 特 性 等 優 勢 , 遂 成 為 取 代 傳 統 冷 陰 極 管 (Cold cathode fluorescence light, CCFL)於液晶顯示器背光源的重要技術。採用發光二極體 為背光源其優點為薄型化、重量輕及低耗電量,目前已被廣泛使用在攜帶式顯示 器與高階監視器的產品上。在進一步降低耗電量的 LED 背光顯示系統之發展上, 如不需使用彩色濾光片的色場序列法(field sequential color),由視覺暫留原 理可感知彩色影像,能大幅提昇提升系統效率與色域範圍。然而,因眼睛視點與 所視物體的相對運動導致各色場於視網膜上非完美疊合時,造成的色彩分離 (color break-up)現象需要被克服和抑制。 為了解決色分離問題,在中小尺寸的液晶顯示器,本論文提出了藉由規律 變換色場的方式,使在視網膜上連續影像積分無色分離的結果,能有效的解決人 眼追跡運動物體所造成的動態色分離現象。在液晶反應時間的限制內,我們也提 出了分配影像強度到白色色場來解決靜態色分離現象,稱為 RGBW 方法。然而若 是影像內容僅由兩個三原色為主要構成,其色彩重分配的效果會受影響。於是我們進而提出,依據影像內容調整第四個色場為青綠或黃色的 RGBC/RGBY 的交換色 場序列方式,用以改善色彩重分配的程度。基於此方式,並更進一步發展決定最 佳色場之演算法。藉由動態調整背光源顏色與搭配液晶同步處理,能集中影像強 度於單一色場降低色分離現象,使其影像品質與顯示功能獲得提升。本論文並發 展以視覺感受(visual perception)基礎上評估影像品質的條件和迴授控制 (feedback control)的顯示電子電路,來實現動態即時的影像運算。由觀賞者感 受與色分離指標,皆證明此方法是可以有效改善色分離現象,以及量產實現化的 設計與技術。 針對大尺寸顯示器,應用局部控制的 LED 背光系統,針對局部影像調整的 彩色背光對各區域來作色分離抑制的優化,具有提升顯示器動態範圍與影像的對 比度,同時達到進一步降低功耗的優點。然而,此局部控制的背光源存在著區域 範圍之光分佈最佳化議題,而本論文由分析人眼視覺對比敏感度,找出不可察覺 邊界的背光分佈條件,以視角定義區塊的大小得到適當區塊數目設計通式。並且 對邊界察覺度與對比增強度的交換考慮,推導出最佳的高斯分佈函數。符合此推 薦值的光分佈設計,能有效提升對比,保持高均勻性,同時避免邊界察覺的現象 以確保影像品質。 論文中展現了時序法驅動 LED 背光之光學和電路設計於液晶顯示器產業的 重大應用潛力,提供技術上進一步設計與解決方案來開發高畫質低功耗的顯像技 術。而結合光學模擬與電路實現的動態優化影像品質技術,也將在未來顯示器產 業中具有益形的重要地位。
Sequential Driving Light Emitting Diode Backlight for
Image Quality Enhancing on
Liquid Crystal Display Applications
Doctoral Student: Chun-Ho Chen Advisor: Dr. Han-Ping D. Shieh Institute of Electro-Optical Engineering
National Chiao Tung University
Abstract
The popularity of liquid crystal displays (LCD) has encouraged designers to develop the LCD for high image quality and low power consumption. Light emitting diodes (LED), as LCD backlights has advantage in high color saturation, locally controlled ability, and fast on/off response, thus becomes major light sources to replace typical cold cathode fluorescence light (CCFL). Currently, LED backlighting is widely utilized in the mobile and high-level monitors because of its features such as thin format, light weight, and low power consumption. In the further development of LED backlighting, the field sequential color (FSC) mechanism, requiring no color filters to form color images, can greatly improve the light efficiency and the color gamut in perception. However, the color breakup (CBU) is essential to be suppressed while the color fields are not overlapped precisely in retina by the relative motion between viewing points and objects.
To resolve the CBU issue under the restriction of LC response time, on small and medium-sized LCDs we proposed a color field arrangement method to blur the integration of color fields in retina. The dynamic CBU induced by eye tracking objects can be eliminated. For the static CBU suppression, the RGBW method was described to redistribute the image intensity to a while field and discolor the primaries. The effectiveness of color redistribution depends on image content; therefore, we
proposed an exchange of color sequence RGBC/Y to modify the CBU artifact. Based on this dynamic control method, the optimized color field instead of yellow and cyan is determined by intelligently adapting the incoming video content. To concentrate image intensity into a single field, further reductions in CBU visibility can be achieved. We presented the index of CBU evaluation according to visual perception and the feedback control algorithm of color field optimization in real time application. After the implementation and observation, these proposed methods were confirmed as practical ways of CBU reductions in FSC applications.
For large-sized LCDs, the locally controlled LED backlight can be applied to adapt corresponding parts of image for local reduction of CBU visibility. Local adaptive backlighting also benefits the dynamic range, contrast, and power consumption. However, there is a design trade off on the light profile of each segment. Based on human contrast sensitivity function, we derived a threshold of insensible boundary and a general condition of segment number in angular unit. We evaluated the boundary visibility and contrast enhancement to identify the Gaussian light profile as a recommended one for contrast improvement, uniformity maintenance, and boundary imperceptions.
In this thesis, we presented the optical and circuit design of sequential driving LCD and provided technical solutions for upgrading the image quality and power consumption. Combining the optical model and circuit implementation for adaptive image optimization is anticipated to play a substantial role of the incoming display industry.
Acknowledgement
一晃眼五年多的光陰過去了,各種酸甜苦辣的往事仍歷歷在目。這一路上, 對於指導我的師長同事們和曾經陪伴我的親朋好友們,在此以感激的心情來表達 我滿滿誠摯的謝意。 首先要感謝指導教授謝漢萍老師,提供優質的環境使我順利地作研究。此 外,謝老師嚴格且耐心的要求,更是砥礪我成長的一大動力。謝老師更提供了產 學合作與國際交流的機會,大大地擴展我的視野。謝老師的學識與風範也是我心 目中待人接物與自我實現的典範。同時謝謝黃乙白老師,有系統地引導大家思 考,有效率地解決各式研究上的疑惑,也對大家的近況不吝付出關心。在荷蘭期間,感謝Dr. Hugo Cornelissen 與 Dr. Fetze Pijlman 對我研究與生活上的照顧,讓
我有幸一窺一流的設備規模及見識到各國頂尖人員、實習學生們如何的激發創 意,通力合作以發展前瞻性的研究,更提醒我面對的是全球的競爭,要努力不懈, 以期百尺竿頭更進一步,為學校及國家爭取榮譽。另外感謝陳科宏老師,田仲豪 老師,陳皇銘老師,和口委們的提點指教,才能使論文更趨完備。此外,我還衷 心感謝張瑋心老師與 Steve Wallace 老師不厭其煩地加強我英語寫作與口語的能 力,豐富了這無形也是往後重要的資產。 在實驗室的研究與生活上,要謝謝一起努力的芳正、裕國、喬舜、柏儒、彥 行、健翔、璧如、子翔、淇文、泩宏及博濟,也感謝安琪學姐、企桓學長、仁宇 學長、文奎學長、克偉學長、光裕學長、彥仲學長及豐旭學長在經驗上的傳承。 對於玉棉、俊傑、俞文、耀中、哲仁、雅婷、振宇、秉宜、勝昌、建良、宛徵、 景明、國振、仁杰、崑展、慶得、玓玓及已畢業的優秀學弟妹們,謝謝大家的幫 忙。目前就讀的博文、靖堯、浩彣、宜如、宜伶、世勛、期竹及建宇,謝謝你們 在研究上的參與。還要謝謝鄭榮安博士與助理小姐們,讓實驗室有組織有效率的 運作。 此外我要感謝友達光電的劉軍廷副總、汪德美副理、許時嘉先生、杜昌隆先 生、蔡博仁先生、中華映管的陳司芬處長、劉家麟經理、戴文智博士、施奕丞先 生、徐名潭先生、蔡繼中先生、何明宗先生、飛利浦的工程師Stefan、Gilbert、 Wim、Roberto、Giovanni、Eugen、Marcel及許許多多曾經幫助過我的人,謝謝 你們。 對於我一路陪伴的好友,詠翔、金祺、聖萱、欣儀、正楓、中玓、崑健、旻 昇、詠鈞、柔蒨、益豪、家恩、昱礽及玉麟和室友佳煌、宜憲及龍毅和同為實習 學生的 Laure、Jose、Johan、Lidia、Thomas、Fadi、Michael 及 Youbin,謝謝你 們在相處時光中對我的鼓勵及關懷,帶給我許多美好的回憶與值得回味的點點滴 滴。 最後,也是最重要的,要感謝我的爸媽、姊姊和奶奶,感謝您們的支持與鼓 勵,讓我無後顧之憂的完成學業順利取得博士學位。往後的人生,我會好好的孝 順您們,報答您們一直以來為我無怨無悔的付出。我由衷地、深深地感激。
Table of Contents
Abstract (Chinese) ...i
Abstract (English) ... iii
Acknowledgement ...v
Table of Contents ...vi
Figure Captions ... viii
List of Tables... xiii
Chapter 1 Introduction...1
1.1 Liquid crystal displays (LCDs)...2
1.2 Light emitting diodes (LEDs) ...5
1.3 LED backlight applications in LCDs...7
1.4 Motivation and objective of this thesis ...8
1.5 Organization of this thesis ...11
Chapter 2 CBU Mechanism and Driving Technologies ...13
2.1 Physiology of eye movements ...13
2.2 Mechanism of CBU ...15
2.3 Color difference (delta E) ...18
2.4 Hardware involved in sequential driving...23
2.5 Summary...30
Chapter 3 Proposed CBU Suppression Methods ...31
3.1 Color fields arrangement...31
3.2 RGBW method...39
3.3 RGBC/RGBY method...43
3.4 Summary...48
Chapter 4 Adaptive LC/BL Feedback Control ...49
4.1 The platform of FSC-LCD...49
4.2 RGBC/Y results ...52
4.3 Concept of adaptive backlight ...54
4.4 Feedback control for optimized BL determination method ...57
4.5 Results...61
Chapter 5 Local Adaptation and Boundary Issue ...65
5.1 Contrast sensitivity function considered...66
5.2 Verification using Lorentz distribution ...68
5.3 Modified profile for 2D-dimming backlight...72
5.4 Proper light distribution formula ...76
5.5 Summary...81
Chapter 6 Conclusion and Future Work ...82
6.1 Conclusion ...82
6.2 Future work...87
Reference...91
Appendex Implementation of FPGA ...98
A.1 Clock generation module ...99
A.2 Input Buffer module...100
A.3 Image process module...101
A.4 Timing controller module...113
A.5 Summary ...118
Publication List ...119
Figure Captions
Fig. 1-1 The various kinds of LCDs. ...2
Fig. 1-2 The cross-section view of an LCD...2
Fig. 1-3 The ON-stare, OFF-state, and gray-state of one pixel on an LCD...3
Fig. 1-4 The edge-lit and direct-lit backlight systems. ...4
Fig. 1-5 The white LED and colored LEDs...6
Fig. 1-6 The comparison of spectrums between CCFL and RGB LED. ...6
Fig. 1-7 The normal LCD with color filters and the FSC concept. ...6
Fig. 1-8 The display mechanism of an FSC-LCD. ...7
Fig. 1-9 (a) An original image and (b) a CBU image. ...8
Fig. 1-10 The thesis architecture...9
Fig. 2-1 Structure of human eye. ...14
Fig. 2-2 (a)Perceived image and (b) saccade movement (black line)...14
Fig. 2-3 The scheme of CBU phenomenon in a conventional FSC-LCD. ...16
Fig. 2-4 (a) The relationship between time and display position of a simulation scheme and (b) CBU image in a visual system. ...17
Fig. 2-5 (a) Image in an FSC-LCD and path of a saccade. (b) Observed CBU during or just after the saccade...18
Fig. 2-6 The CIE standard observer color-matching functions...20
Fig. 2-7 (a) A 3D figure of visible colors and (b)the CIE xyz. ...21
Fig. 2-8 The CIE Lu’v’. ...22
Fig. 2-9 The display electronic circuit ...24
Fig. 2-10 The transition between splay and bend states in an OCB mode LC ...24
Fig. 2-11 The transition curve from splay to bend state in OCB mode LC[82] ...25
Fig. 2-12 The timing diagram of RSDS...26
Fig. 2-13 Serial data input timing diagram of the LED controller...28
Fig. 3-1 (a) Color fields of RGB, GBR, and BRG in three consecutive frames (b) the relation between time and location of motional image...32 Fig. 3-2 (a) Mechanisms of the color breakup when eyes follow the motional image, (b) an integrated image in three consecutive frames with the CFA method. .33
Fig. 3-3 (a) Color fields of RGBR, GBRG, and BRGB in three consecutive frames, (b) the relation between time and location of motional white bar with width of 8 pixels and velocity of 6 pixels/frame, and (c) the simulation image on retina
with the 4-CFA method when eyes follow the image...34
Fig. 3-4 The block diagram of the FSC controller. ...35
Fig. 3-5 The timing chart of the 4-CFA FSC-LCD. ...36
Fig. 3-6 The camera-tracking equipment...37
Fig. 3-7 Photos of a moving white bar, which were taken by a tracing camera, with bar widths of 15 and 30 pixels, velocities of 3 and 6 pixels/frame. ...38
Fig. 3-8 Photos of moving cyan and yellow bars, which were taken by a tracing camera, with bar width of 15 pixels and velocity of 6 pixels/frame...38
Fig. 3-9 The flow chart of RGBW algorithm...40
Fig. 3-10 The CBU simulation images by using (a) RGB and (b) RGBW methods. ..41
Fig. 3-11 The images displayed by a 5.6-inch FSC-LCD with (a) RGB and (b) RGBW methods...42
Fig. 3-12 The static CBU images for (a) RGB and (b) RGBW methods. ...42
Fig. 3-13 The R, G, B, and W fields of an image...43
Fig. 3-14 The relation between time and location of moving image on (a) a conventional RGB 3-field and (b) the redistributed color FSC displays...44
Fig. 3-15 The gray levels in red and green/green and blue are redistributed to yellow/cyan field to form a full color image. ...44
Fig. 3-16 The gamma function and an example of new gray level of one pixel in red field. ...45
Fig. 3-17 The flowchart of gray level redistribution and the following frame in (a)RGBY or (b)RGBC color sequence. ...46
Fig. 3-18 The block diagram of system architecture. ...47
Fig. 4-1 The display circuit of FSC-LCD. ...50
Fig. 4-2 The LC panel module of FSC-LCD. ...50
Fig. 4-3 The LED backlight of FSC-LCD. ...51
Fig. 4-4 The demonstration of a gradual change of color board...51
Fig. 4-5 Photos of (a) still images and (b) moving color bars taken by a tracing camera, with colors of white, yellow, cyan, and three specific colors. (c) The comparison between gray levels without and with modifications...53
Fig. 4-6 The comparison between Esum with conventional and the proposed method and the suppression ratio of this method to conventional one...54 Fig. 4-7 The color field sequences and simulated CBU images on (a) conventional
RGB 3-field and (b) rearranged color FSC displays. ...55 Fig. 4-8 The simulated CBU images of Lena in three conditions of (a) none, (b) c/y, and (c) proposed D-field...56 Fig. 4-9 The relation between color difference and backlight bit number...58 Fig. 4-10 The relation between the error rate of color difference and sampling period.
...58 Fig. 4-11 The concept of optimized BL determination and image processing in a real time application. ...59 Fig. 4-12 (a) The flowchart and (b) an example of gray level determination of color backlight are according to the image content and color differences...60 Fig. 4-13 The variation of color difference Esum with a scrolled speed of one
image per second for these test images...61 Fig. 4-14 The Esum comparison of test images with conventional, c/y, and
dominated RGB methods and the ratio of Esum of DRGB to conventional one...62 Fig. 4-15 The CBU images with (a) conventional RGB and (b) adaptive DRGB fields.
...63 Fig. 5-1 The thesis architecture...65 Fig. 5-2 (a) Contrast sensitivity function and (b)with experimental values ...66 Fig. 5-3 (a) Full-on backlight, (b) original of camera man, (c) 2D-dimming backlight, and (d) the gradient of 2D-dimming backlight. ...69 Fig. 5-4 The selected images over different spatial scale. (a) Original image, (b)
2D-dimming backlight, and (c) the contour of gradient image (100x)...71 Fig. 5-5 The backlight contrast ratio per images as a function of segment size. The
solid line corresponds to the contrast ratio averaged over all the images. ....72 Fig. 5-6 The percentage of pixel numbers below the threshold per gradient images as a function of segment size. The solid line corresponds to the average over all the images. ...73 Fig. 5-7 The backlight contrast ratio and the percentage of pixel numbers below the threshold of gradient images as a function of segment and spatial filter size. The lines correspond to the average over 5 images...74 Fig. 5-8 The segment numbers of screen as a function of segment size. The lines
correspond to the viewing distances of factors of 1.5 to 6 longer than screen diagonal...75 Fig. 5-9 Three points in the model for light source contribution analysis...77 Fig. 5-10 Summation of differences and parameters in (a) 7x7 array (b) 15x15 and
Fig. 5-11 Summation of differences and parameters with sharp factor (a) b=2 (b) b=3
...79
Fig. 5-12 Similarity between a, b, k model , Gaussian, and Lorentz distributions...80
Fig. 5-13 (a) 2D-dimming (b) full-on backlight image of Gaussian distribution ...80
Fig. 6-1 The (a) original image and individual color fields of (b)global and (c)local adaptive backlights. ...89
Fig. 6-2 The CBU images with (a) non-, (b) global, and (c) local adaptation...89
Fig. 6-3 The schematic of added white LEDs into the backlight module...89
Fig. A-1 The framework of controlled circuit...98
Fig. A-2 The block diagram of clock generation module. ...99
Fig. A-3 The synthesis of clock generation module...100
Fig. A-4 The block diagram of input buffer module...100
Fig. A-5 The synthesis of input buffer module. ...101
Fig. A-6 The block diagram of image process module...101
Fig. A-7 The synthesis of image process module. ...102
Fig. A-8 The block diagram of timing generation logic. ...103
Fig. A-9 The synthesis of timing generation logic...104
Fig. A-10 The block diagram of write control logic. ...105
Fig. A-11 The synthesis of write control logic...105
Fig. A-12 The block diagram of write buffer controller. ...106
Fig. A-13 The synthesis of write buffer controller...107
Fig. A-14 The block diagram of read control logic. ...108
Fig. A-15 The synthesis of read control logic...108
Fig. A-16 The block diagram of read buffer controller...109
Fig. A-17 The synthesis of read buffer controller. ...110
Fig. A-18 The block diagram of frame buffer interface... 111
Fig. A-19 The synthesis of frame buffer interface. ...112
Fig. A-20 The block diagram of timing controller module...113
Fig. A-21 The synthesis of timing controller module. ...114
Fig. A-22 The block diagram of source driver controller. ...115
Fig. A-24 The block diagram of gate driver controller. ...116
Fig. A-25 The synthesis of gate driver controller. ...116
Fig. A-26 The block diagram of backlight driver controller...117
List of Tables
Tab. 2-1 The specifications of (a) the gate driver and (b) the source driver for the TFT LCD panel...27 Tab. 2-2 Tthe specifications of LED driver ...28 Tab. 3-1 The lowest field frequency that produces invisible flicker for each color ....33 Tab. 4-1 Specifications...52 Tab. 5-1 The relation between pixel number and frequency in LCD TV and laptop...67 Tab. 5-2 The relation between distance and contribution of light sources ...77 Tab. 6-1 The comparison between normal RGB, 3 prior arts described in Chapter1,
Chapter 1
Introduction
Liquid Crystal Displays (LCDs) have become the dominant display technology for applications ranging from small mobile devices, notebooks, car navigation systems up to large-sized television sets as shown in Fig. 1-1[1]. This high penetration level can be attributed to a host of advantageous features, including high resolution, high brightness, light-weight and a thin form factor. Each individual pixel in a black and white LCD and each sub-pixel in a color display are created from a source of light and a light valve, which can modulate the light on, off, or to some intermediate level. Millions of light valves form the LC panel, while a source of light and optic films create the illumination.
Light Emitting Diodes (LEDs) are widely used as indicator lights on electronic devices and increasingly in illumination applications of backlighting for LCDs [2][3]. The LED backlight has the advantages such as small form factor, mercury-free, wide color gamut, quick light-up operation, long life time, etc. [4] Especially, the LED is very suitable for a local addressable [5][6] or a sequential driving backlight [7]-[9]. Among LCDs, the LED illumination becomes a popular technology for applications of high image quality and low power consumption.
Fig. 1-1 The various kinds of LCDs.
Fig. 1-2 The cross-section view of an LCD.
1.1 Liquid crystal displays (LCDs)
A cross-section of an LCD reveals its elements. The LCD panel is at the center of the display where the liquid crystal itself is located. Transparent electrodes patterned on each pane of glass encompass the liquid crystal as shown in Fig. 1-2. The orientation of the liquid crystal can be changed in subtle ways by applying a voltage to the electrodes in order to change the level of illumination displayed in each sub-pixel.
The LCD panel is the essential component in a display that controls the amount of light reaching the viewer. Light passes through a bottom polarizer that orients the
light to a single state of polarization by absorbing over 50% of the incoming unpolarized light. The polarized light then passes through the liquid crystal layer. The orientation of liquid crystal can be controlled by applying a voltage to the transparent electrode on the glass encompassing it. The degree of orientation of liquid crystal controls the degree of rotation of the incoming polarized light with a typical Twisted Nematic (TN) LCD. When there is no voltage applied to the electrodes, the liquid crystal is naturally oriented to rotate the light 90 degrees allowing it to pass freely through the top polarizer. However, if a voltage is applied, the liquid crystal aligns to the electric field and does not rotate the light, allowing the top polarizer to block it completely. By applying an intermediate voltage, the liquid crystal can be partially oriented to partially rotate the incoming light, creating shades of gray as shown in Fig. 1-3. Adding a color filter to the LCD panel creates color displays. In a color LCD, each red, green and blue sub-pixel is individually controlled, allowing varying amounts of red, green, and blue light through to the viewer for each pixel.
The uniform illumination of an LCD is achieved with either a lightguide in an edge lit system or a diffuser plate in a direct lit system as shown in Fig. 1-4 [10][11]. Edge lit backlights are typically used in handheld displays, notebook computers and computer monitors where display thickness is important. In the edge lit backlight, light from a row of LEDs or one or more fluorescent lamps enters a lightguide, which transports the light across the surface of the lightguide through total internal reflection [12]. The light is then extracted at specifically engineered points to uniformity illuminate the entire display. As the display area increases, multiple lamps can be placed at the edges of the lightguide to achieve sufficient brightness. There is a limit to the number of lamps that can be crowd at the edge of a lightguide. However, for larger area displays, such as most LCD TVs, direct-lit backlights are used [13][14]. In the direct lit backlight, LEDs or a set of fluorescent lamps are placed directly behind a thick white diffuser plate that spreads the light of the point sources or line sources uniformly [15][16].
1.2 Light emitting diodes (LEDs)
All LCDs require a source of light to illuminate the LCD panel. The choice of a light source is critical in balancing the requirements of color gamut, power consumption, heat generation, size and cost. Each light source has a different spectral output that constrains the color gamut of the integrated display and each light source lends itself to different applications. Using sunlight or ambient room light works well for watches and cell phones with transflective displays. A Cold Cathode Fluorescent Lamp (CCFL) is typically used in laptop computers, LCD monitors and TVs, while the powerful light of an arc lamp is used in most LCD projectors. Light emitting diodes, or LEDs, are typically the source of light for LCDs in cell phones, PDAs, and other handheld applications. Some notebook and TV displays are also illuminated by LEDs [17][18]. These light sources are compact, efficient, and reliable. LEDs use low-voltage to produce colored or white light [19]-[21].
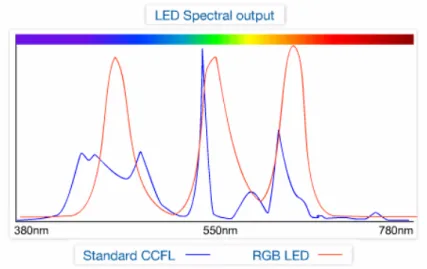
White LEDs in Fig. 1-5 first produce blue light, which is converted by a phosphor to white light, resulting in a broad spectrum accompanied by specific blue wavelength. Colored LEDs have a narrow wavelength spectrum such as red, green or blue light shown in Fig. 1-6 [1]. When mixed in a backlight, red, green and blue LEDs combine to produce a white light that covers nearly the entire NTSC color space. Color is normally provided in LCDs by color filters, one color per sub-pixel. Three sub-pixels, red, green, and blue, are required to cover the color range for each full pixel. The color filter limits the fraction of white light normally transmitted by the LCD to about 33%. One could eliminate the color filters and improve the display efficiency if each full pixel were sequentially illuminated by red, green and then blue light sources as shown in Fig. 1-7. If done quickly enough, the eye perceives that all three colors seem to be presented simultaneously. Colored LEDs are an ideal source
for this mode of illumination, known as Field Sequential Color [22]-[25]. This technique, while efficient, requires that the LCD respond at rates much faster than normal LCDs with color filters.
Fig. 1-5 The white LED and colored LEDs.
Fig. 1-6 The comparison of spectrums between CCFL and RGB LED.
1.3 LED backlight applications in LCDs
An active-matrix LCD system is commonly illuminated by a constant full-on backlight consisting of conventional CCFLs. The generated light propagates through two sets of polarizers, color filters, diffusers and redirection foils, and in each of these components substantial proportions of light are scattered and absorbed. Overall, the efficiency of the above optical stack amounts to approximately 5-10%.
Most LCDs rely on spatial color synthesis to produce vivid saturated color images by juxtaposing micro color-filter (typically RGB) sub-pixels. However, color filters absorb roughly 70% of light and are therefore highly inefficient. To improve significantly LCD power efficiency, it is therefore appealing to remove the color filters and rely on temporal color synthesis to create full-color images. Such field-sequential color (FSC) displays rapidly flash the primaries time-sequentially, as illustrated in Fig. 1-8, such that the colors are mixed by means of temporal integration in the eye and all three colors seem present simultaneously [26]-[30]. Colored LEDs are an ideal source for this mode of illumination. To prevent luminance flicker, a three-primary system requires a minimum refresh rate of 180 Hz.
Time
full color image
Red Green Blue
5.56 ms 1 Frame: 1/60 Sec ~16.7 ms Data Load LC Set LED Flash Data Load LED Flash Data Load LC Set LED Flash LC Set
Fig. 1-8 The display mechanism of an FSC-LCD.
which occurs when relative velocities between displayed objects and the eyes of the viewer exist. In that case, the constituent color components do not overlap perfectly at the retina and the individual color fields may become visible in the front-of-screen image (Fig. 1-9). This may occur during both smooth motion pursuit, and particularly saccadic eye movements which may result in high retinal color displacements [36]-[38]. CBU artifacts are highly annoying, causing some viewers severe viewing discomfort and in some cases even nausea [39].
(a) original image (b) CBU image
Fig. 1-9 (a) An original image and (b) a CBU image.
1.4 Motivation and objective of this thesis
In a world that is increasingly aware of its ecological footprint and the harm that is causing to our planet, there is a great incentive to reduce the power dissipation of state-of-the-art LCDs. LED backlight technologies are of advantageous of above requirements. However, these LED applications still exist several issues that need to be improved.
For the CBU issue, it has been widely studied in the context of digital light processing (DLP) projectors [40]-[42]. Since DLPs employ color wheels, most traditional solutions involve either straightforward field rate increases [43] or the
switched very rapidly, the response time of liquid crystal prevents the implementation of many of the above methods for large-screen FSC-LCDs. In spite of the emergence of new fast panel technologies, it is highly unlikely that affordable panels with frame rates higher than 240 Hz will be widely available in the foreseeable future. Cennini et al. [46] proposed a display solution based on spatio-temporal color synthesis that employs two color filters in combination with two color fields thus striking a compromise between conventional spatial color mixing and field-sequential technology. Although its benefits in terms of light efficiency and screen resolution are moderate compared to those achieved by full field-sequential displays, perception tests have confirmed that the visibility of CBU is drastically reduced.
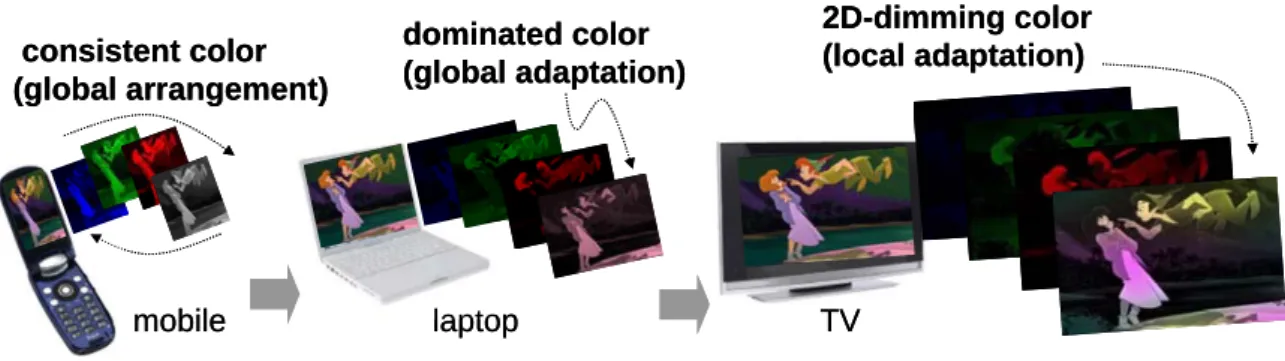
To promote field sequential color technology by developing new processing algorithms to mitigate the effects of color breakup is the objective of this thesis. The performance of newly developed CBU reduction techniques will be evaluated and benchmarked against existing methods. The architecture of this thesis can be divided into three parts for CBU suppression on small- to large-sized LCDs as shown in Fig. 1-10. The methods have progressed from consistent color order to adaptive color field and the 2D-dimming control.
mobile laptop TV
(Basic CBU suppression) (Further CBU suppression)
(Design Recommendation) consistent color (global arrangement) dominated color (global adaptation) 2D-dimming color (local adaptation) mobile laptop TV
(Basic CBU suppression) (Further CBU suppression)
(Design Recommendation) consistent color (global arrangement) dominated color (global adaptation) 2D-dimming color (local adaptation)
For mobile-sized one, we proposed an effective method, color field arrangement (CFA) [47]-[49], to reduce the CBU of FSC-LCDs. According to the relation between time and location of motional image, the adequate color field orders of three consecutive frames were found to compensate with each primary color. The CBU mechanism and perceived images on the retina were simulated when eyes followed the motional image. In addition, the flicker phenomenon, which occurs in both temporal variation of the luminance (brightness) and chromaticity (color) [50], has been considered and prevented. A 4-CFA method repeating on color fields was proposed to suppress the flicker phenomenon as well as the CBU.
To lighten the primary color fields by redistributing the LC gray levels to the fourth color field is also proposed [51]. The visibility of the CBU artifact is reduced while the intensity of color separation is decreased. We proposed the RGBW method, condensing the noticeable fields on a white field and reducing the intensities of R, G, and B fields [52][53]. However, the consistent color sequence is not suitable for all kinds of image contents. Therefore, we chose the cyan and yellow as the fourth color field in order to lighten the most sensitive green field. A full color image alternately consists of RGBC and RGBY color field sequences, adapted to image contents. It is obvious that the image intensities of primary colors are lightened. By redistributing gray levels, the noticeable fields are condensed to a primary and mix-colored one. The algorithm of arrangement the color field was studied for laptop-sized LCDs.
Further reductions in CBU visibility can be achieved by intelligently adapting the colors and intensities of the individual fields to the incoming video content [54]. This is generally achieved by focusing as much image energy in one temporal field. A common approach is to flash an adaptive image in one frame and use the remaining frames to display the color residuals. An effort was made in order to find the adaptive
color according to the image content in each frame. The algorithm of feedback determination of adaptive color and LC/BL signals was studied for the real time application, followed by the implementation and experimental results of CBU evaluation. With rearranging LC/BL signals dynamically to optimize color backlight, our results successfully demonstrate that the proposed method is a practical way to suppress the CBU in field sequence color LCD applications.
On large-sized LCDs, the local adaptation seems proper for the presentation of colorful images as local adaptation can concentrate more intensity to the adaptive field [55], a combination of locally controlled backlight and FSC concept. In each segment, the backlight can adjust for only a corresponding part of image. This backlight modulation is primarily determined by the number of addressable segments and the spatial extent of the optical profile of these segments [56]. We considered a boundary-free backlight pattern in this local adaptive backlight. In other words, the brightness variation at the boundary between segments should be indistinguishable. The threshold of boundary-free image was found according to human contrast sensitivity function. The criteria of insensible variations and the recommended profile and size of segment were determined [57].
1.5 Organization of this thesis
This thesis is organized as follows: the principle of color science and the introduction of driving hardware are presented in Chapter 2. The CBU mechanism, color standard such as CIE1931, CIE 1976, and the definition of color different are described in this chapter. Additionally, this chapter also presents the working principle of hardware components such as an OCB panel, LCD drivers, LED drivers, and an FPGA control board. In Chapter 3, using color field arrangement and RGBW method for suppressing CBU are demonstrated. The concepts of driving are distributed and
the experimental results are shown in this chapter. To suppress the issue of fixed driving principle, the exchange of color sequence RGBC/RGBY is proposed. The system architecture and the implementations of a timing controller are described in this chapter. In Chapter 4, the observations and the evaluation index of CBU are presented. With dynamically adjusting color sequence, the CBU is effectively reduced. The dynamic color backlight, an extended method, is proposed. This adaptive FSC-LCD is the first sequential driving display in the world adapted by image contents for further mitigating CBU. In Chapter 5, the large-sized FSC-LCD application and the local adaptation are discussed. The perceived threshold of boundary-free image and recommendation of the profile of local backlight are also presented. Finally, the summary of dissertation and future works are given in Chapter 6.
Chapter 2
CBU Mechanism and Driving Technologies
The sequential driving in the FSC-LCD is an effective mechanism without requirement of color filters in the conventional LCD. However, it faces a serious issue: color breakup (CBU). In order to suppress CBU, the basic concepts such as the eye movement response and the CBU phenomenon need to be understood. The color difference (ΔE) between the original and the CBU images is introduced and utilized to evaluate CBU phenomenon. In addition, the working principles of LC driving technologies such as the fast response LC, drivers, and circuits are introduced in this chapter.
2.1 Physiology of eye movements
Human eye is a complex visual system, and its structure is shown in Fig. 2-1. Light passes through the cornea and the pupil controlled by the iris to adjust the incident magnitude of light. Then the lens focuses the light on the retina, and there are two kinds of receptors to detect intensity and color of light. The rod cells are sensitive to light intensity; the cone cells are sensitive to color. The receptors detect light and convert it into electrochemical signals. Finally, the signals pass through the optic nerve to the brain, and humans can perceive images [58]. The CBU phenomenon in the FSC-LCD has strong dependence on perception.
Fig. 2-1 Structure of human eye.
The fovea lies near the projection point at the center of the retina. This region has the highest resolution and is 0.1% of retina area. In order to see objects clearly, humans need to move their eyes to focus on the fovea. In perception research, two major types of eye movements are mentioned: saccade and pursuit [59]. Saccade is a rapid, random movement while perceiving static objects. The movement moves around objects to focus on the fovea and gathers correct visual information [60]-[63]. The test image is shown in Fig. 2-2 (a), and the eye movement for the static image is lined with black in Fig. 2-2 (b). In order to recognize the woman, the observer’s eye moves around her face to collect information. Generally, saccade is spontaneous, and the speed happens quickly at about 200 degree/sec [64].
The other type of eye movements is pursuit. Pursuit is a smooth and predictable movement when perceiving dynamic objects. When perceiving a moving object, the human eye will follow at the same velocity of the object to focus on the fovea and catch clear images. Compared to saccade, pursuit velocity is much slower, and some research proposes the velocity is about 90 degree/sec [ 65 ]. Moreover, pursuit movement (pursuit latency) means the delay in eye pursuit, which is defined as the difference in beginning motion time between the target and the eye. According to literatures, the pursuit latency is about 100 ms to 150 ms [66].
2.2 Mechanism of CBU
By displaying R, G, and B fields sequentially faster than the time resolution of the eye, a full color image can be observed. If there is a relative movement between human eyes and moving object, the field images will be integrated separately on the retina, resulting in perception of the rainbow effect or CBU on the margin of the image. The CBU mechanism will be described in the following section.
2.2.1 Dynamic CBU
The dynamic CBU phenomenon always occurs at the edge of moving image on an FSC display. The mechanism of dynamic CBU is related to “Smooth Pursuit Eye Movement (SPEM)” of the visual system. Smooth pursuit is an eye movement that smoothly tracks a moving object in the visual system. The purpose of smooth pursuit is to perceive a moving object. Therefore, dynamic CBU can be perceived when three fields, R, G, and B, alternate slower than the SPEM.
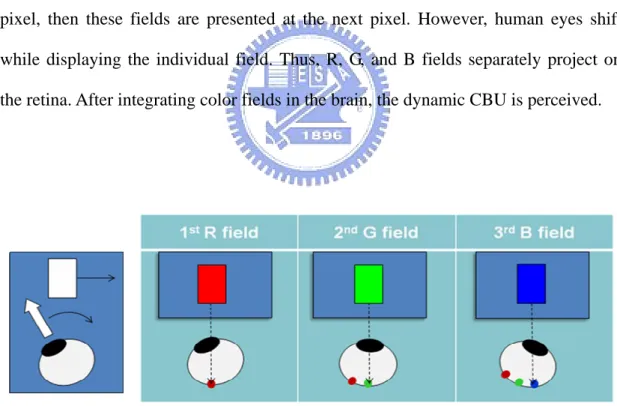
A white image moves from left to right on an FSC-LCD and human eyes pursue this moving image as shown in Fig. 2-3. While the FSC-LCD displays a moving image from an initial pixel to the next one, R, G, and B fields are shown at the initial pixel, then these fields are presented at the next pixel. However, human eyes shift while displaying the individual field. Thus, R, G, and B fields separately project on the retina. After integrating color fields in the brain, the dynamic CBU is perceived.
(a)
(b)
Fig. 2-4 (a) The relationship between time and display position of a simulation scheme and (b) CBU image in a visual system.
We can simulate the integration of the visual system by using Matlab software, as shown in Fig. 2-4(a), the relationship between time and display location (horizontal direction). A white bar moves from left to right and the dotted lines represent the observer’s viewpoint shift. When the observer watches a moving image, observer will shift the viewpoint to trace the moving image. Consequently, the observer will recognize an image as shown in Fig. 2-4(b) [67].
2.2.2 Static CBU
For a stationary image, CBU is observed during or after a saccadic eyes movement. Saccade is an eye movement that randomly and rapidly moves to scan and perceive a target image. If there are several white images as shown in Fig. 2-5 eye will perceive part of the image that attracts the interest [68]. Human’s visual system will be sensitive to white bars in this case, as shown in Fig. 2-5(a), where line-A represents the eye saccade movement. Saccade eye movement is much faster than SPEM, the stationary image seems to break up into several field colors, as shown in Fig. 2-5(b).
Fig. 2-5 (a) Image in an FSC-LCD and path of a saccade. (b) Observed CBU during or just after the saccade.
2.3 Color difference (delta E)
In the study of the perception of color, one of the first mathematically defined color spaces was the CIE 1931 XYZ color space (also known as CIE 1931 color space), created by the International Commission on Illumination (CIE) in 1931 [69]. The CIE XYZ color space was derived from a series of experiments done in the late 1920s by W. David Wright [70] and John Guild [71]. The human eye has receptors (called cone cells) for short (S), middle (M), and long (L) wavelengths. Thus in principle, three parameters describe a color sensation. The tri-stimulus values of a
color are the amounts of the three primary colors in a three-component additive color model needed to match that test color. The tri-stimulus values are most often given in the CIE 1931 color space, in which they are denoted X, Y, and Z [72]. CIE XYZ is based on direct measurements of human visual perception, and serves as the basis from which many other color spaces are defined.
In the CIEXYZ color space, the tri-stimulus values are not the S, M, and L responses of the human eye, but rather a set of tri-stimulus values called X, Y, and Z, which are roughly red, green and blue, respectively. Two light sources, made up of different mixtures of various wavelengths, may appear to be the same color; this effect is called metamerism. Two light sources have the same apparent color to an observer when they have the same tri-stimulus values, no matter what spectral distributions of light were used to produce them.
Due to the nature of the distribution of cones in the eye, the tri-stimulus values depend on the observer's field of view. To eliminate this variable, the CIE defined the standard (colorimetric) observer. Originally this was taken to be the chromatic response of the average human viewing through a 2° angle, due to the belief that the color-sensitive cones resided within a 2° arc of the fovea. Thus the CIE 1931 standard observer is also known as the CIE 1931 2° standard observer.
The color matching functions are the numerical description of the chromatic response of the observer. The CIE has defined a set of three color-matching functions, called ,x(λ), y(λ) and z(λ), which can be thought of as the spectral sensitivity curves of three linear light detectors that yield the CIEXYZ tri-stimulus values X, Y, and Z. The tabulated numerical values of these functions are known collectively as the CIE standard observer (Fig. 2-6) [73]. The tri-stimulus values for a color with a spectral power distribution are given in terms of the standard observer by:
3)
-2
(Eq.
)
(
)
(
2)
-2
(Eq.
)
(
)
(
1)
-2
(Eq.
)
(
)
(
0 0 0∫
∫
∫
∞ ∞ ∞=
=
=
λ
λ
λ
λ
λ
λ
λ
λ
λ
d
z
I
Z
d
y
I
Y
d
x
I
X
where λ is the wavelength of the equivalent monochromatic light (measured in nanometers).
Fig. 2-6The CIE standard observer color-matching functions
Since the human eye has three types of color sensors that respond to different ranges of wavelengths, a three-dimensional plot of all visible colors is shown in Fig. 2-7(a). However, the concept of color can be divided into two parts: brightness and chromaticity. For example, the color white is a bright color, while the color grey is considered to be a less bright version of that same white. In other words, the chromaticity of white and grey are the same while their brightness differs.
The CIE XYZ color space was deliberately designed so that the Y parameter was a measure of the brightness or luminance of a color. The chromaticity of a color was then specified by the two derived parameters x and y, two of the three normalized values which are functions of all three tri-stimulus values X, Y, and Z:
6)
-2
(Eq.
1
5)
-2
(Eq.
4)
-2
(Eq.
y
x
Z
Y
X
Z
z
Z
Y
X
Y
y
Z
Y
X
X
x
−
−
=
+
+
=
+
+
=
+
+
=
The derived color space specified by x, y, and Y is known as the CIE xyY color space and is widely used to specify colors in practice. The diagram represents all of the chromaticities visible to the average person. These are shown in color and this region is called the gamut of human vision. The gamut of all visible chromaticities on the CIE plot is tongue-shaped or horseshoe-shaped as shown in Fig. 2-7(b). The curved edge of the gamut is called the spectral locus and corresponds to monochromatic light, with wavelengths listed in nanometers. The straight edge on the lower part of the gamut is called the line of purples. These colors, although they are on the border of the gamut, have no counterpart in monochromatic light. Less saturated colors appear in the interior of Fig. 2-7(b) with white at the center.
Fig. 2-7 (a) A 3D figure of visible colors and (b)the CIE xyz.
In colorimetry, the CIELUV color space (Fig. 2-8) is a color space adopted by CIE in 1976, as a simple-to-compute transformation of the 1931 CIE XYZ color space, which is an attempt at perceptual uniformity [74][75]. It is extensively used for applications such as computer graphics which deal with colored lights. The non-linear relations are given below: [76]
7)
-2
(Eq.
29
6
,
3
29
29
6
,
16
116
3 3 3 3 1⎪
⎪
⎩
⎪
⎪
⎨
⎧
⎟
⎠
⎞
⎜
⎝
⎛
≤
⎟⎟
⎠
⎞
⎜⎜
⎝
⎛
⎟
⎠
⎞
⎜
⎝
⎛
⎟
⎠
⎞
⎜
⎝
⎛
>
−
⎟⎟
⎠
⎞
⎜⎜
⎝
⎛
=
n n n nY
Y
Y
Y
Y
Y
Y
Y
L
9)
-2
(Eq.
3
15
9
'
8)
-2
(Eq.
3
15
4
'
Z
Y
X
Y
v
Z
Y
X
X
u
+
+
=
+
+
=
where Yn is equal to 100 as the tri-stimulus of reference white [77].
By utilizing CIE1976, a more uniform chromaticity diagram can be established. Therefore, the color difference is defined by ΔEin the CIELUV chromaticity diagram. Consequently, the CBU phenomenon will be evaluated by the ΔE index between the CBU image and the original image to verify the proposed method [78]-[80]. We sum up the color difference between modified and original image pixel by pixel as an index, ΔEsum, for the evaluation of color separation.
. ) ( ) ( ) ( ' 2 0 ' 2 ' 0 ' 2 0
∑
− + − + − = Δ pixel total CBU CBU CBU sum L L u u v v E (Eq. 2-10)where Lu’v’CBU and Lu’v’0 are color values of CBU and original image in the Lu’v’
color space.
2.4 Hardware involved in sequential driving
The fast response LC and display electronic circuit are key components in FSC-LCDs. The LC response time is essential for one temporal field with the rate higher than 180 Hz [22]. Otherwise, the display electronics should be capable of synchronic driving with the LCD panel and LEDs. An FPGA as a timing controller is designed to process the incoming video content into each color field data, as show in Fig. 2-9. The features of the hardware are described in this section.
2.4.1 OCB mode
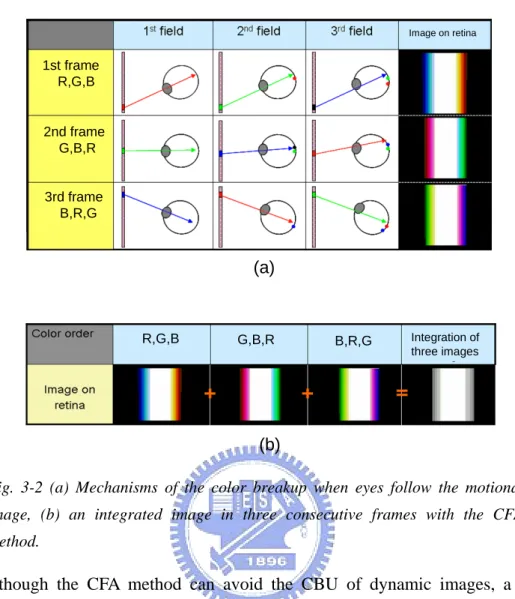
The optically compensated bend (OCB) mode LC, owning a feature of high speed response, is used for LCDs, especially highlighting motion images [81]. In OCB mode, the pre-tilt angles in the top and bottom substrates are in opposite directions. The opposed pre-tilt angles have two important properties. First, the optical self-phase compensation effect is induced on LC directors. As a result, the viewing angle is wide and symmetric. Second, the bend directors in an on-state voltage eliminate the back-flow effect, resulting in a faster response time. As the
applied voltage increases, the LC directors change from splay to bend deformation, as illustrated in Fig. 2-10. Below the critical voltage (Vc 1.8V), splay state is more
stable than bend state. On the contrary, above Vc, bend state is more stable as shown
in Fig. 2-11. The OCB mode LC will be maintained in bend state by applying a bias voltage [82][83]. LED Backlight LED Backlight FSC Timing Controller (FPGA) FSC Timing Controller (FPGA) Source Drivers Source Drivers Gat e Drivers Gate Drivers OCB mode LCD Panel OCB mode LCD Panel LED Drivers LED Drivers
Video in
Color Field Data
LED Backlight LED Backlight FSC Timing Controller (FPGA) FSC Timing Controller (FPGA) Source Drivers Source Drivers Gat e Drivers Gate Drivers OCB mode LCD Panel OCB mode LCD Panel LED Drivers LED Drivers
Video in
Color Field Data
Fig. 2-9The display electronic circuit
Fig. 2-11The transition curve from splay to bend state in OCB mode LC[82]
2.4.2 Source and gate drivers
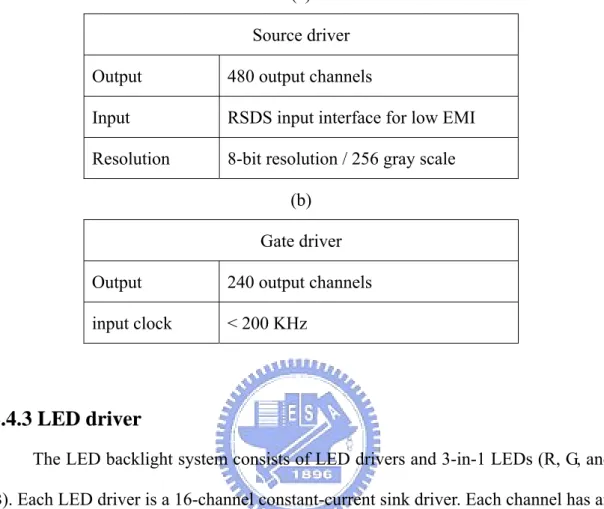
LCD source driver ICs with RSDS (Reduced Swing Differential Signaling) interface and single 12-bit differential bus for 24-bit data are utilized in the driving system. The source driver can receive 12-bit differential data from timing controller and can output 480-channel LCD driving voltage. The specifications are shown in Tab. 2-1 (a). There are some advantages of the RSDS interface, as shown below.
z Reduced bus width – enables smaller and thinner column driver boards z Low power dissipation – extends system run time
z Low Electromagnetic Interference (EMI) generation – eliminates EMI suppression components and shielding
z High noise rejection – maintains signal image z High throughput – enables high resolution displays
The timing diagram of RSDS data transition is shown in Fig. 2-12. We can see the differential signals are received at the rising edge of clock-P and clock-N. The 24 bit data can be received by using a 12 bit differential bus during one clock-P/N cycle.
Then the source driver can transform the received data, and control the LC by applying voltage to 480 output channels.
After the source driver output an electric signal in one line of the frame, the gate driver applies voltage to turn the thin film transistor (TFT) on. Thus, the source driver’s signal can store into each pixel in one line of the frame. In this way, the LC of each pixel can be controlled individually. In order to turn TFTs on, a start pulse signal is necessary to drive the gate driver output a high voltage. After a start pulse is triggered, output pins of gate driver will sequentially produce high-driving voltage pulses for the LCD panel. This gate driver can produce voltage through 240 channels to the LCD panel, The max clock frequency is 200 KHz, as shown in Tab. 2-1 (b).
Tab. 2-1 The specifications of (a) the gate driver and (b) the source driver for the TFT LCD panel
(a) Source driver Output 480 output channels
Input RSDS input interface for low EMI Resolution 8-bit resolution / 256 gray scale
(b) Gate driver Output 240 output channels input clock < 200 KHz
2.4.3 LED driver
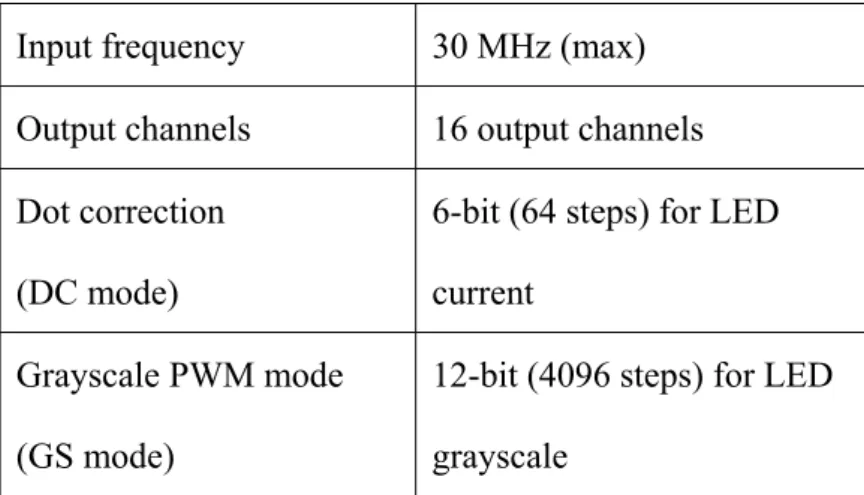
The LED backlight system consists of LED drivers and 3-in-1 LEDs (R, G, and B). Each LED driver is a 16-channel constant-current sink driver. Each channel has an individually adjustable 4096-step grayscale by Pulse-Width Modulation (PWM) operation and 64-step constant-current sink (dot correction). The dot correction adjusts the brightness variations between LED channels and other LED drivers.
This LED driver has the capability of adjusting the output current for each channel (OUT0 to OUT15) independently. The driven method, called Dot Correction mode (DC mode), is used to adjust LED brightness. Each of the 16 channels can be programmed with a 6-bit word. Thus the channel output can be adjusted in 64 steps from 0% to 100% of the maximum output current. Dot correction data are entered for all channels at the same time. The complete dot correction data format consists of 16 x 6-bit, which forms a 96-bit wide serial output data to control the current of 16
channels independently. This LED driver also can adjust the brightness of each channel by using a PWM control scheme. It uses the 12-bit width digital signal per channel to result in 4096 ( ) different brightness steps, which is called grayscale mode (GS mode). The total grayscale data of 16 channels is 16 x 12 bit width, which forms a 192-bit wide data packet. Consequently, each LED current is controlled by the LED driver with DC mode operation. Each LED lighting period is controlled by a LED driver with GS mode operation. The serial data input timing diagram with DC and GS mode is shown in Fig. 2-13 and Tab. 2-2.
Fig. 2-13 Serial data input timing diagram of the LED controller.
Tab. 2-2 Tthe specifications of LED driver
Input frequency 30 MHz (max) Output channels 16 output channels Dot correction
(DC mode)
6-bit (64 steps) for LED current
Grayscale PWM mode (GS mode)
12-bit (4096 steps) for LED grayscale
2.4.4 FPGA
A field-programmable gate array is a semiconductor device containing programmable logic components called "logic blocks". Logic blocks can be programmed to perform the function of basic logic gates such as AND, and XOR, or more complex combinational functions such as decoders or mathematical functions. In most FPGAs, the logic blocks also include memory elements, which may be simple flip-flops or Static Random Access Memory (SRAM). In this thesis, the memory elements used in FPGA are Static Random Access Memory (SRAM) and Synchronous Dynamic Random Access Memory (SDRAM), which were used as data buffers and the frame buffers, respectively.
In order to define the behavior of the FPGA, the user provides a hardware description language (HDL), the Common HDLs are VHDL and Verilog. Then, the user uses an electronic design automation tool; a technology-mapped net-list is generated. This net-list can be fitted to the actual FPGA architecture by using a process called place-and-route. The user will validate the map, place and route results via timing analysis, simulation, and other verification methodologies. Once the design and validation process is complete, the binary file is generated to configure the FPGA.
2.5 Summary
The physiology of eye movement and CBU phenomenon have briefly discussed in this chapter. In order to recognize the stationary image, the observer’s eye moves around the object to collect information during eye saccadic motion. For a moving object, the human eye will follow at the same velocity of the object to catch clear images, which is called the pursuit. The relative movement between human eyes and the object results in perception of CBU. The saccade and pursuit are related to static and dynamic CBU in perception while color field images are integrated separately on the retina.
To evaluate the CBU effect, we began as the color standard CIE 1976 to calculate the color difference for the evaluation index. The CIE 1976 is more uniform color space than CIE 1931 and suitable for the evaluation of color difference. We summed up the color difference between the original and CBU images at each pixel as an index, showing the factors of the color separation in CBU images. This index will be used to verify the proposed methods to suppress CBU.
In addition, the key components including OCB LC and display driving technologies such as drivers and control circuit are introduced in this chapter. The bend state of OCB enables the fast response light valve, which is essential for one temporal field with the rate higher than 180 Hz. The display electronics is capable of driving this panel with synchronic design of LCD and LED drivers. The control signals are implemented in an FPGA as a timing controller to process the incoming video content into individual field stream of data.
Chapter 3
Proposed CBU Suppression Methods
A novel CBU suppression method, color fields arrangement (CFA), was proposed to eliminate the artifacts for FSC-LCDs. The modified order of consecutive color fields results in superimposed color images on a retina without CBU. To suppress the static CBU effectively, the RGBW method was introduced to concentrate image intensity to a white field and discolor the primary color fields. The visibility of CBU artifacts can be reduced as the evaluation of dynamic and static models. For images with cyan, yellow, and magenta color, the exchange of color sequence of RGBC and RGBY was used to dynamically mitigate the CBU effects based on image contents.
3.1 Color fields arrangement
The FSC-LCD is desirable for its high optical efficiency, low power consumption, and low cost. However, the color breakup is significantly observed on FSC-LCDs. We have proposed a 4-color field arrangement (4-CFA) method to suppress the artifacts for FSC-LCDs.
3.1.1 Concept
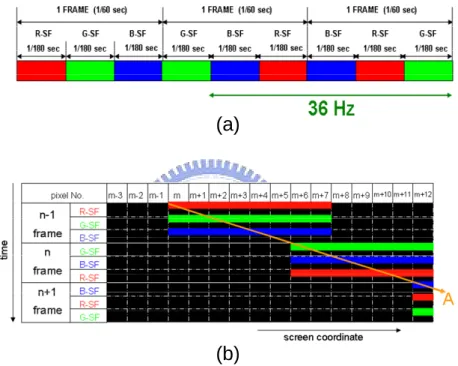
The two dimension time and location diagram was analyzed in order to determine an integration image of consecutive frames on FSC-LCDs. The fields of primary colors are respectively displayed in Fig. 3-1. When the observer views a moving image, the viewpoint follows the shift of the image, as indicates by the arrow A. Consequently, the observer recognizes a CBU image as rainbow color in Fig. 3-2
(a). The outline portion of image is determined by the order arrangement of color fields. Two other frame images with the color fields arrangement (CFA) were obtained. The integration of three consecutive frames is shown in Fig. 3-2 (b). The image on a retina will be compensated as a gray level image because of the viewpoint through the same ratio of each primary color. Consequently, the observer recognizes a non-CBU image with these color fields.
Fig. 3-1 (a) Color fields of RGB, GBR, and BRG in three consecutive frames (b) the relation between time and location of motional image.
(a)
Fig. 3-2 (a) Mechanisms of the color breakup when eyes follow the motional image, (b) an integrated image in three consecutive frames with the CFA method.
Although the CFA method can avoid the CBU of dynamic images, a flicker phenomenon will be an issue for the CFA method [84]. Because the human eye is more sensitive to green color, the lowest field frequency for green color to perceive invisible flicker is 50 Hz as shown in Tab. 3-1 [85]. However, the green field appeared at the first and third field in straight two frames. The green field frequency of 36 Hz in this worst case would be lower than the invisible condition. In order to suppress the flicker phenomenon, we proposed to insert a fourth color field to speed up the field frequency.
Tab. 3-1 The lowest field frequency that produces invisible flicker for each color
1st frame R,G,B 2nd frame G,B,R 3rd frame B,R,G Image on retina R,G,B G,B,R B,R,G Integration of three images 1st frame R,G,B 2nd frame G,B,R 3rd frame B,R,G Image on retina R,G,B G,B,R B,R,G Integration of three images (a) (b) 35 50 30 Frequency (Hz) B G R 35 50 30 Frequency (Hz) B G R
3.1.2 4-CFA method with repeating color orders
The color fields with orders of RGBR, GRBG, and BRGB in three consecutive frames were proposed in the 4-CFA method. The color of the fourth field repeated the one of the first field as shown in Fig. 3-3(a). The motional image and simulation result of a moving image of white bar are shown in Figs. 3-3(b) and (c). The margin of perceived image is blurred due to differences in brightness but without color separations. In addition, the flicker phenomenon should be suppressed because of the color field frequency of 80 Hz, higher than the invisible condition of 50 Hz.
Fig. 3-3 (a) Color fields of RGBR, GBRG, and BRGB in three consecutive frames, (b) the relation between time and location of motional white bar with width of 8 pixels and velocity of 6 pixels/frame, and (c) the simulation image on retina with the 4-CFA method when eyes follow the image.
(a) (b) (c) (a) (b) (c)
3.1.3 Implementation of FSC controller
A timing controller, which is designed to convert the image data to a desired format in response to the timing signal, is a key component in an FSC system. The block diagram of the controller is shown in Fig. 3-4. This controller consists of the data convert, frame buffer, memory switch, and LED lighting unit. A graphic card is used to convert the input video rate to 60 Hz in advance. These 24-bit RGB input signals are stored into monochromatic red, green, blue data separately in the data convert unit. The function of the memory switch unit is to access the consecutive frame data alternately between two banks of SDRAM. As one is on reading operation, the other one is on writing operation. To avoid conflicts of the consecutive frame data during the operation, a frame buffer is as a register to translate the data into LCD drivers. At the same time, an LED timing unit determines the enable signals for LED drivers to switch corresponding LEDs on.
Fig. 3-4 The block diagram of the FSC controller.
Data Convert Memory Switch
and Controller
Frame Buffer
LED lighting
CFA TIMING CONTROLLER
CLK Reset Vsync Hsync Data in Pixel CLK Sub-Vsync Sub-Hsync Data out LED enable
Data Convert Memory Switch
and Controller
Frame Buffer
LED lighting
CFA TIMING CONTROLLER
CLK Reset Vsync Hsync Data in Pixel CLK Sub-Vsync Sub-Hsync Data out LED enable R G B R G B R G B R G B BANK A BANK B
A 5.6-inch OCB-LCD with QVGA resolution was used as a prototype to evaluate the properties of CBU and flicker phenomenon. The response time of OCB mode LC cell (tLC) and the data addressing time (tTFT) were about 1.0 and 1.2 ms in this study.
For a field frequency of 240 Hz, the illumination time of LEDs (tLED) about 1.9 ms
was obtained as shown in Fig. 3-5. The backlight intensity of first and fourth fields was modified to meet the criterion of white balance. From the observation, there was no flicker as we predicted.
Fig. 3-5 The timing chart of the 4-CFA FSC-LCD.
3.1.4 Physical evaluation of CBU
The evaluation of CBU was carried out by a camera-tracking experiment. The perception of CBU was evaluated to verify the proposed CBU reduction method. The motion image was used as a test pattern to compare the image quality with the conventional and proposed methods. A stage with a high-speed camera, Phantom V5.1 by Vision Research, Inc.[86], was set up on a track and adjusted the velocity by a computer interface. In order to simulate the shift of the observer’s viewpoint, we synchronized the moving velocity of the bar on the image and the camera on the track, as shown in Fig. 3-6. The exposure time of camera was set to 1/20 second to integrate three consecutive frames while a frame frequency was 60 Hz. The experimental
RGB (n frame) RGB (n+1 frame) n-1 frame n frame Vsync Parallel Data in Data addressing timing Backlight timing n+1 frame t LC t TFT t LED t RGB (n frame) RGB (n+1 frame) n-1 frame n frame Vsync Parallel Data in Data addressing timing Backlight timing n+1 frame t LC t TFT t LED t

![Fig. 2-11 The transition curve from splay to bend state in OCB mode LC[82]](https://thumb-ap.123doks.com/thumbv2/9libinfo/8472513.183594/40.892.223.680.148.448/fig-transition-curve-splay-bend-state-ocb-mode.webp)