Photoabsorption cross sections of N H 3 , N H 2 D , N H D 2 , and N D 3 in the spectral
range 110 – 144 nm
Yu-Jong Wu, Hsiao-Chi Lu, Hong-Kai Chen, Bing-Ming Cheng, Yuan-Pern Lee, and L. C. Lee
Citation: The Journal of Chemical Physics 127, 154311 (2007); doi: 10.1063/1.2790440
View online: http://dx.doi.org/10.1063/1.2790440
View Table of Contents: http://scitation.aip.org/content/aip/journal/jcp/127/15?ver=pdfcov Published by the AIP Publishing
Articles you may be interested in
ND-stretching vibrational energy relaxation of N H 2 D in liquid-to-supercritical ammonia studied by femtosecond midinfrared spectroscopy
J. Chem. Phys. 128, 064502 (2008); 10.1063/1.2827464 Nonadiabatic effects in the H + D 2 reaction
J. Chem. Phys. 125, 133108 (2006); 10.1063/1.2202826
D matrix analysis of the Renner-Teller effect: An accurate three-state diabatization for N H 2 J. Chem. Phys. 125, 094102 (2006); 10.1063/1.2336219
Tunneling chemical reactions D + H 2 D H + H and D + D H D 2 + H in solid D 2 – H 2 and H D – H 2 mixtures: An electron-spin-resonance study
J. Chem. Phys. 124, 094504 (2006); 10.1063/1.2170083
Anomalous Peaks in the Mass Spectra of H 2 and D 2 Obtained with a Single-Focusing Mass Spectrometer J. Vac. Sci. Technol. 2, 213 (1965); 10.1116/1.1492429
Photoabsorption cross sections of NH
3, NH
2D, NHD
2, and ND
3in the spectral range 110– 144 nm
Yu-Jong Wu, Hsiao-Chi Lu, Hong-Kai Chen, and Bing-Ming Chenga兲,b兲
National Synchrotron Radiation Research Center, Hsinchu Science Park, Hsinchu 30076, Taiwan
Yuan-Pern Leea兲,c兲
Department of Applied Chemistry, and Institute of Molecular Science, National Chiao Tung University, Hsinchu 30010, Taiwan
L. C. Leea兲,d兲
Department of Electrical and Computer Engineering, San Diego State University, San Diego, California 92182, USA
共Received 5 July 2007; accepted 5 September 2007; published online 17 October 2007兲
Cross sections for photoabsorption of NH3, NH2D, NHD2, and ND3near 298 K were measured in
the spectral range of 110– 144 nm using radiation from a synchrotron. Absorption cross sections and oscillator strengths of NH3 agree satisfactorily with previous reports; those of ND3 are improved
over those in a previous report, whereas those of NH2D and NHD2are new. The oscillator strengths
of transitions to D, D
⬘
, D⬙
, F, and G states are nearly the same among all four isotopic variants, but those to D
and E states vary substantially. Observed absorption bands are arranged into vibrational progressions in accord with known Rydberg transitions. All progressions show a common trend of vibrational intervals increasing with vibrational quantum numbers. The Rydberg orbitals for states D共3de⬙
兲, D⬘
共4sa1⬘
兲, D⬙
共3da1⬘
兲, D
共4pe⬘
兲, and E共4de⬙
兲 are readily assigned with quantum defects determined in these experiments, but assignments for F共5de⬙
兲 and G共6de⬙
兲 are uncertain. Absorption cross sections of dissociative continua underneath discrete structures are larger for NH2D and NHD2than for NH3and ND3, indicating that the rate of dissociation of ammonia mightincrease when its symmetry is broken. © 2007 American Institute of Physics. 关DOI:10.1063/1.2790440兴
I. INTRODUCTION
Ammonia 共NH3兲 has been observed in planetary atmospheres,1,2comets,3and interstellar media.4For applica-tion in modeling the photoinduced fracapplica-tionaapplica-tion of isotopic variants in planetary atmospheres,5,6 the absorption cross sections associated with transitions A←X and B←X of NH3,
NH2D, NHD2, and ND3 were determined in the range of
140– 220 nm.7We have extended, and report here, measure-ments to the shorter wavelength range of 110– 144 nm.
The spectrum of NH3 in the region of 110– 144 nm
shows complicated structure. Duncan8 and Walsh and Warsop9 assigned vibrational progressions for various elec-tronic states, and Herzberg10labeled the associated electroni-cally excited states as D, E, F, and G. The electronic excita-tion of these Rydberg transiexcita-tions results in a structure altered from a pyramidal共C3v兲 ground state to planar 共D3h兲 Rydberg
states, causing the inversion 共v2兲 vibrational mode of the
upper state to become active. The molecular symmetries and Rydberg notations of these electronic states are subject to some debate.9,11–14Leach et al.15summarized the current as-signments; these authors recorded fluorescence excitation spectra between 82.6 and 206.6 nm共6–15 eV兲 by probing at
seven specific emission wavelengths of NH and NH2 and
assigned the observed features to various Rydberg states of NH3. States D, E, and F are assigned to have symmetry1E
⬘
with excitation to 3de
⬙
, 4de⬙
, and 5de⬙
orbitals, respectively. Edvardsson et al.14and Watanabe and Sood13assigned the G state to be1A2⬙
共7sa1⬘
兲, but Leach et al.15suggested that it be reassigned to 1E⬘
共6de⬙
兲. More to these intense transitions, weak transitions to electronic states D⬘
1A2⬙
共4sa1⬘
兲 and D⬙
1A2⬙
共3da1⬘
兲 were reported.8,11,16,17 Several additional states, such as D
, E⬘
, E⬙
, E
, F⬘
, F⬙
, and G⬘
, have been observed with multiphoton excitations.11,18,19Several authors have reported absorption cross sections of NH3 in the range of 110– 144 nm.13,14,20–23 In contrast, only Edvardsson et al. reported absorption cross sections of ND3in the region of 108– 125 nm,14and those of NH2D and
NHD2have not been reported previously.
Compared with NH3, spectra of the three deuterium vari-ants, especially NH2D and NHD2, are little studied.
Duncan24photographed absorption spectra of NH2D, NHD2,
and ND3in the range of 124.8– 143.3 nm and arranged the
observed bands into vibrational progressions of the D1E
⬘
共3de⬙
兲 state. Li and Vidal12 analyzed the rotational structure of the transition to the D state of ND3. Edvardsson et al.14 assigned observed bands in the region of 108– 125 nm to vibrational progressions in states E, F, and G of ND3. Grownia et al.11reported bands of states D
andE; the latter was also investigated by Langford et al.19Locht a兲Authors to whom correspondence should be addressed.
b兲Electronic mail: bmcheng@nsrrc.org.tw c兲Electronic mail: yplee@mail.nctu.edu.tw d兲Electronic mail: llee@mail.sdsu.edu
0021-9606/2007/127共15兲/154311/9/$23.00 127, 154311-1 © 2007 American Institute of Physics This article is copyrighted as indicated in the article. Reuse of AIP content is subject to the terms at: http://scitation.aip.org/termsconditions. Downloaded to IP:
et al.25 measured autoionization spectra of all four isotopic variants at wavelengths smaller than the ionization thresh-olds near 121.7 nm and found different spectral shapes and intensities; vibrational progressions were observed in transi-tions to states F and G of NH2D, NHD2, and ND3.
We have measured absorption cross sections of NH3,
NH2D, NHD2, and ND3in the region of 110– 144 nm with
improved resolution and present here the spectral analysis and discussion of isotopic effects.
II. EXPERIMENTS
The experimental setup is described elsewhere.5–7 Briefly, vacuum ultraviolet共VUV兲 light produced in the Na-tional Synchrotron Radiation Research Center 共NSRRC兲 in Taiwan was dispersed with a high-flux 6 m monochromator. With a cylindrical grating having 600 grooves mm−1and slits
of width of 0.050 mm, a resolution of 0.02 nm was achieved. The wavelength was calibrated with absorption lines of Xe,26 CO,27,28 O2,29 and NO.30–33 The accuracy of wavelength is
limited by the scan step, 0.02 nm共⬃10 cm−1兲 in this work. The absorption cross section was measured with a double-beam apparatus with a LiF window placed at an angle of 45° to one beam to reflect partially the incident VUV beam for intensity monitoring. The transmitted beam passed through the sample cell. The VUV light of both beams was converted to visible light upon irradiation of a glass window coated with sodium salicylate and detected with a photomultiplier tube in a photon-counting mode. The absorption cross section was evaluated according to the equation ln共Io/ I兲=nl +␣, in which Ioand I are the intensi-ties of reflected and transmitted light, respectively, n is the gas density, and l = 89 mm is the length of sample cell. The constant␣was determined when the sample cell was evacu-ated under 10−7Torr. At each wavelength, the value was
obtained from a linear least-square fit of 4–11 measurements with sample gases at varied pressures. To avoid saturation effects, the maximum absorbance was limited to 1.5. To maintain a constant pressure of gas during data acquisition, a reservoir of volume of about 0.6 l was connected to the gas cell. The gas densities were derived from pressures measured with three capacitance manometers 共MKS-Baratron兲 cover-ing from 0.003 to 10 Torr. The temperature was monitored with a calibrated thermocouple.
NH3共99.99%, Matheson兲 and ND3共isotopic purity 99%,
Cambridge Isotope Laboratories兲 were purified with a freeze-pump-thaw procedure at 77 K, followed by vacuum distilla-tion from 206 to 77 K. NH2D and NHD2 were obtained
from mixtures of NH3and ND3. We measured the
midinfra-red absorption spectra of NH3, ND3, and two mixtures
of initial concentration ratios 关NH3兴/关ND3兴=2/1 and 5/7
and found that the partition of isotopic variants conforms to a statistical distribution within experimental uncertainty. For the two mixtures, 关NH3兴:关NH2D兴:关NHD2兴:关ND3兴
= 0.2963: 0.4444: 0.2222: 0.0370 and 0.0723:0.3038:0.4253:0.1985, respectively. This resulting statistical distribution is consistent with observations of Reid et al.34and Akagi et al.,35who determined the compositions of equilibrated isotopic variants with NH3and ND3at varied
initial concentrations. We found that the mixture near 295 K requires a few days to attain the final statistical distribution.
III. RESULTS AND DISCUSSION A. Absorption cross sections
The absorption cross sections of NH3, NH2D, NHD2,
and ND3 in the spectral range of 68 000– 92 000 cm−1
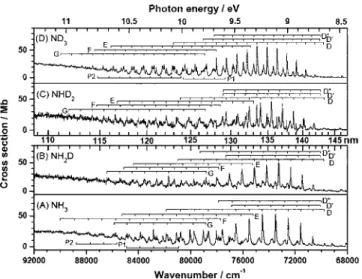
共108.7–147 nm or 8.43–11.41 eV兲 are shown in Fig. 1. Considering all possible systematic errors, the experimental uncertainties are estimated to be within 10% of given values for NH3and ND3and 16% for NH2D and NHD2. The vibra-tional progressions 共to be discussed later兲 are also assigned in these figures. Spectra of NH3 and ND3 exhibit similar patterns of features, whereas those of NH2D and NHD2have disparate patterns, attributed to the breaking of molecular symmetry. For vibrational progressions, wavenumbers and cross sections of NH3, NH2D, NHD2, and ND3are listed in
Table I. Tabulated numerical values of cross sections at in-tervals of 0.02 nm are accessible at Ref. 49.
As shown in Fig.1共A兲, NH3has a sharp structure in the
range of 120– 144 nm. The absorption cross section of peak depends on spectral resolution. Our values of these peaks are generally as much as twice those of Suto and Lee,21 presum-ably because our resolution is about ten times theirs. Al-though the resolution of 0.02 nm used by Watanabe and Sood13is similar to ours, their absorption cross sections dif-fer from ours in both absolute values and relative strength. For instance, our cross sections for lines D共6兲, D共5兲, and D共4兲 at 75 517, 74 505, and 73 497 cm−1 共132.42, 134.22, and 136.06 nm兲 are 46.1, 52.9, and 53.6 Mb 共Table I, 1 Mb= 10−18cm2兲, in contrast with their values of 49.5, 68.3, and 45.6 Mb, respectively.13According to our notation D共v
⬘
兲 specifies the upper electronic state D and its vibrational quantum numberv⬘
. This difference might be caused by light sources; our experiment used synchrotron from which radia-tion has a continuous and stable distriburadia-tion, but the hydro-gen discharge lamp used by Watanabe and Sood9emits dis-FIG. 1. Absorption cross sections共in units of Mb, 1 Mb=10−18cm2兲 of NH3 共A兲, NH2D 共B兲, NHD2 共C兲, and ND3 共D兲 in the spectral range of 68 000– 92 000 cm−1共108.7–147 nm and 8.43–11.4 eV兲. For convenience, the abscissas are plotted in three coordinates: cm−1, nm, and eV.154311-2 Wu et al. J. Chem. Phys. 127, 154311共2007兲
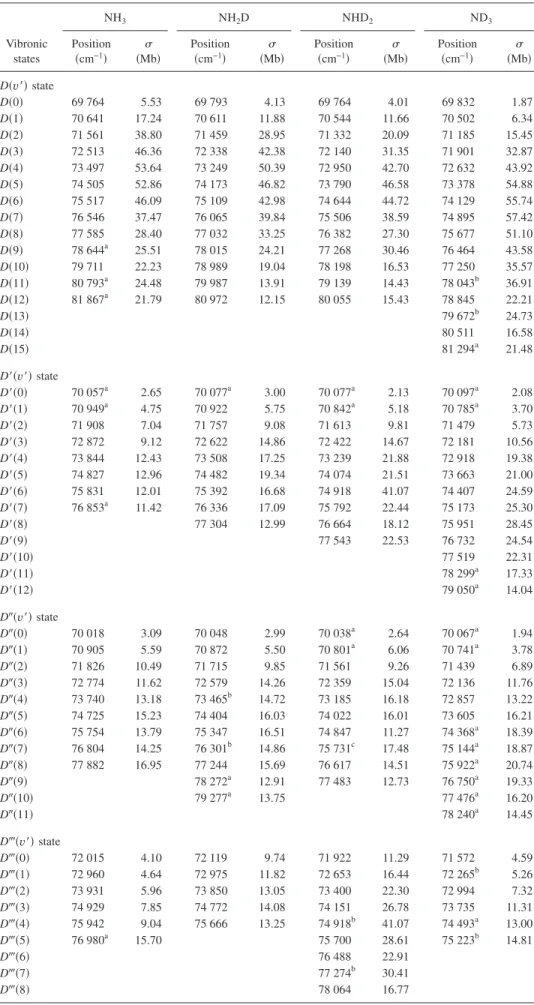
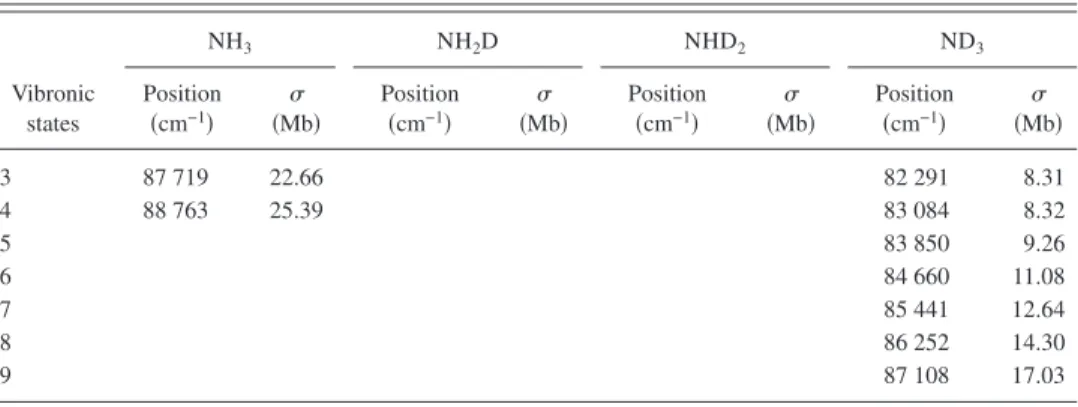
TABLE I. Wavenumbers and cross sections共in Mb; 1 Mb=10−18cm2兲 at vibrational progressions of NH 3, NH2D, NHD2, and ND3. Vibronic states NH3 NH2D NHD2 ND3 Position 共cm−1兲 共Mb兲 Position 共cm−1兲 共Mb兲 Position 共cm−1兲 共Mb兲 Position 共cm−1兲 共Mb兲 D共v⬘兲 state D共0兲 69 764 5.53 69 793 4.13 69 764 4.01 69 832 1.87 D共1兲 70 641 17.24 70 611 11.88 70 544 11.66 70 502 6.34 D共2兲 71 561 38.80 71 459 28.95 71 332 20.09 71 185 15.45 D共3兲 72 513 46.36 72 338 42.38 72 140 31.35 71 901 32.87 D共4兲 73 497 53.64 73 249 50.39 72 950 42.70 72 632 43.92 D共5兲 74 505 52.86 74 173 46.82 73 790 46.58 73 378 54.88 D共6兲 75 517 46.09 75 109 42.98 74 644 44.72 74 129 55.74 D共7兲 76 546 37.47 76 065 39.84 75 506 38.59 74 895 57.42 D共8兲 77 585 28.40 77 032 33.25 76 382 27.30 75 677 51.10 D共9兲 78 644a 25.51 78 015 24.21 77 268 30.46 76 464 43.58 D共10兲 79 711 22.23 78 989 19.04 78 198 16.53 77 250 35.57 D共11兲 80 793a 24.48 79 987 13.91 79 139 14.43 78 043b 36.91 D共12兲 81 867a 21.79 80 972 12.15 80 055 15.43 78 845 22.21 D共13兲 79 672b 24.73 D共14兲 80 511 16.58 D共15兲 81 294a 21.48 D⬘共v⬘兲 state D⬘共0兲 70 057a 2.65 70 077a 3.00 70 077a 2.13 70 097a 2.08 D⬘共1兲 70 949a 4.75 70 922 5.75 70 842a 5.18 70 785a 3.70 D⬘共2兲 71 908 7.04 71 757 9.08 71 613 9.81 71 479 5.73 D⬘共3兲 72 872 9.12 72 622 14.86 72 422 14.67 72 181 10.56 D⬘共4兲 73 844 12.43 73 508 17.25 73 239 21.88 72 918 19.38 D⬘共5兲 74 827 12.96 74 482 19.34 74 074 21.51 73 663 21.00 D⬘共6兲 75 831 12.01 75 392 16.68 74 918 41.07 74 407 24.59 D⬘共7兲 76 853a 11.42 76 336 17.09 75 792 22.44 75 173 25.30 D⬘共8兲 77 304 12.99 76 664 18.12 75 951 28.45 D⬘共9兲 77 543 22.53 76 732 24.54 D⬘共10兲 77 519 22.31 D⬘共11兲 78 299a 17.33 D⬘共12兲 79 050a 14.04 D⬙共v⬘兲 state D⬙共0兲 70 018 3.09 70 048 2.99 70 038a 2.64 70 067a 1.94 D⬙共1兲 70 905 5.59 70 872 5.50 70 801a 6.06 70 741a 3.78 D⬙共2兲 71 826 10.49 71 715 9.85 71 561 9.26 71 439 6.89 D⬙共3兲 72 774 11.62 72 579 14.26 72 359 15.04 72 136 11.76 D⬙共4兲 73 740 13.18 73 465b 14.72 73 185 16.18 72 857 13.22 D⬙共5兲 74 725 15.23 74 404 16.03 74 022 16.01 73 605 16.21 D⬙共6兲 75 754 13.79 75 347 16.51 74 847 11.27 74 368a 18.39 D⬙共7兲 76 804 14.25 76 301b 14.86 75 731c 17.48 75 144a 18.87 D⬙共8兲 77 882 16.95 77 244 15.69 76 617 14.51 75 922a 20.74 D⬙共9兲 78 272a 12.91 77 483 12.73 76 750a 19.33 D⬙共10兲 79 277a 13.75 77 476a 16.20 D⬙共11兲 78 240a 14.45 D共v⬘兲 state D共0兲 72 015 4.10 72 119 9.74 71 922 11.29 71 572 4.59 D共1兲 72 960 4.64 72 975 11.82 72 653 16.44 72 265b 5.26 D共2兲 73 931 5.96 73 850 13.05 73 400 22.30 72 994 7.32 D共3兲 74 929 7.85 74 772 14.08 74 151 26.78 73 735 11.31 D共4兲 75 942 9.04 75 666 13.25 74 918b 41.07 74 493a 13.00 D共5兲 76 980a 15.70 75 700 28.61 75 223b 14.81 D共6兲 76 488 22.91 D共7兲 77 274b 30.41 D共8兲 78 064 16.77
TABLE I. 共Continued.兲 Vibronic states NH3 NH2D NHD2 ND3 Position 共cm−1兲 共Mb兲 Position 共cm−1兲 共Mb兲 Position 共cm−1兲 共Mb兲 Position 共cm−1兲 共Mb兲 E共v⬘兲 state E共0兲 75 211 7.03 75 247a 14.62 75 188 11.69 75 366a 4.68 E共1兲 76 145 7.84 76 060a 39.76 75 976 14.63 76 081 7.33 E共2兲 77 089 17.43 76 911a 18.28 76 758 16.99 76 781 19.10 E共3兲 78 052 26.49 77 776 16.27 77 591 18.45 77 567 14.77 E共4兲 79 049 27.86 78 669 14.25 78 400 17.85 78 358b 12.44 E共5兲 80 063 27.59 79 628 12.65 79 216 14.81 79 114b 13.20 E共6兲 81 082 23.38 80 599 13.29 80 064 15.45 79 911 16.88 E共7兲 82 118 17.92 81 540 13.61 80 943b 18.34 80 632 18.32 E共8兲 83 169 16.24 82 483 13.18 81 860 24.02 81 393 22.27 E共9兲 84 260 16.38 83 425c 13.29 82 808 15.67 82 156 22.40 E共10兲 85 284a 17.79 84 374a 20.73 83 710 15.79 82 946 21.38 E共11兲 84 674 15.54 83 724 21.17 E共12兲 85 631 17.13 84 517 21.17 E共13兲 85 307 18.45 E共14兲 86 118 17.60 F共v⬘兲 state F共0兲 77 712a 10.38 77 852 15.00 77 724 12.00 78 045c 36.91 F共1兲 78 656a 11.56 78 579 18.88 78 463b 19.57 78 777 25.80 F共2兲 79 592 13.71 79 433 16.40 79 305b 21.11 79 529 20.75 F共3兲 80 567 13.32 80 347 19.15 80 141 21.82 80 283 16.91 F共4兲 81 583 14.86 81 248 21.57 80 985 21.06 81 050 13.80 F共5兲 82 604 18.44 82 169 18.36 81 833b 20.93 81 846 17.82 F共6兲 83 640 16.46 83 139 19.45 82 658 21.02 82 631 19.26 F共7兲 84 688 18.02 84 133 20.75 83 528b 15.27 83 403 15.19 F共8兲 85 763 22.71 85 121 20.00 84 463 17.26 84 175 14.18 F共9兲 86 806 22.48 85 397 19.84 84 970 13.87 F共10兲 87 843 23.89 86 296 22.86 85 748 16.57 F共11兲 88 905a 25.56 87 199b 22.89 86 563 16.67 F共12兲 87 260 18.90 G共v⬘兲 state G共0兲 78 852a 14.10 78 827 24.32 78 864 10.09 78 927a 18.98 G共1兲 79 806a 11.22 79 758 21.72 79 694 10.80 79 669a 24.73 G共2兲 80 777a 24.48 80 704 20.27 80 528a 9.73 80 451 24.74 G共3兲 81 793 20.16 81 668 27.78 81 433a 14.66 81 235 21.24 G共4兲 82 837 28.13 82 590b 23.13 82 280a 14.67 82 023 23.97 G共5兲 83 850 23.80 83 528b 22.26 83 125a 15.43 82 784 23.00 G共6兲 84 875 21.66 84 474b 21.07 83 991 20.67 83 556 22.21 G共7兲 85 896 20.99 85 441 23.66 84 875 22.65 84 331 20.61 G共8兲 86 401 24.03 85 763 25.93 85 121 21.60 G共9兲 86 655 23.83 85 911 23.71 G共10兲 87 535 25.57 86 715 22.92 G共11兲 88 449 25.90 87 520 22.69 G共12兲 89 318a 27.74 88 324 22.56 G共13兲 89 142a 23.01 G共14兲 89 944a 25.16 P1共unassigned兲 1 80 919 15.87 77 363 12.53 2 81 860 21.79 78 174 16.56 3 82 837c 28.13 78 989 16.60 4 83 892 17.52 79 758 14.60 5 84 927 18.89 80 567 14.76 P2共unassigned兲 1 85 646 19.57 80 736 9.54 2 86 670 22.22 81 486 8.81
154311-4 Wu et al. J. Chem. Phys. 127, 154311共2007兲
crete lines. As at wavelengths smaller than 115 nm the absorption is dominated by a continuum, the cross section in this region is less affected by spectral resolution. In this range, our data are generally greater than those of Watanabe and Sood by 11%–15%共Ref.13兲 and those of Suto and Lee by 30%–40%.21 Our data agree satisfactorily with those of Xia et al.23measured in the range of 110– 122 nm at a reso-lution 0.8 nm, those of Samson et al.22at a few wavelengths near 110 nm, and those of Edvardsson et al.14in the range of 108– 125 nm. Xia et al.23 suggested that the previously re-ported smaller values21might be caused by scattered light in the monochromator and fluorescence from excited photo-fragments of NH3.
Using synchrotron radiation, only Edvardsson et al.14 measured absorption cross sections of ND3 in the range of
108– 125 nm. Their cross sections for peaks are generally smaller than our values because of their limited resolution of 0.08 nm. Their values near 110 nm in the absorption con-tinuum agree satisfactorily with ours. In the range of 110– 124 nm at a spectral resolution of 0.2 nm, Locht et al.25 observed similar vibrational structures in the autoionization spectrum of ND3but reported no cross section.
The absorption cross sections of NH2D and NHD2 are
unreported. The absorption spectra of NH2D and NHD2
shown in Figs.1共B兲and1共C兲differ significantly from those of NH3and ND3. Locht et al.25observed similar vibrational
structures in autoionization spectra of NH2D and NHD2with
lower spectral resolution. The maximal absorption strengths of the transition D←X are similar for all four isotopic vari-ants, except for that of ND3being⬃20% greater than that of NHD2. In contrast, the maximal absorption strengths of tran-sitions to the D
⬘
state of NH2D, NHD2, and ND3are 1.5, 3.1, and 2.1 times greater than that of NH3.B. Oscillator strengths
An integration of absorption cross section over a spectral range yields an oscillator strength 共f-value兲, calculated with36
f = 1.13⫻ 10−6
冕
d, 共1兲in whichis the absorption cross section in megabarns and
is the wavenumber in cm−1. As such a calculated oscillator strength is typically unaffected by spectral resolution, it serves as comparison among various experiments.
The f-values of NH3, NH2D, NHD2, and ND3,
calcu-lated for the ranges of 110–118, 118–128, and 128– 144 nm from our absorption spectra shown in Fig. 1, are listed in TableIIwith our previous results7for ranges of 144–165 and 165– 218 nm. Additional results37,38 with other integration ranges 共112–122 and 122–144 nm兲 are included in TableII TABLE I. 共Continued.兲 Vibronic states NH3 NH2D NHD2 ND3 Position 共cm−1兲 共Mb兲 Position 共cm−1兲 共Mb兲 Position 共cm−1兲 共Mb兲 Position 共cm−1兲 共Mb兲 3 87 719 22.66 82 291 8.31 4 88 763 25.39 83 084 8.32 5 83 850 9.26 6 84 660 11.08 7 85 441 12.64 8 86 252 14.30 9 87 108 17.03
aWavenumbers of weak peaks are less accurate. bOverlapped features could be deconvoluted. cOverlapped peaks could not be deconvoluted.
TABLE II. Oscillator strengths of NH3, NH2D, NHD2, and ND3. Wavelengths range 共nm兲 NH3 NH2D NHD2 ND3 Reference 110–118 0.1398 0.1441 0.1313 0.1261 This work 118–128 0.0850 0.0993 0.0857 0.0864 This work 128–144 0.0904 0.1081 0.0910 0.0964 This work 144–165 0.0123 0.0095 0.0112 0.0090 7 165–218 0.0800 0.0883 0.0811 0.0818 7 112–122 0.1352 0.1432 0.1277 0.1228 This work 0.1359 37 0.1460 38 122–144 0.1359 0.1632 0.1388 0.1445 This work 0.1201 37 0.1267 38
for comparison. For NH3, our value of f = 0.1352 for the
range of 112– 122 nm agrees with values of 0.1359 by Bur-ton et al.37and 0.1460 by Zeiss et al.;38our value of 0.1359 for the range of 122– 144 nm is 13% and 7% greater than values of 0.1201 and 0.1267 reported by these authors, re-spectively.
Chantranupong et al.39calculated the oscillator strengths of NH3for Rydberg transitions to states D, D
⬘
, D⬙
, and D
,which occur mainly in the wavelength range of 128– 144 nm. The intense Rydberg transition D共3de
⬙
兲←X of NH3 has a theoretical oscillator strength of 0.0621,39 whichagrees with the value of 0.0582 determined from the sum of oscillator strengths for levels v
⬘
= 0 – 10; because the levels with v⬘
⬎10 are mixed with other states, their f-values are unavailable, but their contribution to the total oscillator strengths are expected to be less than 10% of the total. The calculated value39 f = 0.0235 for the combined Rydberg tran-sitions to states D⬘
共4sa1⬘
兲 and D⬙
共3da1⬘
兲 of NH3agrees withour measured value of 0.0250 for the combined states D
⬘
and D⬙
measured for levels v⬘
= 0 – 8. Because the high-energy members of states D⬘
and D⬙
are overlapped with transitions to other states, the experimental uncertainty of an f-value is expected to be⬃15% of the given value. The total oscillator strength calculated for all transitions listed above by Chantranupong et al.39is 0.0974, in agreement with our ex-perimental value of 0.0904 for NH3 in the range of 128– 144 nm listed in TableII.For NH3, NH2D, NHD2, and ND3measured in the spec-tral range of 110– 144 nm, f = 0.3152, 0.3515, 0.3080, and 0.3089, respectively. Although features of ND3have greater absorption maxima than those of NH3, their f-values are
similar because their widths are smaller. NH2D has an
f-value 12%–14% greater than for other variants, but the discrepancy might still lie within experimental uncertainties. As shown in Fig.1, the onset of absorption continua beneath the discrete structures of NH2D and NHD2 occur at
wave-lengths much greater than those of NH3and ND3, indicating
that the dissociation of the former species might occur at smaller excitation energy.
C. Comparison of wavenumbers at absorption maxima
The wavenumbers at the absorption peaks of NH3, NH2D, NHD2, and ND3 and the corresponding cross sec-tions are contained in Table I. The wavenumbers are ar-ranged into vibrational progressions in accord with transi-tions from the ground electronic state to Rydberg states D, D
⬘
, D⬙
, D
, E, F, and G.11,15 Transitions D⬘
←X and D⬙
←X are barely separated with our resolution, as shown in Fig. 1 and Table I. A detailed comparison among our and previous results appears in EPAPS.40 Except the transition D
←X, our results agree satisfactorily with those reported previously.8,9,11,13,14,16,25 The latter weak transition D
←X was discussed only briefly by Glownia et al.11 but we are unable to derive definitive assignments of bands associated with this transition because of its small intensity. Of twoprogressions that remain unassigned, designated P1 and P2 in Table Iand Fig. 1, one was observed also by Edvardsson et al.14
The spectra of NH2D and NHD2in this region are little
investigated. Our data for the transition D←X agree satisfac-torily with those of Duncan,24 but significant differences ex-ist between our data for transitions F←X and G←X and those from autoionization spectra of Locht et al.25for some bands. According to Leach et al.,15 the vibrational quantum numbers given by Locht et al.25should be decreased by one unit. Level E共0兲 of NH2D coincides with D共6兲.
Except smaller vibrational spacings due to mass effects and more intense maxima correlating with smaller line-widths, the spectrum of ND3 generally resembles that of
NH3. The measured wavelengths of transition D←X of ND3
agree reasonably well with those of Duncan24 and Glownia et al.,11 but those of transition D
←X differ by more than 200 cm−1 from those of Glownia et al.11 Wavelengths of maxima for transitions D⬘
and D⬙
←X are unreported. For transition E←X, our data agree satisfactorily with those of Edvardsson et al.14and Locht et al.25for the high vibrational levels, but are smaller by⬃200 cm−1than those of Glowniaet al.11and Langford et al.19for the low levels. Considering the resolution and observed spacings of these bands, our measurements for the low levels are expected to be more reliable. For transitions F←X and G←X, our data agree better with those of Edvardsson et al.14 than with those of Locht et al.25 Similar to NH3, two progressions共designated
P1 and P2兲 of ND3 are unassigned; one of them was also
observed by Edvardsson et al.14
As shown in Fig.1, the intensity distributions of transi-tions of all four isotopic species have broad bell shapes, in-dicating that geometries are substantially altered between the lower and upper states. The adiabatic excitation energies of NH3 for transitions to states are 8.650共D兲, 8.686共D
⬘
兲,8.681共D
⬙
兲, 8.929共D
兲, 9.325共E兲, 9.635共F兲, and 9.776共G兲 eV, respectively, and the vertical excitation ener-gies of these states, with estimated vibrational quantum num-bers v⬘
= 5 at maxima, are 9.24共D兲, 9.28共D⬘
兲, 9.26共D⬙
兲, 9.54共D
兲, 9.93共E兲, 10.2共F兲, and 10.4共G兲 eV; the associated states are listed in parentheses. The uncertainties of these estimates on vertical excitation might be as large as ±0.12 eV because of uncertainties in identifying the band with the maximal intensity.D. Vibrational intervals
As the first few bands of each progression are either weak or overlapped with another transition, the values of ⌬G1/2共energy between v=0 and v=1兲 are difficult to
deter-mine accurately. The vibrational wavenumberseand anhar-monicities exe of each progression, listed in Table III, are obtained by fitting observed wavenumbers to a standard equation taking into account anharmonicityexe; the previ-ously reported data of states A and B are also fitted.7A com-mon property of all progressions is that their vibrational in-tervals increase with vibrational quantum numbers. These observed vibrational intervals are well correlated among all isotopic variants and all states, indicating our assignments of
154311-6 Wu et al. J. Chem. Phys. 127, 154311共2007兲
vibrational bands into various progressions to be consistent. The vibrational intervals correlate well with those of the first ionic state, also listed in TableIIIfor comparison.14,25
For transitions to the nde
⬙
series, the vibrational wave-numbers increase with quantum number n; that is, e in-creases from 890 cm−1 for the D state to 913, 917, and 949 cm−1for states E, F, and G, respectively.E. Intensity variations of states Dand E
The intensity of the transition to state D
varies greatly among all four species, in contrast to the transition to states D, D⬘
, and D⬙
that varies little. The intensity of that transi-tion to state D
is small for NH3共unidentified in this work兲and ND3 but increases for NH2D and becomes comparable
with that in NHD2, as shown in Fig.1. The transition to state
D
of NHD2 has an origin at 139.04 nm共71 922 cm−1兲 andmaximum intensity at 133.48 nm 共75 700 cm−1兲, hence an
adiabatic energy of 8.93 eV and a vertical energy of 9.39 eV 共corresponding to v
⬘
= 5兲. This state likely corresponds to the 4p/ 4pRydberg states, of which the adiabatic energies of NH3 are calculated to be 8.64/ 8.89 eV and the verticalen-ergies to be 9.41/ 9.63 eV, respectively.39 If this assignment is accepted, state D
has a character similar to states B / C that are assigned39 to the 3p/ 3p Rydberg states, respec-tively. The oscillator strength for transition B共3p兲←X of NH3 is calculated39 to be only 0.0010, which is consistentwith the n→3p/ 3p Rydberg transitions being optically forbidden and which is a tenth of the experimental value of 0.0123.7The np/ np Rydberg states might acquire inten-sity through a mechanism involving vibronic spin-orbit cou-pling between singlet and triplet states.41,42With this borrow-ing effect included, the oscillator strength for the transition B←X of NH3 was recalculated to be 0.0088, which is near
the experimental value.7 The transition to state D
might acquire intensity through a mechanism similar to that of the B state.The intensity of the transition to state E also varies among all four isotopic species, but in a way the reverse of that to state D
. The transitions to state E of NH3, NHD2,and ND3are more intense than that of NH2D. This transition
might lose strength through vibronic spin-orbit coupling be-tween singlet and triplet states, in contrast with the intensity-borrowing mechanism.41,42The coupling strength clearly de-pends on molecular symmetry and vibronic states.
F. Quantum defects and assignments of Rydberg states
The effective quantum number of n*is a primary param-eter applicable for the assignment of a progression in a Rydberg transition. This value of n* is calculated with36
n*= n −␦=关R/共IE − E兲兴0.5, 共2兲 in which n is the principal quantum number,␦ is the quan-tum defect, IE is the ionization energy and E is the energy of an observed state, both expressed in wavenumber units, cm−1, and R is the Rydberg constant, which is determined
by43
R = R⬀/关1 + me/共p + n兲Mp兴, 共3兲
in which R⬀= 109 737.315 686 393 cm−1 is adopted from
Udem et al.,44Mp/ me= 1836.152 666 5 is the ratio of masses of proton and electron given by Farnham et al.,45and p and n are the numbers of protons and neutrons in the nuclei, respectively. The Rydberg constants for NH3, NH2D, ND2H, and ND3 are calculated to be 109 733.80, 109 734.00,
109 734.17, and 109 734.33 cm−1, respectively.
We adopted IE= 10.1861 eV for NH3, that is, the mean
of 10.1856 eV 共82 152.36 cm−1兲 given by Edvardsson
et al.,14 10.1865 eV共82 159 cm−1兲 from Reiser et al.,46
and 10.186 46 eV 共82 158.751 cm−1兲 from Seiler et al.47
We adopted IE values of 10.191 and 10.191 eV to calculate the n* values for NH
2D and NHD2, respectively, from Locht
et al.25 and IE= 10.193 eV for ND3 from the mean of 10.201 eV by Langford et al.19 and 10.185 eV by Locht et al.25 The effective quantum numbers for all states of four isotopic variants are calculated from the band origins listed in Table I; the results appear in TableIV.
The Rydberg states of ammonia relevant to the current work are D1E
⬘
共3de⬙
兲, D⬘
1A2⬙
共4sa1⬘
兲, D⬙
1A2⬙
共3da1⬘
兲, D
1E⬙
共4pe⬘
兲, E1E⬘
共4de⬙
兲, F1E⬘
共5de⬙
兲, and G1E⬘
共6de⬙
兲.15 As shown in TableIV, the Rydberg assignments of states D, D⬘
, D
, and E are consistent with their quantum defects; that is, the ␦ values fit well with typical ranges ⬃1 for an s orbital, ⬃0 for a d orbital, and 0.2–0.8 for a p orbital. The assignments of states D, D⬘
, and D⬙
are also supported by the agreement of their oscillator strengths between experi-mental measurements and theoretical calculations, as dis-cussed in the previous section. The value of␦= 0.988 for the D⬘
state of NH3is greater than the mean value48of 0.897 forthe n = 12– 18 Rydberg series of this state. The␦values listed TABLE III. Vibrational wavenumberseand anharmonicitiesexe共both in
cm−1兲 for various states of NH
3, NH2D, NHD2, and ND3. State NH3 NH2D NHD2 ND3 A共3sa1⬘兲a 884± 5 810± 10 731± 8 655± 6 6.9± 0.5 6.7± 1.1 5.9± 0.9 4.6± 0.5 B , C共3pe⬘兲a 906± 9 850± 11 796± 14 709± 6 15.7± 1.3 13.0± 1.5 8.1± 1.7 7.2± 0.7 D共3de⬙兲 890± 11 827± 13 762± 8 675± 6 18.8± 1.6 17.3± 1.9 14.8± 1.0 11.7± 0.7 D⬘共4sa1⬘兲 927± 8 811± 9 753± 7 675± 8 12.7± 1.6 18.6± 1.8 15.3± 1.2 11.6± 1.2 D⬙共3da1⬘兲 863± 5 801± 15 746± 14 660± 6 26.7± 1.0 22.5± 2.6 16.4± 2.4 16.0± 1.2 D共4pe⬘兲 924± 4 847± 29 729± 5 679± 10 22.9± 1.1 16.1± 10.4 8.6± 1.1 20.7± 3.6 E共4de⬙兲 913± 6 827± 30 756± 14 697± 10 18.3± 1.0 18.1± 5.6 17.5± 1.9 2.8± 1.0 F共5de⬙兲 917± 10 822± 18 777± 22 741± 9 19.8± 1.9 22.5± 3.4 14.1± 3.2 5.5± 1.1 G共6de⬙兲 949± 8 913± 1 818± 7 741± 5 11.1± 1.4 17.0± 0.6 8.0± 0.9 5.6± 0.6 Ionb 948 899 825 738
aCalculated from data of Cheng et al.共Ref.7兲. bFor NH
3 calculated from data of Edvardsson et al.共Ref. 14兲 for other species from Locht et al.共Ref.25兲.
in TableIVfor states D
⬙
, F, and G are somewhat inconsis-tent with the expected values from their assignments; they are discussed further below.The n*values for the origins of state D
⬙
for four isotopic variants are all slightly greater than 3, resulting in small negative values of ␦. For all four species, as the origins of the transition to state D⬙
are weak and poorly separated from that to state D⬘
, their positions are difficult to determine ac-curately. In contrast, the transition to level v⬘
= 4 is strong and its position is well defined for every species; hence its quantum defect might be more reliable for a Rydberg assign-ment. For this reason, the␦values for levelv⬘
= 4 of state D⬙
are calculated, with results listed in TableIV; the ionization energies for level v⬘
= 4 are 10.6559, 10.637, 10.600, and 10.551 eV 共Ref. 25兲 for NH3, NH2D, NHD2, and ND3,re-spectively. Because the␦values for level D
⬙
共4兲 are positive, the assignment of D⬙
to 3da1⬘
is acceptable.As shown in TableIV, as the␦ values of the F state are small for NH3, NH2D, and NHD2, this state is appropriate
for the 5de
⬙
Rydberg state, but for ND3 the effectivequan-tum number of this state is 5.127, so that this state seems to involve a 6p orbital instead of 5d. An explanation might invoke mixing of the F共0兲 level with D共11兲, as shown in Fig. 1共D兲for ND3. To test this possibility, we calculated the n*
values for the well defined F共4兲 levels of all four species; the results are listed in TableIV. The n*values of the F共4兲 level
vary greatly among these four isotopic variants such that a correlation of the F state with the 5d orbital is unclear. The value n*= 5.057 for the F共4兲 level of ND
3still shows that the
F state involves a 6p orbital; this state might hence not be a pure d orbital. Such a deviation cannot be rationalized ac-cording to an uncertainty of the ionization energy of ND3. If
IE= 82 280 cm−1 共10.201 eV兲 as estimated by Langford
et al.,19 the n* value for the F共0兲 level of ND
3 becomes
5.087, still in disagreement with the 5d assignment. Hence, the assignment of the F state to 5de
⬙
is uncertain; it might be mixed with p orbital.The effective quantum numbers for the band origins of the transition to state G for NH3in four isotopic variants lie
in a range of 5.707–5.778, which indicates that state G in-volves a 6p orbital instead of the assigned 6d orbital. State G was originally assigned as 1A2
⬙
共7sa1⬘
兲 by Edvardsson et al.,14 but Leach et al.15 assigned this series as1E⬘
共6de⬙
兲based on its large absorption strength and small width; they attributed the large quantum defect of the G共0兲 level of NH3 to a perturbation. To test the validity of that argument, we calculated the ␦ values of the G共4兲 levels of four species, which are separate from other bands, with the same ioniza-tion energies used in the calculaioniza-tion of D
⬙
共4兲. As listed in Table IV, the quantum defect of the G共4兲 level is 0.046 for NH3, but those are 0.147, 0.184, and 0.240 for NH2D,NHD2, and ND3, respectively. The G state hence might be mixed with a p orbital. Unexpectedly large intensities were observed at the G共4兲 level of NH3, G共3兲 of NH2D, G共8兲 of NHD2, and G共9兲 of ND3, which might result from such mixing.
IV. CONCLUSION
The absorption cross sections of NH3, NH2D, NHD2, and ND3 near 298 K are measured in the spectral range of 110– 144 nm. The precisions of these cross sections and the oscillator strengths of ND3 are improved over those previ-ously reported, whereas measurements on NH2D and NHD2 are new. For most transitions the oscillator strengths do not vary with isotopic substitution, except for transitions D
←X of NH2D and NHD2that are much greater than those ofNH3 and ND3.
The wavelengths of NH3 features agree satisfactorily
with those previously reported. The spectrum of ND3
re-sembles that of NH3, except for smaller vibrational intervals,
greater cross sections at maxima, and smaller widths. Our wavelengths for transitions D
←X and E←X of ND3 alsoare at variance with those of previous reports. The wave-lengths of absorption maxima are arranged into vibrational progressions in accordance with Rydberg transitions. All pro-gressions show a common characteristic that vibrational in-tervals increase with vibrational energies; vibrational anhar-monicities for many states are determined for the first time. The effective quantum numbers and quantum defects are consistent with Rydberg assignments to states D1E
⬘
共3de⬙
兲, D⬘
1A2⬙
共4sa1⬘
兲, D⬙
1A2⬙
共3da1⬙
兲, D
1E⬙
共4pe⬘
兲, and E1E⬘
共4de⬙
兲, but not for F1E⬘
共5de⬙
兲 and G1E⬘
共6de⬙
兲; these states might not be a pure d orbital, but mixed with p orbital. TABLE IV. Energies, effective quantum numbers n*, and quantum defects␦for various Rydberg states of NH3, NH2D, NHD2, and NH3. State NH3 NH2D NHD2 ND3 E共cm−1兲 n* ␦ E共cm−1兲 n* ␦ E共cm−1兲 n* ␦ E共cm−1兲 n* ␦ D共3de⬙兲 69 764 2.976 0.024 69 793 2.975 0.025 69 764 2.971 0.029 69 832 2.977 0.023 D⬘共4sa1⬘兲 70 057 3.012 0.988 70 077 3.009 0.991 70 077 3.009 0.991 70 097 3.009 0.991 D⬙共3da1⬘兲 70 018 3.007 −0.007 70 048 3.005 −0.005 70 038 3.004 −0.004 70 067 3.006 −0.006 D共4pe⬘兲 72 015 3.289 0.711 72 119 3.300 0.700 71 922 3.268 0.732 71 572 3.321 0.679 E共4de⬙兲 75 211 3.975 0.025 75 109 3.935 0.065 75 188 3.957 0.043 75 256 3.971 0.029 F共5de⬙兲 77 712 4.969 0.031 77 785 4.988 0.012 77 724 4.954 0.046 78 040 5.127 −0.127 G共6de⬙兲 78 852 5.762 0.238 78 827 5.707 0.293 78 864 5.739 0.261 78 927 5.778 0.222 D⬙共4兲 73 725 2.997 0.003 73 465 2.983 0.017 73 185 2.986 0.014 72 865 2.966 0.034 F共4兲 81 593 5.021 −0.021 81 248 4.914 0.086 80 985 4.933 0.067 81 050 5.057 −0.057 G共4兲 82 850 5.954 0.046 82 590 5.853 0.147 82 250 5.816 0.184 82 034 5.760 0.240
154311-8 Wu et al. J. Chem. Phys. 127, 154311共2007兲
ACKNOWLEDGMENTS
National Science Council of Taiwan provided support through Grant Nos. 2113-M-213-006 and NSC95-2119-M-009-032. L. C. Lee thanks the National Synchrotron Radiation Research Center in Taiwan for a visiting professorship.
1Y. L. Yung and W. B. DeMore, Photochemistry of Planetary Atmospheres 共Oxford University Press, New York, 1999兲.
2K. Lodders, Science 303, 323共2004兲.
3M. K. Bird, W. K. Huchtmeier, P. Gensheimer, T. L. Wilson, P. Jan-ardhan, and C. Lemme, Astron. Astrophys. 325, L5共1997兲.
4E. Dartois, L. d’Hendecourt, W. Thi, K. M. Pontoppidan, and E. F. van Dishoeck, Astron. Astrophys. 394, 1057共2002兲.
5B.-M. Cheng, E.-P. Chew, C.-P. Liu, M. Bahou, Y.-P. Lee, Y. L. Yung, and M. F. Gerstell, Geophys. Res. Lett. 26, 3657共1999兲.
6Y. T. Lee, Y. L. Yung, B.-M. Cheng, C.-Y. Chung, M. Bahou, and Y.-P. Lee, Astrophys. J. Lett. 551, L93共2001兲.
7B.-M. Cheng, H.-C. Lu, H.-K. Chen, M. Bahou, Y.-P. Lee, A. M. Mebel, L. C. Lee, M. C. Liang, and Y. L. Yang, Astrophys. J. 647, 1535共2006兲. 8A. B. F. Duncan, Phys. Rev. 47, 822共1935兲.
9A. D. Walsh and P. A. Warsop, Trans. Faraday Soc. 57, 345共1961兲. 10G. Herzberg, Molecular Spectra and Molecular Structure III. Electronic
Spectra and Electronic Structure of Polyatomic Molecules共Van Nostrand
Reinhold, New York, 1966兲.
11J. H. Glownia, S. J. Riley, S. D. Colson, and G. C. Nieman, J. Chem. Phys. 73, 4296共1980兲.
12X. Li and C. R. Vidal, J. Chem. Phys. 102, 9167共1995兲. 13K. Watanabe and S. P. Sood, Sci. Light共Tokyo兲 14, 36 共1965兲. 14D. Edvardsson, P. Baltzer, L. Karlsson, B. Wannberg, D. M. P. Holland,
D. A. Shaw, and E. E. Rennie, J. Phys. B 32, 2583共1999兲.
15S. Leach, H. W. Jochims, and H. Baumgärtel, Phys. Chem. Chem. Phys.
7, 900共2005兲.
16M. Furlan, M. J. Hubin-Franskin, J. Delwiche, D. Roy, and J. E. Collin, J. Chem. Phys. 82, 1797共1985兲.
17J. A. Syage, R. B. Cohen, and J. Steadman, J. Chem. Phys. 97, 6072 共1992兲.
18M. N. R. Ashfold, C. L. Bennett, and R. J. Stickland, Comments At. Mol. Phys. 19, 181共1987兲.
19S. R. Langford, A. J. Orr-Ewing, R. A. Morgan, C. M. Western, M. N. R. Ashfold, A. Rijkenberg, C. R. Scheper, W. J. Buma, and C. A. de Lange, J. Chem. Phys. 108, 6667共1998兲.
20K. Watanabe, J. Chem. Phys. 22, 1564共1954兲. 21M. Suto and L. C. Lee, J. Chem. Phys. 78, 4515共1983兲.
22J. A. R. Samson, G. N. Haddad, and L. D. Kilcoyne, J. Chem. Phys. 87, 6416共1987兲.
23T. J. Xia, T. S. Chen, C. Y. R. Wu, and D. L. Judge, J. Quant. Spectrosc. Radiat. Transf. 45, 77共1991兲.
24A. B. F. Duncan, Phys. Rev. 50, 700共1936兲.
25R. Locht, B. Leyh, W. Denzer, G. Hagenow, and H. Baumgärtel, Chem.
Phys. 155, 407共1991兲.
26K. Yoshino and D. E. Freeman, J. Opt. Soc. Am. B 2, 1268共1985兲. 27S. G. Tilford, J. T. Vanderslice, and P. G. Wilkinson, Can. J. Phys. 43,
450共1965兲.
28J. D. Simmons, A. M. Bass, and S. G. Tilford, Astrophys. J. 155, 345 共1969兲.
29K. Yoshino, J. R. Esmond, A. S.-C. Cheung, D. E. Freeman, and W. H. Parkinson, CFA molecular data, Harvard-Smithsonian Center for Astrophysics, web: cfa-www.harvard.edu
30A. Lagerqvist and E. Miescher, Helv. Phys. Acta 31, 221共1958兲. 31R. Engleman, Jr., P. E. Rouse, H. M. Peek, and V. D. Baiamonte, “Beta
and Gamma Band Systems of Nitric Oxide,” Los Alamos Scientific Laboratory of the University of California Report No. LA-4364, 1970 共unpublished兲.
32J. E. Murray, K. Yoshino, J. R. Esmond, W. H. Parkinson, Y. Sun, A. Dalgarno, A. P. Thorne, and G. Cox, J. Chem. Phys. 101, 62共1994兲. 33K. Yoshino, J. R. Esmond, W. H. Parkinson, A. P. Thorne, J. E. Murray,
R. C. M. Learner, G. Cox, A. S.-C. Cheung, K. W.-S. Leung, K. Ito, T. Matsui, and T. Imajo, J. Chem. Phys. 109, 1751共1998兲.
34J. P. Reid, R. A. Loomis, and S. R. Leone, J. Chem. Phys. 112, 3181 共2000兲.
35H. Akagi, K. Yokoyama, and A. Yokoyama, J. Chem. Phys. 120, 4696 共2004兲.
36G. Herzberg, Molecular Spectra and Molecular Structure I Spectra of
Diatomic Molecules共Van Nostrand, New York, 1950兲.
37G. R. Burton, W. F. Chan, G. Cooper, C. E. Brion, A. Kumar, and W. J. Meath, Can. J. Chem. 71, 341共1993兲.
38G. D. Zeiss, W. J. Meath, J. C. F. MacDonald, and D. J. Dawson, Can. J. Phys. 55, 2080共1977兲.
39L. Chantranupong, G. Hirsch, R. J. Bunker, M. Kimura, and M. A. Dillon, Chem. Phys. 154, 13共1991兲.
40See EPAPS Document No. E-JCPSA6-127-015739 for a detailed com-parison of the wavenumbers at the vibrational progressions of NH3, NH2D, NHD2and ND3among our and previous results. This document can be reached through a direct link in the online article’s HTML refer-ence section or via the EPAPS homepage共http://www.aip.org/pubservs/ epaps.html兲.
41S. H. Lin, Proc. R. Soc. London, Ser. A 352, 57共1976兲.
42D. W. Liao, A. M. Mebel, M. Hayashi, Y. J. Shiu, Y. T. Chen, and S. H. Lin, J. Chem. Phys. 111, 205共1999兲.
43M. J. Seaton, Rep. Prog. Phys. 46, 167共1983兲.
44Th. Udem, A. Huber, I. Reichert, M. Prevedelli, M. Weltz, and T. W. Hansch, Phys. Rev. Lett. 79, 2646共1997兲.
45D. L. Farnharm, R. S. Van Dyck, Jr., and P. B. Schwinberg, Phys. Rev. Lett. 75, 3598共1995兲.
46G. Reiser, W. Habenicht, and K. Müller-Dethlefs, J. Chem. Phys. 98, 8462共1993兲.
47R. Seiler, U. Hollenstein, T. P. Softley, and F. Merkt, J. Chem. Phys. 118, 10024共2003兲.
48D. T. Cramb and S. C. Wallace, J. Chem. Phys. 101, 6523共1994兲. 49See http://ams-bmc.nsrrc.org.tw