市場發展對外商績效之影響-台灣在大陸子公司之實證研究
55
0
0
全文
(2) 市場發展對外商績效之影響台灣在大陸子公司之實證研究 指導教授: 李 揚 博士 國立高雄大學經營管理研究所 學生: 李皖華 國立高雄大學經營管理研究所. 摘要 自 1978 年中國大陸實施經濟改革以來,平均每年經濟都達到近 10%的成長率。而 海外直接投資在中國大陸的經濟成長也扮演相當重要的角色。過去的研究主要探討海外 直接投資如何影響中國大陸的發展;然而,只有少數的文章研究在中國大陸的海外子公 司績效,這篇文章則是以市場發展的角度探討海外子公司的經營績效。資料是以 689 家在中國大陸的台灣子公司為研究樣本,資料來源為中國市場化指數、中華徵信所、台 灣經濟新報以及中國城市統計年鑑,研究期間從 2003 年至 2007 年。實證結果指出,當 地政府的角色、非國有經濟的發展、法律制度保護程度皆會顯著影響台灣在大陸子公司 的經營績效。此外,當地基礎建設及公司特性也會影響海外子公司的銷售成長率。. 關鍵字: 海外直接投資、海外子公司、市場發展. I.
(3) Analysis of Market Development on Performance of Foreign-Owned Enterprises:. Evidence from Mainland. China’s Subsidiaries of Taiwan Advisor: Dr. Yang Li Institute of Business and Management National University of Kaohsiung Student: Wan-Hua Lee Institute of Business and Management National University of Kaohsiung. Abstract Since the launch of the economic reforms in 1978, mainland China has experienced, on average, an approximately 10% rate of economic growth.. It is well known that foreign. direct investment (FDI) plays an important role in the economic development of mainland China.. However, previous studies mainly focus on how FDI affects her development.. This study explores the influences of market development on the performance of the overseas subsidiaries in mainland China. The data set consists of 689 Taiwan‟s overseas subsidiaries in China based on the data obtained from the NERI INDEX of marketization, CCIS, TEJ, and China City statistical Yearbook over the period 2003-2007. The empirical results indicate that the role of local government, non-state-owned economic development, and the degree of legal protection can significantly influence the performance of Taiwan‟s subsidiaries in mainland China. In addition, infrastructures and firms‟ characteristics are also related to growth rate of sales.. Keyword:. FDI, foreign subsidiaries, market development II.
(4) Contents Chapter 1 Introduction ......................................................................................................... 1 1.1 Research motivation and purpose ............................................................................. 1 1.2. Research Procedure................................................................................................... 4. Chapter 2 Literature review ................................................................................................ 5 2.1 FDI Theory................................................................................................................... 5 2.2 The FDI in emerging economies.................................................................................. 7 2.3 The performance of MNEs‟ subsidiaries ..................................................................... 9 Chapter 3 Research Framework ....................................................................................... 12 3.1 Market development .................................................................................................. 12 3.2 Control variable ......................................................................................................... 18 Chapter 4 Empirical Analysis ............................................................................................ 22 4.1 Data Source and Variable Description ....................................................................... 22 4.2 Empirical Model ........................................................................................................ 25 4.3 Empirical Results ....................................................................................................... 25 4.4 Discussion .................................................................................................................. 33 Chapter 5 Conclusions and Suggestions ........................................................................... 40 References ............................................................................................................................... 42 Appendix A ............................................................................................................................. 48 Appendix B ............................................................................................................................. 49. III.
(5) List of Tables Table 1. Descriptive Statistics of Variables for All Firms ................................................. 24. Table 2. Empirical Results of the Fixed-Effects Model for All Firms ............................. 26. Table 3. Descriptive Statistics of Variables for Three Industries ..................................... 29. Table 4. Empirical Results of the Fixed-Effects Model for Three Industries ................. 32. Table 5. NERI INDEX of marketization for China and Three Economic Regions ....... 39. List of Figures Figure 1 Research Procedure ............................................................................................... 4 Figure 2 The Conceptual Framework and Hypotheses ................................................... 21. IV.
(6) Chapter 1. Introduction. 1.1 Research motivation and purpose Since the launch of the economic reforms in 1978, mainland China has experienced, on average, an approximately 10% rate of economic growth.. It is well known that foreign. direct investment (FDI) plays an important role in the economic development of mainland China (Sun et al., 2002; Hsiao and Shen, 2003).. According to the 2010 World Investment. Report, China is the second largest host of FDI in the world behind the US since 2009, and the largest developing country recipient of FDI since 1991.. China advocated the. “progressive reform” policy, and shifted from a planned economy to a market economy. The progressive reform is from south to north and from east to west.. The economic. development of China is concentrated in the Pearl River Delta region during the 1980s, the Yangtze River Delta in the 1990s, and the BoHai Rim since the end of twenty century. The Great Northwest is the focal point recently.. Hence, economic and market developments are. greatly diversified within mainland China.. Fan and Wang (2000, 2004, 2006, 2009). constructed market development indices for 31 provinces of mainland China.. These. phenomena offer a good opportunity to analyze how the degrees of market development influence the performance of MNEs‟ subsidiaries in mainland China. In 1978, China advocated the “open reform” policy and attempted to shift China‟s economy from a planned economy to a market economy.. In 1979, at the second conference. of the Fifth People‟s Assembly, the “Law of the People‟s Republic of China on Joint Ventures Using Chinese and Foreign Investment” was ratified, which allowed foreign investors and Chinese companies to form joint ventures.. Four special economic zones (Shenzhen, Zhuhai,. Shantou, and Xiamen), fourteen open coastal cities (Dalian, Qinhuangdao, Tianjin, Yantai, Qingdao, Lianyungang, Nantong, Shanghai, Ningbo, Wenzhou, Fuzhou, Guangzhou, 1.
(7) Zhanjiang and Beihai.), two development zones (Hainan Special Economic Zone and Pudong New Area in Shanghai), and three economic regions (Pearl River Delta, Yangtze River Delta, and BoHai Rim) were set up subsequently.. The State Council further issued the “Provisions. for the Encouragement of Foreign Investment” in 1986 to encourage foreign investment, permitting more freedom of independent operations for foreign-invested enterprises and granting more preferential tax policy for foreign investment. Local governments were also given more authority in attracting foreign investment.. The 2010 World Investment Report. (United Nations Conference on Trade and Development, UNCTAD) showed that China was only behind the U. S. as the world‟s second largest host of FDI, and since 1991 China was the largest developing country recipient of FDI. Chen et al. (1995), Wei and Liu (2001), Sun et al. (2002), and Hsiao and Shen (2003) disclosed that FDI is positively related to the economic growth of China. However, FDI is unevenly distributed across provinces within China, especially concentrated in the coastal regions (Chen and Fleisher, 1996; Broadman and Sun, 1997).. Zhang and Felmingham. (2002) indicated that the movement of FDI in China is from the eastern region to the central region and then, from the central region to the western region. Actually, ever since China‟s reform, a series of improved measures and preferential policies have shown significant regional tendencies.. Therefore, the degree of economic and market developments are. greatly diversified within mainland China.. Fan and Wang (2000, 2004, 2006, 2009). constructed a market development index for 31 provinces of mainland China from five dimensions: the relationship between government and market, the development of non-state-owned economy, the degree of goods market development, the degree of factor market development, and the degree of legal protection. Previous studies mainly focused on how FDI affected economic development of mainland China.. Few studies investigated the performance of multinational enterprises 2.
(8) (MNEs) in China, except Filatotchev et al. (2007) and Zhao and Luo (2002) which concentrated on corporate governance and product diversity, respectively. According to our survey, we found that there is no research that investigates how the degree of market developments influences the performance of subsidiaries of MNEs. Taiwan is a small open economy with a small domestic market and few natural resources, therefore her development must depend heavily on international markets.. For. instance, the value of exports accounted for 73.66 percent of GDP and that of exports plus It is well known that Taiwan‟s economy has. imports was 140.13 percent of GDP in 2010.. been growing at a rapid pace with per capita income growing from US$196 in 1952 to US$18,603 in 2010.. Lucas (1993) argued that the economic miracle of Taiwan comes from. the rapid accumulation of human capital to push economic growth, which results from learning-by-doing through a huge volume of exports.. Taiwan‟s FDI took off in the middle. of 1980s and most FDI had been undertaken by export-oriented firms (Chen, 1992). According to the information published by the Investment Commission in Ministry of Economic Affairs, Taiwan's government approved only US$374.58 million in overseas investment in 1987, while it surged to US$62.5 billion by the end of 2010.. Mainland China. has an advantage in attracting FDI from Taiwan since the two economies share a similar cultural background in spite of different economic and political systems.. According to. official statistics of the People‟s Republic of China (PRC) Ministry of Foreign Trade and Economic Cooperation, the accumulated contractual agreement and actual investment from 1995 through to 2009 were US$77.41 and US$41.02 billion, respectively.. According to the. Republic of China (ROC) Ministry of Economic Affairs, mainland China had absorbed about 57 percent of Taiwan‟s outward FDI until 2009. In addition, the U.S.-China Economic and Security Review Commission indicated that Taiwan contributed about 50% of mainland China‟s FDI until 2004. Hence, the activities of mainland China‟s subsidiaries of Taiwan 3.
(9) are worth investigating.. This study investigates how the degree of market development. affects their operational performance.. 1.2. Research Procedure This paper is organized as follows.. motivation, and purpose. framework.. Chapter 1 introduces the research background,. Chapter 2 is literature review. Chapter 3 provides the research. Chapter 4 consists of data sources, variable description, empirical results and. discussion. Chapter 5 concludes this paper and provides future research. Research Background, Motivation, and Purpose. Literature Review. Research Framework. Empirical Model. Empirical Results and Discussion. Research Conclusions. Figure 1. Research Procedure 4.
(10) Chapter 2. Literature review. 2.1 FDI Theory MNEs are the companies who engage in many FDI activities (Dunning, 1993).. Many. well-known theories illustrated what caused FDI. Hymer (1960) pointed out firm-specific advantage theory.. When MNEs have firm-specific advantages to overcome the liability of. foreignness in overseas market and make profit, they will engage in FDI.. Horst (1972),. Wolf (1977) and Lall (1980) based on the data of U.S. companies, found that firm-specific advantage including tangible assets, intangible assets, and core competences will significantly affect the investment intention of U.S. companies.. In addition, Buckley and Pearce (1979). also found similar results while studying the largest 156 MNEs globally. The international product life cycle theory proposed by Vernon (1966) is based on the concept of comparative advantage principle. The process of product development can be divided into three stages – new product stage, mature product stage, and standardized product stage.. The production sites vary with the development of product stages and comparative. advantages. It also reflects company's motivations of FDI and transformation process.. In. new product stage, as the new products are usually invented in advanced countries, firms are expanding their domestic market and using technology-intensive method to produce.. In. mature product stage, due to the saturation of domestic market becomes and technology spillover, the products start to be produced in other industrialized countries. In standardized product stage, the products are accepted by local consumers; moreover, local firms start to produce the products. The cost would be important factor for firms at this time. Internalization theory by Buckley and Casson (1976) suggested that the enterprises transfer expertise, human resources, marketing and other intermediate products from parent company to subsidiary in order to maximize its profit in an incomplete market. The internal 5.
(11) market will substitute the external market and when the activities of internalization are conducted in other countries, it will constitute FDI. Dunning (1993) proposed an eclectic paradigm, classified the advantages of MNEs into three types –ownership advantages, location advantages and internalization advantages.. The. firms start FDI because they have some advantages to offset the operating cost in other countries. The enterprises will adopt various strategies when they have different advantages. When the firms have ownership advantages, they can adopt export, FDI, or agency contract. When the firms face the choice between FDI and agency contract, they will choose the strategy which has lower cost. When the firms have location advantages, they will adopt FDI if they find that host country provide good investment environment. Kojima (1978) and Ozawa (1979) proposed factor endowment theory. They analyzed the Japanese MNEs and found that firm-specific advantage theory and international product life theory were not suited to Japanese FDI. conditions to engage in FDI.. They claimed that there are two basic. First, the industry that undertakes FDI lost the comparative. advantage in parent country. Second, the industry that undertakes FDI has comparative advantage in host country.. In other words, the abundant resource and cheap labor in host. country can increase the comparative advantage of the industry. They thought that Japanese FDI can increase the trade between Japan and U.S. Regardless of the motivation of FDI is abundant resource or cheap labor, it must reduce the operating cost to enhance competitiveness in market. It belongs to trade oriented FDI. Network linkage was proposed by Johanson and Mattsson (1987).. They indicated the. industrial network is composed of production, distribution, and service companies. They adopt division strategy and to depend on each other.. The international network functions. can be divided into three approaches – international expansion approach, international penetration approach, and international integration approach. 6. Chen and Chen (1998) found.
(12) that the network connection has significant impact on the location choice for Taiwan‟s companies.. 2.2 The FDI in emerging economies Blomström and Kokko (1996) and Sinani and Meyer (2004) indicated that many developing or transition countries adopt preferential policies in order to attract foreign investors, and thus gain spillover effects of FDI (Blomström and Kokko, 1996; Sinani and Meyer, 2004).. These countries want to modernize their industrial structure, upgrade their. infrastructure, and acquire new capabilities.. However, empirical studies found that FDI. does not always have positive contribution in emerging economy. several ways.. Spillovers may arise in. First, demonstration effects allow local firms to learn by observing. multinational enterprises (MNEs) operating higher level of technology.. Second, local. employees trained by MNEs may move to jobs in domestic firms, taking with them their upgraded human capital.. Third, spillovers from backward and forward linkages occur. through business transactions between foreign affiliates and both domestic suppliers and their customers (Sinani and Meyer, 2004).. However, some studies argued that FDI may not. contribute positively to host countries due to market-stealing effects and skill-stealing effects (Haddad and Harrison, 1993; Aitken and Harrison, 1999).. The market-stealing effect means. that FDI may draw demand away from local firms and force them to cut down production. The skill-stealing effect means that FDI might attract the best workers away from local firms, leaving them with less-skilled workers. Many studies discussed the FDI in emerging economies from different viewpoints. Bevan and Estrin (2004) based on the data of FDI flows from 18 market economies (EU-14, Korea, Switzerland, Japan, U.S., and so on) to 11 transition economies (Czech Republic, Hungary, Poland, Romania, and so on) over the period 1994-1998. 7. They proposed that FDI.
(13) inflows are decided by unit labor costs, host market size, country risk, and gravity factors. The result shows that when the transition progress in a country is poor, it will receive lower FDI, it also limits the relative transition progress further. In addition, they also found that lagged FDI positively impact country credit ratings.. Campos and Kinoshita (2003) based on. the data of 25 transition economies which disintegrated from Soviet Union, explored whether the technology which FDI brings will impact positively the economic development in host country.. The results found that FDI transfer technology to host country indeed; moreover, it. also encourages the economic development in host country positively.. Bandelj (2002). studied central and eastern European over the period 1995-1997, found that the economic and culture between countries have a positive relationship with FDI flows. Lucas (1993) and Jun and Singh (1996) indicated the FDI in emerging market have put stress on political risk and economic indicators.. It contains three parts – marco-economic. stability (exchange rate risk and inflation), institutional stability (tax regimes and corruption), and political stability.. Borensztein et al. (1998) studied 69 developing countries over the. period 1970-1989. They indicated when the human resource achieves certain level in one country, the FDI can encourage the economic growth.. Hahm and Heo (2008) based on the. data of Hong Kong, Singapore, South Korea, Taiwan, India, Malaysia, and Thailand, discussed how the FDI from Japan and U.S. influence the economy of host countries.. The. empirical results indicated the FDI has positive contribution on the economic development in Hong Kong, Singapore, South Korea, and Taiwan. However, the result is insignificant in the other three countries. The technology is more advanced in four countries (Hong Kong, Singapore, South Korea, and Taiwan) than it is in other three countries, so the transfer technology from Japan and U.S. is more suitable in the four countries. Many scholars indicated that FDI has positive contribution on China‟s economic growth (Chen et al., 1995; Wei and Liu, 2001; Sun et al. 2002). Chen et al. (1995) observed the 8.
(14) data of China‟s absorption of FDI and found that FDI contributed toward the success of China‟s economic reforms.. In addition, FDI encouraged the local firms to compete globally.. However, FDI also accelerates the disparity of economic development, worsens the unequal income distribution.. Taube (2003) found that the GDP per capita of coastal provinces is. several times higher than it is in central and western provinces of China. The reasons for the uneven regional development include political factors, natural resources, historical background, and uneven FDI. The FDI raise the economic development and industrial structure. In addition, the government should improve the local infrastructure to absorb FDI. Cheung et al. (2004) explored whether the FDI has positive contribution on technology innovation from the viewpoint of patent.. They also discussed how FDI spillover influences. the coastal, central, and western area of China. They studied 30 provinces in China over the period 1995-2003, found the FDI impacts the application of patent positively for local firms. In addition, the spillover effect is more significant in central and western area.. 2.3 The performance of MNEs’ subsidiaries The performance of overseas subsidiaries is affected by various factors.. Both. Filatotchev et al. (2007) and Luo et al. (2009) based on the data of newly industrialized economies and developed countries respectively, found that higher degree of corporate governance negatively impact the other countries investments on its subsidiaries. Fey and Björkman (2001) analyzed 101 subsidiaries which invested in Russia, found a direct relationship between human resource management and the performance of the overseas subsidiaries. The business group also influences the performance of overseas subsidiaries. group can link each other closer through cross-shareholding. 9. Business. The interchange of.
(15) information and resources in the complex market can increase trust between each other (Luo and Chung, 2005).. Chang and Hong (2000) studied Korean industry, found the business. group will conduct business transaction by sharing intangible assets and financial resources including debt guarantee, stock investment and internal trade in order to increase performance and expand the goals of subsidiaries.. Khanna and Rivkin (2001) based on the. data of 14 emerging economies including Latin America (Brazil), Asia (Taiwan, South Korea), and South Africa, found that in12 of them the business group has an influence on its overseas subsidiaries. Delios et al. (2008) studied 12,991 Japanese subsidiaries, analyzing the relation between product diversification and performance of overseas subsidiaries.. They found host country‟s. market institution and product diversification have negative and positive influence on performance of overseas subsidiaries, respectively.. Hitt et al. (1997) discuss from product‟s. perspective and geographic diversification. They found the product diversification is positively related with performance; however, the geographic diversification correlated negatively with performance. ownership structure.. Zhao and Luo (2002) analyzed the product diversification and. Based on the data of 319 subsidiaries in China, they found these two. variables related with performance of overseas subsidiaries highly. The degrees of entry can be divided into six types from low (export) to high (wholly owned).. The performance of overseas subsidiaries will be different when they adopt various. entry types.. Woodcock et al. (1994) and Nitsch et al. (1996) studied Japanese overseas. subsidiaries, found that mergers and acquisitions have a lower chance to succeed; however, the greenfield is easy to make profit relatively.. Theingi and Tang (2006) indicated the. wholly owned subsidiaries are more profitable than the joint venture subsidiaries. Andersson et al. (2002) discuss the network relations and performance of overseas subsidiaries. They divided external network into business embeddedness and technical 10.
(16) embeddedness.. Both the embeddedness not only impact on the performance of subsidiaries,. but on the development of parent company. Birkinshaw et al. (2005) analyzed 24 overseas subsidiaries which invest in Scotland. They divided the environments of overseas subsidiaries into internal and external. internal environment is composed by internal consumers and suppliers.. The. The external. environment is composed by the customers and competitors. The managers will respond the market opportunities and threats actively in order to maintain the performance of subsidiaries. Many studies also analyzed the relationship between investment environment and firm‟s performance (Aharoni et al., 1978; Prescott, 1986; Li, 2001). Several studies analyze the performance of overseas subsidiaries from different factor. Few studies investigated the performance of multinational enterprises (MNEs) in China, except Filatotchev et al. (2007) and Zhao and Luo (2002) focus on corporate governance and product diversify respectively.. For our survey, only Zhang et al. (2010) analyzed the. efficiency of China‟s local bank from market development; however, there is no research to investigate how market development influences the performance of subsidiaries of MNEs. This study will analyze the relationship between performance and market development using Taiwan‟s subsidiaries in mainland China.. 11.
(17) Chapter 3. Research Framework. 3.1 Market development The economic systems can be divided into three types – command economies, mixed economies, and market economies.. In a market economy, all productive activities are. privately owned and production is determined by the interaction of supply and demand. role of government is to encourage free and fair competition between private producers.. The In. a mixed economy, governments tend to own firms that are considered important to national security, while other sectors are left to private ownership and free market mechanisms.. In a. command economy, the government plans the goods and services that a country produces, the quantity that is produced, and the prices as which they are sold. state-owned, and governments allocate resources.. All businesses are. Nevertheless, it tends to stagnate since. there is little incentive to control costs and be efficient. Friedman (1962) argued that market liberalization is the best strategy on the distribution of social resources and on the management of personal affairs.. Scully (1988) showed that. there is a positive relationship between level of freedom and economic growth.. Barro (1991). found that countries with free enterprise systems have higher rates of economic growth than those with socialist systems, while it is insignificant between free enterprise systems and mixed systems.. In addition, countries associated with good property rights protection tend. to achieve greater economic growth rate than those associated with poor property rights protection. Hence, a country‟s economic system and property rights regime may constitute a good indicator of the potential long-run benefits of doing business in a country.. This may. suggest that MNEs are more likely to achieve goal and/or gain profit in host countries associated with greater degree of market development. follows: 12. Hence, we propose hypothesis 1 as.
(18) Hypothesis 1:Market development will benefit MNEs’ overseas subsidiaries. Due to the complexity of market development, Fan and Wang (2000, 2004, 2006, 2009) constructed the market development index from five dimensions: the relationship between government and market, the development of non-state-owned economy, the degree of goods market development, the degree of factor market development, and the degree of legal protection. Hence, we establish hypothesis H1a to H1e as follow: (1) The role of local government The different political system may increase the cost and uncertainty in communication between business and government (Dow and Karunaratna, 2006).. The major change is to. allocate the economic resources by market rather than by government plans for market reform.. According to international experiences, the market will be more liberal when the. government involves less in allocation of economic resources.. After the market reform, the. government of transitional economy should gradually withdraw from the field of investments, reduce the proportion of resources distribution, and decrease intervention in enterprises gradually.. However, many companies are still intervened by local government when. engaging in FDI.. The overseas subsidiaries have to spend much time and money to. communicate with local government.. Paying additional costs is inevitable.. In addition,. some overseas subsidiaries will bribe the local government in order to get additional interests. These opaque operations and inefficient systems will interfere with the normal operation of market mechanism and become a heavy burden to the overseas subsidiaries. Blomström and Kokko (1996) and Sinani and Meyer (2004) found that the government of many developing or transitional economy adopt preferential policies in order to attract foreign investors.. The government regards FDI as their strategy to encourage domestic. economic development (Tatoglu and Glaister, 1998; Cheng and Kwan, 2000; Makino et al., 13.
(19) 2002).. Henisz and Delios (2001) pointed out that the government policies in host country. may impact the foreign investment. degree to overseas subsidiaries.. However, local government still meddles with certain The development of free market institution enable. companies to make strategic decisions efficiently, including product selection, quality, product output and material input (Behrman and Rondinelli, 2000).. Hence, the enterprises. can implement favorable strategies according to the market conditions and circumstances to raise profitability.. Therefore, Hypothesis 1a proposed as follows:. Hypothesis 1a: The weaker the role of the local government in the market is, the stronger the performance of MNE’s overseas subsidiaries has. (2) The degree of non-state-owned economic development Enterprises can be divided into state-owned enterprises and non-state-owned enterprises. The economic reform is to turn state-owned enterprises into state-owned and non-state-owned enterprises and allows them to exist simultaneously.. When economy is. transiting from government planned to market-oriented, how to develop the non-state-owned enterprises become very important (Behrman and Rondinelli, 2000).. Many studies. discussed state-owned enterprises and non-state-owned enterprises separately.. Huang and. Meng (1997) found that non-state-owned enterprises have better performance than state-owned enterprises. Buckley et al. (2002) indicated that state-owned enterprises are more flexible in budget constraints. Their finance depends on central government in spite of performance condition.. The objectives of state-owned enterprises are not only the. production of goods, but also include government‟s political support like employment opportunities, provision of social services and welfares which conflict with the production efficiency.. 14.
(20) The proportion of state-owned and non-state-owned enterprises is inconsistent in different locations.. Thus, overseas subsidiaries face the diverse degree of competition when. they operate in different location.. If the host has a high proportion of state-owned. enterprises, the location can not reflect its market conditions accurately. It is oriented by the government‟s policies.. When the overseas subsidiaries operate in these locations, the. market must be influenced by majority of state-owned enterprises. It will deprive the right of free competition.. When the parent company invests in a host province with vigorous. non-state-owned enterprises, it is committed to improving the company‟s efficiency and productivity.. Because non-state-owned enterprises always consider economic conditions. and company performance as primary goal, they will encourage vigorous competition. Overseas subsidiaries must also improve their efficiency, productivity, and performance to maintain competitiveness in order to survive in the host.. Therefore, Hypothesis 1b proposed. as follows: Hypothesis 1b: The non-state-owned economic development will benefit MNEs’ overseas subsidiaries. (3) The degree of goods market development The producers and consumers trade in the market to maintain the flows of goods, and to obtain products‟ prices with a balance of supply and demand.. However, many products‟. prices are decided by the government instead of by the market mechanism, the phenomena are more obvious in transition economies.. Although the transition economies have. gradually transferred its role in determining the products‟ prices to the market, the government still holds a relatively higher proportion in making the decisions.. In addition,. some provinces even develop regional trade protection to protect local enterprises, creating barriers to foreign products, including the different standards of technical inspection, quality inspection, and environmental criteria.. These measures have violated the principles of fair 15.
(21) competition, reduced the efficiency of resource allocation, and impacted the competitiveness of MNEs.. Dunning (2001, 2002) and Gatignon and Kimberly (2004) found that the. liberalization of capital markets and the high mobility of products have impacted MNE‟s strategies. When overseas subsidiaries operated in a location with lower degree of goods market development, higher proportion of local government intervention will lead to inability of the local market to reflect supply and demand accurately.. The overseas subsidiaries can not. implement the advantageous strategies, raise prices, and reduce costs in order to obligate the government‟s stipulation.. Moreover, the regional trade protections increase the production. costs of overseas subsidiaries.. Conversely, when the location has a high degree of goods. market development, the products‟ prices will be determined by market.. The resources. would also be allocated efficiently. Therefore, overseas subsidiaries are able to compete fairly with local enterprises, and enhance the profit for the companies. When regional protection is reduced, overseas subsidiaries and its products will increase the competitiveness. Due to the free flow in the market, the goods obtain more sales opportunities.. Therefore,. Hypothesis 1c proposed as follows: Hypothesis 1c: The degree of goods market development is positively related to the performance of MNE’s overseas subsidiaries (4) The degree of factor market development Factor markets are composed of many aspects which include land, labor, capital, and so on. The factors enable enterprises to operate normally.. Whether these elements can be. easily acquired or not is an important consideration for companies to invest and operate in foreign market. Many enterprises invest in developing countries in order to reduce the factor cost. Zhao and Zhu (2000) indicated that costs affect the location choice for FDI, 16.
(22) especially labor costs.. Dunning (2001, 2002) and Gatignon and Kimberly (2004) found that. MNE‟s strategies are influenced by the high mobility of people.. When the degree of factor. market development is higher, the local factors are easier to obtain. In general, due to the consideration of risks, capital acquisition is more difficult than other factors.. Because the. bank's loan conditions are different, it is more difficult for overseas subsidiaries to obtain finance in host country. It will impact the overseas subsidiaries‟ operation. When the overseas subsidiaries operate in low degree of factor market development, they would not operate normally.. Due to the lack of local factors, they can not expand. factory or increase funding easily, it must reduce the chances of making profit.. When the. factor market development is high, it will attract the labor inflow from other locations. It also attracts more foreign investment, so the competition between financial industries would be more intense.. If the overseas subsidiaries operate in high degree of factor market. development, the abundant factors are accessible to the overseas subsidiaries.. The financial. industries will also relax the standards for loans due to intense competition.. Overseas. subsidiaries can easily acquire the factors according to the company‟s condition, and increase its profitability and capabilities. Therefore, Hypothesis 1d proposed as follows: Hypothesis 1d: The degree of factor market development and the performance of MNEs’ overseas subsidiaries are positively related (5) The degree of legal protection Since the law institution and business environment do not develop completely in developing countries, it would cause information asymmetry and risk easily (Hoskisson et al., 2000; Wright et al., 2005).. Wan and Koskisson (2003) found that political and legal. institutions have influenced firm‟s diversification strategies.. Regardless of FDI is from. developed countries to emerging markets, or from emerging economies to emerging markets, 17.
(23) the investment risk always exist. Bevan and Estrin (2000) indicated the risks in transition economies include balance of government, regional development, industrial development, reserves and corruption.. In order to promote industrial development, protecting the. manufacturers‟ rights is a prerequisite in market.. These protections include judicial,. administrative law enforcement agencies, and so on.. Although legal regulations are. stipulated by the state, the degree of law implementation is inconsistent in each province. Hence, overseas subsidiaries face diverse legal environment while operating in different province.. If the laws are enforced more fairly in the province, the overseas subsidiaries are. protected more under the legal rights.. It would reduce investment risks and encourage. overseas subsidiaries to develop and invest. Patent law makes the patent holders clear their own distribution of patent rights. (Hu and Jefferson, 2009). If the host country does not respect the patent protection, the research. and development of overseas subsidiaries are easily imitated by other companies in the host country. It would damage the firms‟ rights and reduce the motivation to research and develop.. If the overseas subsidiaries have more patent protection, they will have more. willingness to research and innovate in order to maintain the company's core competence and performance.. Therefore, Hypothesis 1e proposed as follows:. Hypothesis 1e: The degree of legal protection has positive impacts on the performance of MNEs’ overseas subsidiaries.. 3.2 Control variable (1) Firms’ characteristics Many scholars indicated that firms‟ characteristics impact the performance of overseas subsidiaries and location choices. Firms‟ characteristics includes firm size, industry, firm 18.
(24) relational linkage, and performance have influenced MNE‟s location choices (Horst, 1972; Terpstra and Yu, 1988; Chen and Chen, 1998; Nachun and Zaheer, 2005).. Filatotchev et al.. (2007) and Luo et al. (2009) discuss the relationship between the family ownership and performance. Both studies found that the degree of corporate governance impact the other countries investment on its subsidiaries negatively.. Fey and Björkman (2001) from the. viewpoint of human resource management found that human resource management impact the performance of the overseas subsidiaries directly.. Khanna and Rivkin (2001) examined. 14 emerging economies, found that in 12 of them the business group has an influence on its overseas subsidiaries.. Zhao and Luo (2002) analyzed the product diversification and. ownership structure.. They found these two variables related with performance of overseas. subsidiaries highly.. Because the firms‟ characteristics are important, we would take the. relative variables into the model.. (2) Local infrastructure When a country's economy began to grow, it will steadily increase the infrastructure. Loree and Guisinger (1995) and Cheng and Kwan (2000) found that there is a relationship between expected cost of operation and infrastructure at the host country. It also influenced MNE‟s decision in location choice. Dunning (2001, 2002) and Gatignon and Kimberly (2004) pointed out that the fall in transportation cost will influence MNE‟s internationalization strategies.. Advanced infrastructure can boost commercial development,. reduce transportation costs and time, and increase trading opportunities.. A good public. infrastructure should include telecommunications, transportation, public utility equipment, and so on to attract more FDI (Zhan, 1993).. Advanced infrastructure and broad market has. a positive effect on FDI (Cheng and Kwan, 2000).. Therefore, the comprehensive. infrastructure can attract more FDI to enhance market capital. 19. A complete local.
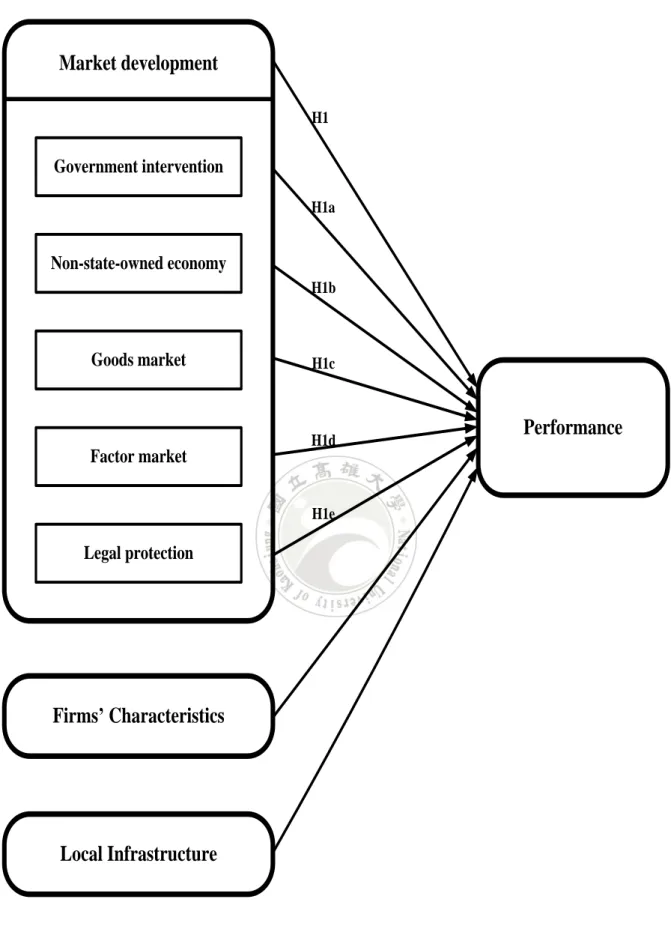
(25) infrastructure can reduce information asymmetry, create a convenient business environment, and increase the willingness to invest.. Benefited from the business environment, overseas. subsidiaries is capable of improving their operational efficiency.. Hence, we also consider. the infrastructure variables into the model. The above discussion expresses how market development, firms‟ characteristic, and local infrastructure relate to the performance of overseas subsidiaries. framework for this study is shown as Figure 2.. 20. A conceptual.
(26) Market development H1. Government intervention H1a. Non-state-owned economy H1b. Goods market. H1c. H1d. Performance. Factor market H1e. Legal protection. Firms’ Characteristics. Local Infrastructure. Figure 2. The Conceptual Framework and Hypotheses. 21.
(27) Chapter 4. Empirical Analysis. 4.1 Data Source and Variable Description The data set consists of 689 Taiwan‟s manufacturing companies in China including 2,074 observations over the period 2003-2007. Since we have a five-year panel data, all nominal variables are deflated by GDP deflator with 2005 as the base year. The data sources consist of four data banks: (1) NERI INDEX of marketization of China‟s provinces (2006, 2009), published by the Economic Science Press; (2) China Credit Information Service (CCIS), which is currently Taiwan‟s largest professional credit company that provides a comprehensive range of business information; (3) Taiwan Economic Journal (TEJ); (4) China City Statistical Yearbook, published by the China Statistics Press. The dependent variable is the logarithm of sales. categories:. Explanatory variables include three. market development, firm characteristics, and local infrastructures.. The. variables‟ definition and source are referred to Appendix A. Market development consists of five variables: the role of local government (GOV), the degree of non-state-owned economic development (NON-STATE), the degree of goods market development (GOODS), the degree of factor market development (FACTOR), and the degree of legal protection (LEGAL).. They. were collected from NERI INDEX of marketization of China‟s provinces (2006, 2009), measure the degree of market development of each province in China from five dimensions. If the five variables are higher, the market development in a province is more complete. Each variable are measured by many indicators. The indicators and calculation are referred to Appendix B. The values of SIZE, SIZESQ, and RDI provided by CCIS, are used to evaluate firm characteristics.. The SIZE is measured by total assets.. The SIZESQ is measured by the. square of total assets. We include the linear and quadratic terms of firm size in the empirical 22.
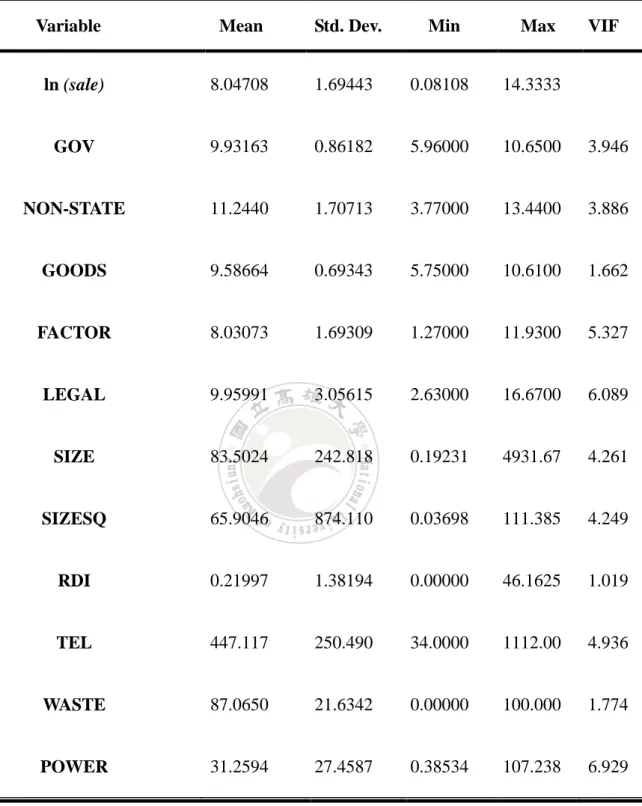
(28) model. Coefficients of the linear and quadratic terms can be used to check the effects of returns to scale.. The RDI is measured by the expenditure on research and development over. sales revenue.. The influence of SIZE on growth rate of sales is positive, but at a. diminishing rate, i.e. the coefficients of SIZE and SIZESQ are positive and negative, respectively. Moreover, the impact of the variable RDI on lnsale varies. This study considers three variables to measure infrastructure: local telephone users (TEL), ratio of consumption wastes treated (WASTE), electricity consumption (POWER). We collect these three variables from China City Statistical Yearbook. and WASTE are expected to effect performance positively. POWER on growth rate of sales is negative.. Both variables TEL. However, the influence of. When the electricity consumption is higher, the. potential electricity is lower. If the electricity consumption more than a province provides, it may limit the electricity consumption in turn. Therefore, it has negative influence on the performance of overseas subsidiaries. Descriptive statistics of variable and VIF for all firms are reported in Table 1. The range of VIF is from 1.019 to 6.929.. Hence, we may conclude that the problem of. multicollinearity do not exist in our data.. 23.
(29) Table 1. Variable. Descriptive Statistics of Variables for All Firms. Mean. Std. Dev.. Min. ln (sale). 8.04708. 1.69443. 0.08108. 14.3333. GOV. 9.93163. 0.86182. 5.96000. 10.6500. 3.946. NON-STATE. 11.2440. 1.70713. 3.77000. 13.4400. 3.886. GOODS. 9.58664. 0.69343. 5.75000. 10.6100. 1.662. FACTOR. 8.03073. 1.69309. 1.27000. 11.9300. 5.327. LEGAL. 9.95991. 3.05615. 2.63000. 16.6700. 6.089. SIZE. 83.5024. 242.818. 0.19231. 4931.67. 4.261. SIZESQ. 65.9046. 874.110. 0.03698. 111.385. 4.249. RDI. 0.21997. 1.38194. 0.00000. 46.1625. 1.019. TEL. 447.117. 250.490. 34.0000. 1112.00. 4.936. WASTE. 87.0650. 21.6342. 0.00000. 100.000. 1.774. POWER. 31.2594. 27.4587. 0.38534. 107.238. 6.929. 24. Max. VIF.
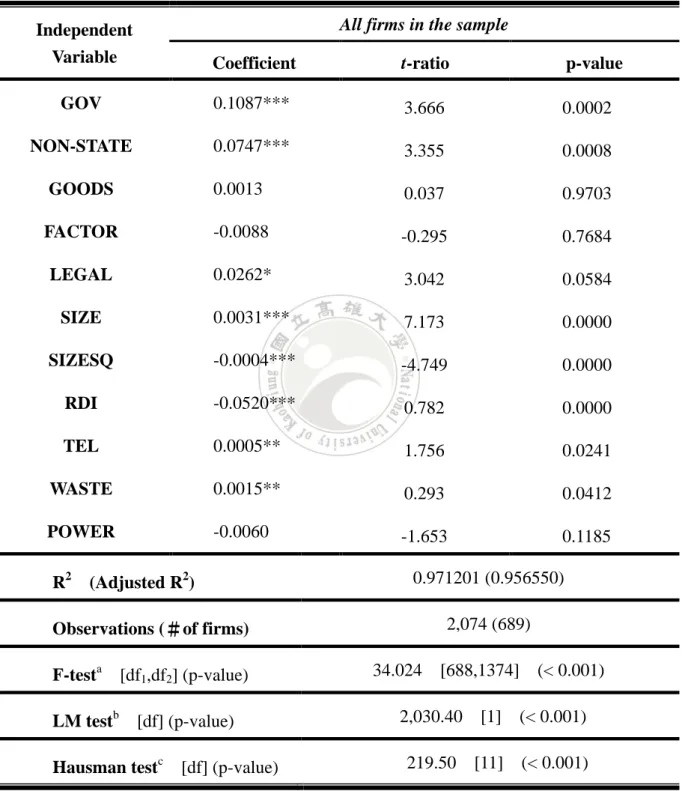
(30) 4.2 Empirical Model When analyzing the panel data, ordinary least squares (OLS) estimators may be inconsistent and/or meaningless if there exists heterogeneity across firms (Hsiao, 2003). The fixed- and random-effects models can take into account the heterogeneity across firms by allowing variable intercepts.. Our choice among these three models is based on some. statistical tests: F-test (the OLS model vs. the fixed-effects model), LM test (the OLS model vs. the random-effects model), and the Hausman test (the random-effects model vs. the fixed-effects model).. We will employ these three tests to select the best model to analyze. the performance of Taiwan‟s overseas subsidiaries in mainland China. This study specifies the following regression model to test the hypotheses we proposed:. ln saleit i 1GOVit 2 NONSTATEit 3GOODSit 4 FACTORit 5 LEGALit 6 SIZEit 7 SIZESQit 8 RDI it 9TELit 10WASTEit 11POWERit uit where uit are random disturbances for company i at period t with mean 0 and variance u2 ;. i for all i in the OLS model, i are fixed in the fixed-effects model, i are iid ( , 2 ) , and both i and uit are independent in the random-effects model.. 4.3 Empirical Results The empirical results are represented in Table 2. The F-test and the LM test suggest that both fixed-effects and random-effects models are better than the OLS model; in other words, there exists heterogeneity across companies. Moreover, based on the result of the Hausman test, the fixed-effects model is better than the random-effect model. Hence, we only present 25.
(31) and interpret the fixed-effects model.. Table 2. Empirical Results of the Fixed-Effects Model for All Firms All firms in the sample. Independent Variable. Coefficient. t-ratio. p-value. GOV. 0.1087***. 3.666. 0.0002. NON-STATE. 0.0747***. 3.355. 0.0008. GOODS. 0.0013. 0.037. 0.9703. FACTOR. -0.0088. -0.295. 0.7684. LEGAL. 0.0262*. 3.042. 0.0584. SIZE. 0.0031***. 7.173. 0.0000. SIZESQ. -0.0004***. -4.749. 0.0000. RDI. -0.0520***. 0.782. 0.0000. TEL. 0.0005**. 1.756. 0.0241. WASTE. 0.0015**. 0.293. 0.0412. POWER. -0.0060. -1.653. 0.1185. R2. 0.971201 (0.956550). (Adjusted R2). 2,074 (689). Observations (#of firms) 34.024. F-testa [df1,df2] (p-value) LM testb. [688,1374] (< 0.001). 2,030.40. [df] (p-value). 219.50. Hausman testc [df] (p-value). [1]. (< 0.001). [11] (< 0.001). Note:(1)*, **, and *** represent the 10%, 5%, and 1% levels of significance, respectively. (2) a F-test:H0:OLS, HA:Fixed Effects Model; b. LM-test:H0:OLS, HA:Random Effects Model;. c. Hausman test:H0:Fixed Effects Model, HA:Random Effects Model 26.
(32) The estimated coefficients about market development not only significantly affect lnsale, but also are consistent with the expected signs, except the goods market and factor market. The estimated coefficient of GOV is significantly different from zero at 1% level of significance.. Hence, a province associated with less government intervention, ceteris. paribus, the overseas subsidiaries will acquire higher growth rate of sales, supporting our hypothesis 1a.. The variable NON-STATE is used to test hypothesis 1b.. The positive. coefficient of NON-STATE is also significantly different from zero at 1% level of significance, strongly supporting the corresponding hypothesis.. Hence, we may conclude that the. performance of overseas subsidiaries mainly depends on vigorous non-state-owned economy development. In addition, both the development of goods market and factor market are insignificantly related to lnsale.. Both variables GOODS and FACTOR point out that the degree of goods. market development and factor market development in each province do not influence the performance of overseas subsidiaries.. Therefore, hypothesis 1c and hypothesis 1d are not. supported. The estimated coefficient of LEGAL is significantly different from zero at 10% level of significance.. The value hints that the effect of local legal protection on overseas. subsidiaries, ceteris paribus, will influence the performance of overseas subsidiaries positively. Empirical results show that the estimated coefficient SIZE is significantly positive at 1% level.. The variable SIZESQ and RDI are significantly negative at 1% level of significance.. Therefore, the firm characteristics, based on variables SIZE is positively related to lnsale. The variable SIZESQ and RDI are negatively related to the performance of overseas subsidiaries. Empirical results also suggest that some infrastructural variables are not only significantly related to sales, but also are consistent with the expected signs. 27. Both TEL and.
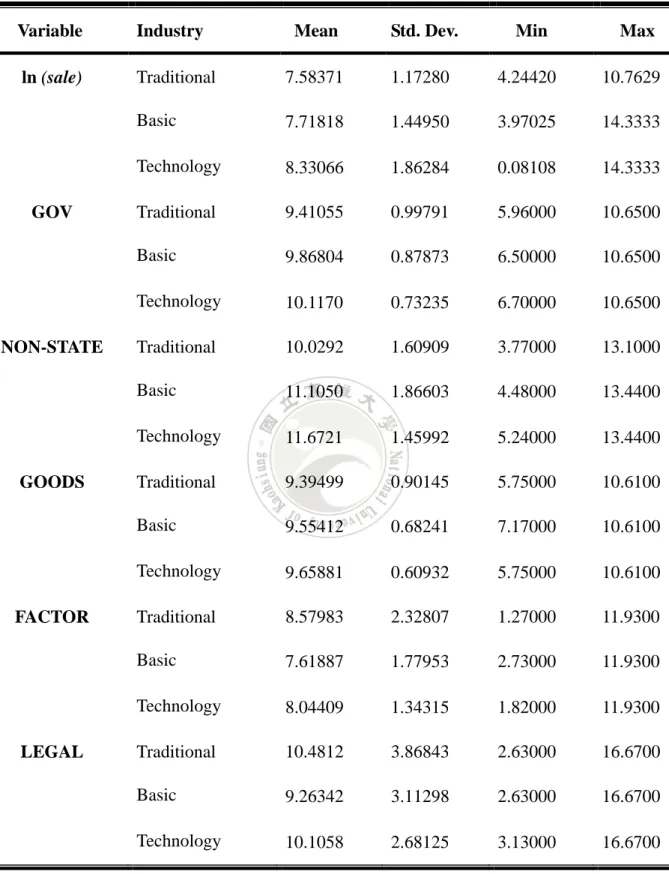
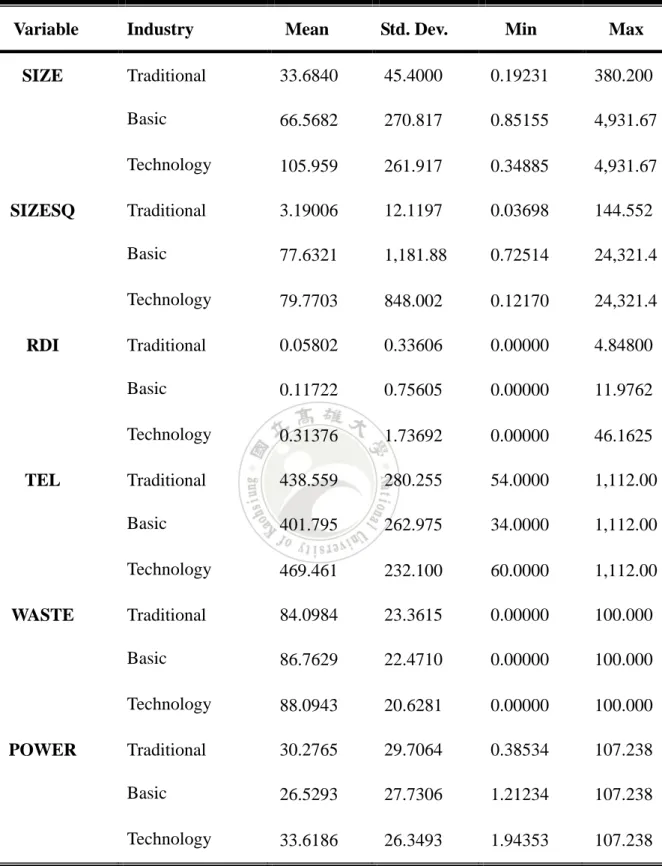
(33) WASTE are significantly related to lnsale positively.. In addition, the estimated coefficient of. POWER is significantly negatively, indicating that the larger electricity consumption a province has, the lower the performance overseas subsidiary has. Our data basically consists of three kinds of industries, traditional industry, basic manufacturing industry, and technology intensive industry. Descriptive statistics of market development variables for three industries are reported in Table 3.. 28.
(34) Table 3. Descriptive Statistics of Variables for Three Industries. Variable. Industry. ln (sale). GOV. NON-STATE. GOODS. FACTOR. LEGAL. Mean. Std. Dev.. Min. Traditional. 7.58371. 1.17280. 4.24420. 10.7629. Basic. 7.71818. 1.44950. 3.97025. 14.3333. Technology. 8.33066. 1.86284. 0.08108. 14.3333. Traditional. 9.41055. 0.99791. 5.96000. 10.6500. Basic. 9.86804. 0.87873. 6.50000. 10.6500. Technology. 10.1170. 0.73235. 6.70000. 10.6500. Traditional. 10.0292. 1.60909. 3.77000. 13.1000. Basic. 11.1050. 1.86603. 4.48000. 13.4400. Technology. 11.6721. 1.45992. 5.24000. 13.4400. Traditional. 9.39499. 0.90145. 5.75000. 10.6100. Basic. 9.55412. 0.68241. 7.17000. 10.6100. Technology. 9.65881. 0.60932. 5.75000. 10.6100. Traditional. 8.57983. 2.32807. 1.27000. 11.9300. Basic. 7.61887. 1.77953. 2.73000. 11.9300. Technology. 8.04409. 1.34315. 1.82000. 11.9300. Traditional. 10.4812. 3.86843. 2.63000. 16.6700. Basic. 9.26342. 3.11298. 2.63000. 16.6700. Technology. 10.1058. 2.68125. 3.13000. 16.6700. 29. Max.
(35) Table 3 Variable SIZE. SIZESQ. RDI. TEL. WASTE. POWER. Descriptive Statistics of Variables for Three Industries (continuous) Industry. Mean. Std. Dev.. Min. Max. Traditional. 33.6840. 45.4000. 0.19231. 380.200. Basic. 66.5682. 270.817. 0.85155. 4,931.67. Technology. 105.959. 261.917. 0.34885. 4,931.67. Traditional. 3.19006. 12.1197. 0.03698. 144.552. Basic. 77.6321. 1,181.88. 0.72514. 24,321.4. Technology. 79.7703. 848.002. 0.12170. 24,321.4. Traditional. 0.05802. 0.33606. 0.00000. 4.84800. Basic. 0.11722. 0.75605. 0.00000. 11.9762. Technology. 0.31376. 1.73692. 0.00000. 46.1625. Traditional. 438.559. 280.255. 54.0000. 1,112.00. Basic. 401.795. 262.975. 34.0000. 1,112.00. Technology. 469.461. 232.100. 60.0000. 1,112.00. Traditional. 84.0984. 23.3615. 0.00000. 100.000. Basic. 86.7629. 22.4710. 0.00000. 100.000. Technology. 88.0943. 20.6281. 0.00000. 100.000. Traditional. 30.2765. 29.7064. 0.38534. 107.238. Basic. 26.5293. 27.7306. 1.21234. 107.238. Technology. 33.6186. 26.3493. 1.94353. 107.238. 30.
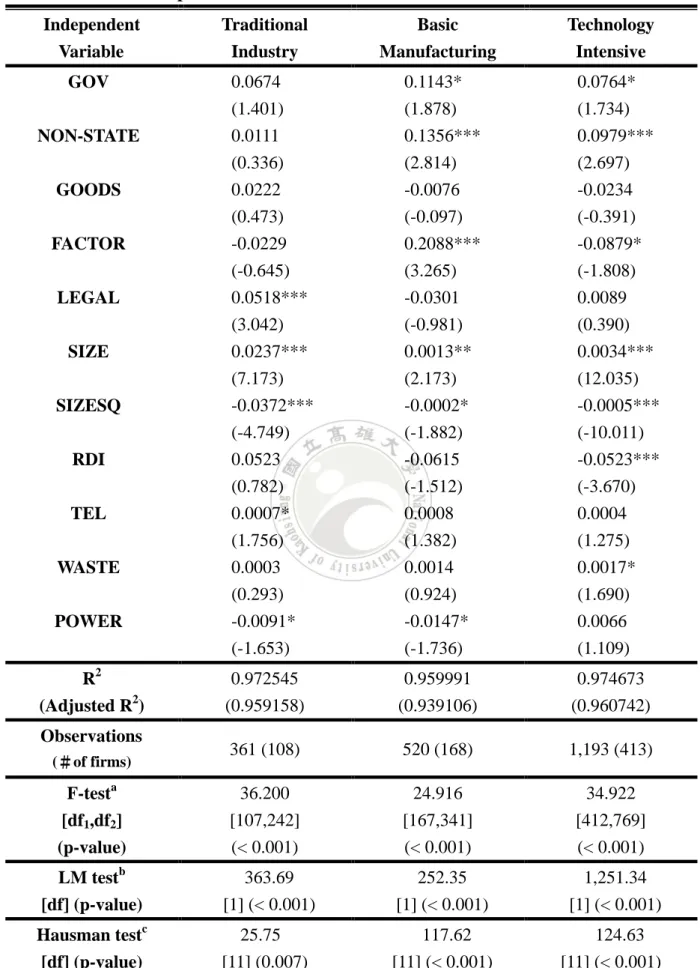
(36) The traditional industry, basic manufacturing industry, and technology intensive industry consist of 108, 168, and 413 firms including 361, 520, and 1,193 observations respectively. All types of industries differ in many aspects, such as requirement of factor, degree of competition, product life cycle, and so on.. Hence, we re-estimate growth models separately. by three types of industries, presented in Table 4. The F-test and the LM test indicate that the panel data model is better than the OLS model for three industries. In addition, the Hausman tests for all types of industries also suggest that the fixed-effects model is better than the random-effect model.. Hence, we only present and interpret the fixed-effects. models for three types of industries.. 31.
(37) Table 4. Empirical Results of the Fixed-Effects Model for Three Industries. Independent Variable. Traditional Industry. Basic Manufacturing. Technology Intensive. GOV. 0.0674 (1.401) 0.0111 (0.336) 0.0222 (0.473) -0.0229 (-0.645) 0.0518*** (3.042) 0.0237***. 0.1143* (1.878) 0.1356*** (2.814) -0.0076 (-0.097) 0.2088*** (3.265) -0.0301 (-0.981) 0.0013**. 0.0764* (1.734) 0.0979*** (2.697) -0.0234 (-0.391) -0.0879* (-1.808) 0.0089 (0.390) 0.0034***. (7.173) -0.0372*** (-4.749) 0.0523 (0.782). (2.173) -0.0002* (-1.882) -0.0615 (-1.512). (12.035) -0.0005*** (-10.011) -0.0523*** (-3.670). 0.0007* (1.756) 0.0003 (0.293) -0.0091* (-1.653). 0.0008 (1.382) 0.0014 (0.924) -0.0147* (-1.736). 0.0004 (1.275) 0.0017* (1.690) 0.0066 (1.109). 0.972545 (0.959158). 0.959991 (0.939106). 0.974673 (0.960742). 361 (108). 520 (168). 1,193 (413). F-testa [df1,df2] (p-value). 36.200 [107,242] (< 0.001). 24.916 [167,341] (< 0.001). 34.922 [412,769] (< 0.001). LM testb [df] (p-value). 363.69 [1] (< 0.001). 252.35 [1] (< 0.001). 1,251.34 [1] (< 0.001). Hausman testc [df] (p-value). 25.75 [11] (0.007). 117.62 [11] (< 0.001). 124.63 [11] (< 0.001). NON-STATE GOODS FACTOR LEGAL SIZE SIZESQ RDI TEL WASTE POWER R2 (Adjusted R2) Observations (#of firms). Note:*, **, and *** represent the 10%, 5%, and 1% levels of significance, respectively. 32.
(38) Via the result of separate comparison of industries, we found that the impact of market development is not consistent for three industries.. The estimated coefficients have the same. sign as those in overall analysis, except FACTOR.. For traditional industry, the coefficient of. LEGAL is positive as expected, and statistically significant. Other significant variables SIZE, SIZESQ, TEL and POWER have contribution to lnsale. The variables GOV, NON-STATE, FACTOR, and SIZE all impact the performance positively in basic manufacturing industry. However, SIZESQ and POWER have influence on lnsale negatively.. For technology. intensive industry, although the variables of market development which influence the basic manufacturing industry are still significant, the variable FACTOR is significantly negative related to lnsale especially.. All terms representing firm characteristics are significant.. The. SIZE has positive sign for the term. Both variables SIZESQ and RDI are negative. The coefficient WASTE is only significant variable in infrastructure.. 4.4 Discussion The coefficient of GOV is significantly positive. It implies that overseas subsidiaries have better performance when the local government of host has less intervention. It is also significantly positive in basic manufacturing industry and technology intensive industry. Although it is insignificant in traditional industry, it still presents positive contribution.. If. the host wants to absorb more foreign capital to promote economic growth, the local government has to reduce the opaque and inefficient intervention system to maintain the investment intention of overseas subsidiaries. The variable NON-STATE is significantly positive.. In general, the vigorous. non-state-owned economy development can enhance the performance of overseas subsidiaries. However, the coefficient of NON-STATE is inconsistent for three industries. It 33.
(39) is insignificant in traditional industry and significantly positive in basic manufacturing industry and technology intensive industry.. The possible explanation is that the. non-state-owned enterprises of traditional industry develop from 1980-1990.. The. non-state-owned enterprises of basic manufacturing industry and technology intensive industry are from 1990s. The development of non-state-owned enterprises in traditional industry is more complete than it is in other two industries.. Therefore, the marginal. contribution is smaller for overseas subsidiaries of traditional industry. The degree of goods market development is insignificant for all firms and three industries. The possible explanation might be that Taiwan‟s companies regard China as the production site, US and Europe are regarded as the destination of sale. Therefore, the development of goods market in China has little impact on Taiwan‟s subsidiaries.. Nevertheless, if Taiwan‟s. companies regard China as the destination of sale, maybe the goods market development has significant influence on the performance of overseas subsidiaries. The variable FACTOR is insignificant for all firms. It may imply that the degree of factor market development does not influence the performance of overseas subsidiaries. However, the impacts are inconsistent for three industries. Basic manufacturing industries reveal significantly positive correlation, while the technology intensive industries display significantly negative correlation. The possible explanation might be that the numbers of labor used by the basic manufacturing industries surpass that in the technology intensive industries.. When the local labor mobility is higher, the overseas subsidiaries are easier to. acquire labor force.. The basic manufacturing industries satisfy required elements faster than. the technology intensive industries. Hence, the performance of basic manufacture industry is easily increased because of the high labor mobility.. In addition, factor markets. development also includes the extent of the provinces to attract FDI. When FDI flow into the market from other countries, the advantage of language and culture similarity between 34.
(40) Taiwan and China will be reduced. subsidiaries.. It affects the performance of Taiwan‟s overseas. The foreign capital in China is more inclined to technology intensive. industries as our data from CCIS.. When the amount of foreign capital in a province is. higher, the impact on technology intensive industries is more obvious than that on other industries.. Hence, the development of factor market does not always impact the. performance of overseas subsidiaries positively. The coefficient LEGAL is significantly positive for all firms.. It implies that the province. which has high legal protection can enhance the performance of overseas subsidiaries. However, the legal protection is only positive significantly in traditional industry. Both basic manufacturing industry and technology intensive industry are insignificant. There are two possible explanations. First, the technology level in basic manufacturing industry and technology intensive industry is higher than it in traditional industry. is high, the local firms are not easy to imitate.. If the technology level. Second, the production line is divided into. upstream and downstream in basic manufacturing industry and technology intensive industry. The upstream, technical core, remains in Taiwan to be researched and developed. The downstream, labor intensive assignment, shifts to China to be completed. However, the technology gap between parent company and overseas subsidiaries in traditional industry is shorter.. The core competence is easier to be learned for local firm.. Thus, the overseas. subsidiaries of traditional industries should learn how to protect the core technology and avoid being imitated by local firms. The coefficient SIZE is significantly positive for all firms and three industries.. However,. the variable SIZESQ is significantly negative for all firms and three industries. The firm size is positively related to lnsale, but at a diminishing rate.. Firm size is positively related. to the growth rate of sales, which support our argument that the overseas subsidiaries have more total assets to achieve returns to scale. The negative coefficient of the quadratic term 35.
(41) implies that the effect appear at a diminishing rate. The coefficient RDI is significant negatively for all firms.. The possible explanation is. division between Taiwan and China. In general, the technical core remains in Taiwan to be researched and developed. The labor intensive assignment shifts China to be finished.. If. the overseas subsidiaries have higher degree on R&D, they do not regard sale as firms‟ goals. The product is less in proportion.. Hence, the RDI impact lnsale negatively.. RDI is expected to effect lnsale variously.. In addition,. The traditional industry and basic manufacturing. industry are insignificant because of the mixed results. In addition, the negative effect surpasses positive influence in technology intensive industry, so RDI is only negative significantly in the industry. The coefficient TEL is significantly positive for all firms. It implies that the province which has more telephone users can enhance the performance of overseas subsidiaries. However, the TEL is only positive significantly in traditional industry because the traditional industry is more labor intensive than other two industries, this may cause the coefficient TEL to be more important in traditional industry. Nevertheless, the coefficient TEL still has positive contribution in other two industries even they are insignificant.. The local. government should strengthen the development of telephone uses continuously. The coefficient WASTE is significantly positive for all firms and technology intensive industry. In general, the consumption wastes treated ratio will have positive contribution on performance of overseas subsidiaries.. However, because the consumption wastes produced. by technology intensive industry are treated difficultly they spent more cost to treat the technical wastes due to the properties of the wastes.. Thus, maybe the consumption wastes. treated ratio is more important to technology intensive industry.. If the local government can. improve local consumption wastes treated ratio, it will enhance the investment intention of parent company especially the technology intensive industry. 36.
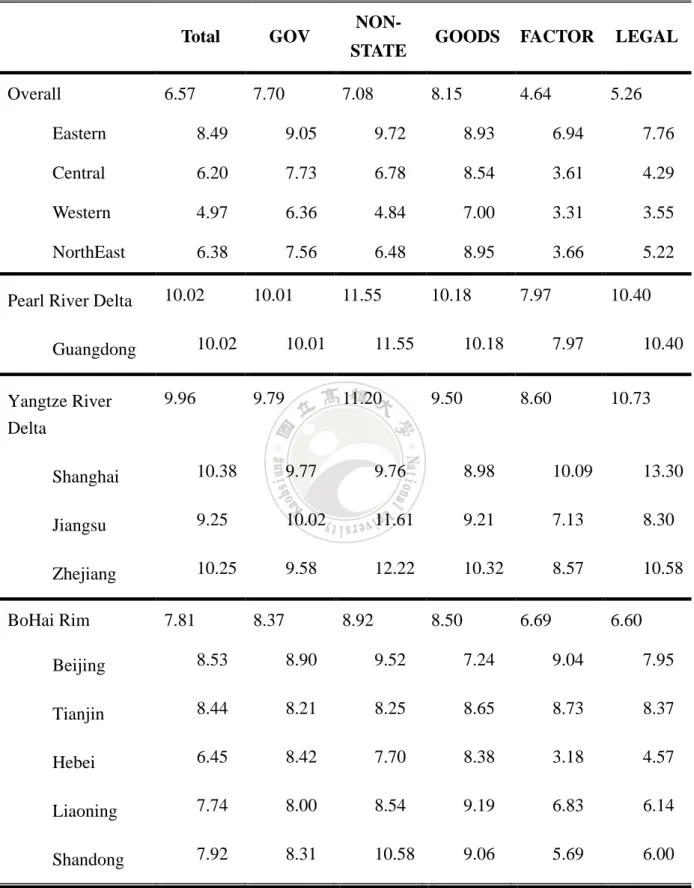
(42) The variable POWER is insignificantly for all firms and technology intensive industry. Because technology intensive industries have to operate all day, they prepare electric generator to cope with electric problem. Thus, local supplied electricity has little impact on technology intensive subsidiaries. basic manufacturing industry.. It is significant negatively in traditional industry and. There are two possible explanations. First, the traditional. industry does not operate all day, so they do not respect the electricity problem.. They may. take a short time to find a solution to the problem. Hence, the insufficient electricity has direct influence on traditional subsidiaries. Second, basic manufacturing industry includes steel industry, building materials industry, chemical industry which consumes high energy. They do not have the solution to cope with electric problem, the electric problem is serious for basic manufacturing industry.. Hence, overseas subsidiaries should be alert about. investing in province which has high electricity consumption if they need massive amounts of electricity to operate factories or businesses. This study aimed to discuss how market development influences the performance of the overseas subsidiaries of Taiwan in mainland China.. In general, the market development on. the performance of overseas subsidiaries is significantly positive. development can raise profitability of overseas subsidiaries.. A high market. The NERI INDEX of. marketization for China and three economic regions is presented in Table 5.. The results. indicated that the degree of market development in Eastern area is higher than other areas obviously. In addition, the degree of market development in Western area is lowest in China. The market development is concentrated in the Pearl River Delta, the Yangtze River Delta, and the BoHai Rim.. Market development in the three economic regions is higher than the. average of whole country. The degree of market development in the Pearl River Delta is higher than other two economic regions.. However, the three economic regions have 37.
(43) different advantage in each market development dimension.. In the Pearl River Delta, the. degree of factor market development is obviously lower than other dimensions.. The role of. local government, degree of non-state-owned economy, and degree of goods market development is the highest in three economic regions. In the Yangtze River Delta, the degree of factor market development and legal protection are the highest in three economic regions. In the BoHai Rim, the degree of factor market development and legal protection are lower than other dimensions. The legal protection is most important for traditional industry. The MNEs considered the Yangtze River Delta and the Pearl River Delta because they have higher degree of legal protection.. The degree of legal protection in the BoHai Rim is obviously low.. Yangtze River Delta is a good location for basic manufacturing industry.. The. Because the. degree of factor market development in the Pearl River Delta and the BoHai Rim is lower, it may reduce the performance of overseas subsidiaries for basic manufacturing industry. On the contrary, the Pearl River Delta and the BoHai Rim are good locations for technology intensive industry because the degree of factor market development has negative impact on the performance of overseas subsidiaries for technology intensive industry. The government of China should enhance the market development in order to absorb more FDI, especially from reducing the government intervention, expanding the non-state-owned economy, and strengthening the legal protection. According to the NERI INDEX of marketization, the market development in western area is the lowest in China. The China‟s government also can enhance the market development in western area in order to absorb more FDI in western provinces.. It may be a method to reduce the disparity of. economic development. In addition, China‟s government has to improve the infrastructure continuously, especially the electricity supplied.. 38.
(44) Table 5. NERI INDEX of marketization for China and Three Economic Regions. Total Overall. 6.57. GOV 7.70. NONSTATE 7.08. GOODS. FACTOR. LEGAL. 8.15. 4.64. 5.26. Eastern. 8.49. 9.05. 9.72. 8.93. 6.94. 7.76. Central. 6.20. 7.73. 6.78. 8.54. 3.61. 4.29. Western. 4.97. 6.36. 4.84. 7.00. 3.31. 3.55. NorthEast. 6.38. 7.56. 6.48. 8.95. 3.66. 5.22. Pearl River Delta. 10.02 10.02. Guangdong Yangtze River Delta. 10.01. 9.96. 11.55. 10.01 9.79. 10.18. 11.55 11.20. 7.97. 10.18 9.50. 10.40 7.97. 8.60. 10.40 10.73. Shanghai. 10.38. 9.77. 9.76. 8.98. 10.09. 13.30. Jiangsu. 9.25. 10.02. 11.61. 9.21. 7.13. 8.30. Zhejiang. 10.25. 9.58. 12.22. 10.32. 8.57. 10.58. BoHai Rim. 7.81. 8.37. 8.92. 8.50. 6.69. 6.60. Beijing. 8.53. 8.90. 9.52. 7.24. 9.04. 7.95. Tianjin. 8.44. 8.21. 8.25. 8.65. 8.73. 8.37. Hebei. 6.45. 8.42. 7.70. 8.38. 3.18. 4.57. Liaoning. 7.74. 8.00. 8.54. 9.19. 6.83. 6.14. Shandong. 7.92. 8.31. 10.58. 9.06. 5.69. 6.00. 39.
(45) Chapter 5 Conclusions and Suggestions Mainland China is the second-largest host of FDI in the world, next only to the US since 2009, and the largest developing country recipient of FDI since 1991.. China advocated the. progressive reform policy, and shifted China from a planned economy to a market economy. Many scholars believe that FDI plays an important role in the economic development of mainland China. investment.. Local governments were given more authority in attracting foreign. However, because China is vast geographically and due to the differences in the. implementation of government policies, the economic and market developments are greatly diversified within China.. This study proposes that the effects of the local market‟s. development on the operating performance of the overseas subsidiaries. The empirical results, based on the data obtained from the NERI INDEX of marketization, CCIS, TEJ, and China City statistical Yearbook over the period 2003-2007, showed that the low level of government intervention, high share of non-state-owned economy and well-developed legal protection are associated with a high performance of overseas subsidiaries. industries.. However, the market development has different influence on various. Other finding include:. (1) The development of factor market is positively. related to performance of overseas subsidiaries of basic manufacturing industry, yet it negatively related to technology intensive industry.. (2) Firm size, telephone users, and the. ratio of consumption wastes treated do positively influence overseas subsidiaries‟ performance, but firm size influences at a diminishing rate.. (3) The research and. development intensity do negatively affect the growth rate of sales of oversea subsidiaries. This study explores the influences of market development on the performance of the Taiwan‟s overseas subsidiaries in mainland China.. It is a direction to discuss the market. development in mainland China, but with other countries‟ subsidiaries as the focus of study. 40.
(46) Furthermore, it can compare the results between Taiwan‟s overseas subsidiaries and other countries‟ overseas subsidiaries in China.. In addition, it also can analyze the market. development based on the data of cross-countries.. In other words, the various degrees of. market developments between countries may influence the performance of overseas subsidiaries of same home country.. It can discuss whether the country with high market. development has more positive contribution on the performance of overseas subsidiaries.. 41.
(47) References Aharoni, Y., Maimon, Z. and Segev, E. (1978) „Performance and Autonomy in Organizations: Determining Dominant Environmental Components‟, Management Science 24: 949-959. Aitken, B. J. and Harrison, A. E. (1999) „Do Domestic Firms Benefit from Direct Foreign Investment? Evidence from Venezuela‟, American Economic Review 89: 605-618. Andersson, U., Forsgren, M. and Holm, U. (2002) „The Strategic Impact of External Networks: Subsidiary Performance and Competence Development in the Multinational Corporation‟, Strategic Management Journal 23: 979-996. Bandelj, N. (2002) „Embedded Economies: Social Relations as Determinants of Foreign Direct Investment in Central and Eastern Europe‟, Social Forces 81: 411-444. Barro, R. J. (1991) „Economic Growth in a Cross Section of Countries‟, Quarterly Journal of Economics 106: 404-443. Behrman, J. N. and Rondinelli, D. A. (2000) „The Transition to Market-Oriented Economies in Central and Eastern Europe: Lessons for Private Enterprise Development‟, European Business Journal 12: 87-99. Bevan, A. A. and Estrin, S. (2004) „The Determinants of Foreign Direct Investment into European Transition Economies‟, Journal of Comparative Economics 32: 775-787. Birkinshaw, J., Hood, N. and Young, S. (2005) „Subsidiary Enterpreneurship, Internal and External Competitive Forces, and Subsidiary Performance‟, International Business Review 14: 227-248. Blomström, M. and Kokko, A. (1996) „Multinational Corporations and Spillovers‟, Journal of Economic Surveys 12: 1-31. Borensztein, E., De Gregorio, J. and Lee, J. W. (1998) „How does Foreign Direct Investment Affect Economic Growth?‟, Journal of International Economics 45: 115-135. Broadman, H. G. and Sun, X. (1997) „The Distribution of Foreign Direct Investment in China‟, The World Economy 20: 339-361. Buckley, P. J. and Casson, M. C. (1976) The Future of the Multinational Enterprise, Macmillan: London. Buckley, P. J., Clegg, J. and Wang, C. (2002) „The Impact of Inward FDI on the Performance of Chinese Manufacturing Firms‟, Journal of International Business Studies 33: 637-655. 42.
(48) Buckley, P. J. and Pearce, R. D. (1979) „Overseas Production and Exporting by the World's Largest Enterprise: A Study in Sourcing Policy‟, Journal of International Business Studies 10: 9-20. Campos, N. and Kinoshita, Y. (2003) „Why Does FDI GO Where It Goes? New Evidence from the Transitional Economies‟, IMF Working Paper. Chang, S. J. and Hong, J. (2000) „Economic Performance of Group-Affiliated Companies in Korea: Intragroup Resource Sharing and Internal Business Transactions‟, Academy of Management Journal 43: 429-448. Chen, C., Chang, L. and Zhang, Y. (1995) „The Role of Foreign Direct Investment in China's Post-1978 Economic Development‟, World Development 23: 691-703. Chen, H. and Chen, T. J. (1998) „Network Linkages and Location Choice in Foreign Direct Investment‟, Journal of International Business Studies 29: 445-467. Chen, J. and Fleisher, B. M. (1996) „Regional Income Inequality and Economic Growth in China‟, Journal of Comparative Economics 22: 141-164. Chen, T. J. (1992) „Determinants of Taiwan's Direct Foreign Investment: The Case of a Newly Industrializing Country‟, Journal of Development Economics 39: 397-407. Cheng, L. K. and Kwan, Y. K. (2000) „What Are the Determinants of the location of Foreign Direct Investment? The Chinese Experience‟, Journal of International Economics 51: 379-400. Cheung, K. Y. and Lin, P. (2004) „Spillover Effects of FDI on Innovation in China: Evidence from the Provincial Data‟, China Economic Review 15: 25-44. Delios, A., Xu, D. and Beamish, P. W. (2008) „Within-Country Product Diversification and Foreign Subsidiary Performance‟, Journal of International Business Studies 39: 706-724. Dow, D. and Karunaratna, A. (2006) „Developing A Multidimensional Instrument to Measure Psychic Distance Stimuli‟, Journal of International Business Studies, 37: 578-602. Dunning, J. H. (1993) Multinational Enterprises and Global Economy, Addison-Wesley: Harlow. Dunning, J. H. (2001) „The Key Literature on IB Activities: 1960-2000‟, in A.M. Rugman and T.L. Brewer (eds.). The Oxford Handbook of International Business, Oxford University Press: New York, pp. 36-68. Dunning, J. H. (2002) Global Capitalism, FDI and competitiveness, Edward Elgar: Cheltenham. 43.
數據

+5
相關文件
volume suppressed mass: (TeV) 2 /M P ∼ 10 −4 eV → mm range can be experimentally tested for any number of extra dimensions - Light U(1) gauge bosons: no derivative couplings. =>
For pedagogical purposes, let us start consideration from a simple one-dimensional (1D) system, where electrons are confined to a chain parallel to the x axis. As it is well known
The observed small neutrino masses strongly suggest the presence of super heavy Majorana neutrinos N. Out-of-thermal equilibrium processes may be easily realized around the
Define instead the imaginary.. potential, magnetic field, lattice…) Dirac-BdG Hamiltonian:. with small, and matrix
incapable to extract any quantities from QCD, nor to tackle the most interesting physics, namely, the spontaneously chiral symmetry breaking and the color confinement..
(1) Determine a hypersurface on which matching condition is given.. (2) Determine a
• Formation of massive primordial stars as origin of objects in the early universe. • Supernova explosions might be visible to the most
Master Taixu has always thought of Buddhist arts as important, the need to protect Buddhist arts, and using different forms of method to propagate the Buddha's teachings.. However,
