Disparate Mesenchyme-Lineage Tendencies in Mesenchymal
Stem Cells from Human Bone Marrow and Umbilical
Cord Blood
Y
U-J
ENC
HANG,
a,bD
ANIELT
ZU-
BIS
HIH,
c,dC
HING-P
INGT
SENG,
bT
ZU-B
OUH
SIEH,
aD
ON-C
HINGL
EE,
cS
HIAW-M
INH
WANGaa
Bioresource Collection and Research Center, Food Industry Research and Development Institute, Hsinchu, Taiwan;
b
Department of Biological Science and Technology, National Chiao Tung University, Hsinchu, Taiwan;
cCenter for
Stem Cell Research and
dGraduate Institute of Cell and Molecular Biology, Taipei Medical University,
Taipei, Taiwan
Key Words. Mesenchymal stem cells • Differentiation • Leptin
A
BSTRACTBone marrow and umbilical cord blood are reported to be the main sources of mesenchymal stem cells (MSCs), which have been proposed for many clinical applications. This study evaluated and quantitated the differentiation potential of bone marrow– derived MSCs (bmMSCs) and cord blood– derived MSCs (cbMSCs) by in vitro induction. Results in-dicated that cbMSCs had a significantly stronger osteogenic potential but lower capacity for adipogenic differentiation than bmMSCs. Leptin, an important regulator of mesenchy-mal differentiation, has a significantly stronger effect of pro-moting osteogenesis and inhibiting adipogenesis in bmMSCs
than in cbMSCs. Moreover, Cbfa1 mRNA expression in bmMSCs and cbMSCs was affected to different degrees by leptin during osteogenesis. In contrast, leptin reduced PPAR␥2 mRNA expression to the same level during adi-pogenesis in both types of MSCs. These results demon-strate the disparate capacities of MSCs from bone mar-row and cord blood and suggest that they be used differently in experimental and therapeutic studies. In addition, the disparate differentiation tendencies of MSCs from different sources should be considered in further applications. STEMCELLS2006;24:679 – 685
I
NTRODUCTIONMesenchymal stem cells (MSCs) are known to have the capacity for self-renewal and differentiation into mesen-chyme-lineage cell types, including osteoblasts, adipocytes, chondrocytes, and myoblasts. The isolation and culture of MSCs, first described in the 1970s, from bone marrow were achieved using adherence to a plastic substratum and in vitro expansion [1]. The selective differentiation of MSCs in vitro depends on specific environmental cues, usually a combina-tion of induccombina-tion chemicals, growth factors, and cytokines. Currently, MSCs can be isolated from various human sources, including bone marrow, umbilical cord blood, adi-pose tissue, and muscle [2, 3]. MSCs have become a major cellular source in several areas of developmental research. They are multipotent precursors with low variability from different donors [4]. However, the differences among MSCs isolated from different tissues are still unclear.
Leptin, a 16-kDa peptide hormone discovered in 1994, is an adipocyte-derived signaling molecule that regulates food intake and increases energy expenditure using specific receptors in the hypothalamus [5, 6]. In adults, leptin is secreted mainly by white adipose tissue into the circulation [5]. Moreover, leptin has also been found to be synthesized and secreted from placental tro-phoblasts into the maternal and fetal circulation in pregnant women [7]. Current evidence suggests that leptin can affect the function of mesenchyme-lineage cells, such as muscle cells [8], chondrocytes [9], osteoblasts [10], and adipocytes [11]. How-ever, it is still unknown if MSCs are the targets of leptin.
Although the immunophenotypic profiles of MSCs from different sources are very similar [2, 3], knowing if these MSCs express quantitative differences in differentiation potentials is important. To investigate the difference in the functional spec-ificity of osteogenesis and adipogenesis between different sources of MSCs, human bone marrow– derived MSCs Correspondence: Shiaw-Min Hwang, Ph.D., Bioresource Collection and Research Center, Food Industry Research and Development Institute, Hsinchu, Taiwan. Telephone: 886-3-522-3191; Fax: 886-3-521-4016; e-mail: hsm@firdi.org.tw Received November 8, 2004; accepted for publication September 12, 2005; first published online in STEMCELLSEXPRESSSeptember 22, 2005. ©AlphaMed Press 1066-5099/2006/$20.00/0 doi: 10.1634/stemcells.2004-0308
(bmMSCs) and umbilical cord blood– derived MSCs (cbMSCs) were compared. Differences in differentiation potentials in os-teogenesis and adipogenesis were detected under the same in-duction conditions. Interestingly, cbMSCs exhibit a signifi-cantly stronger osteogenic potential but lower adipogenic capacity than bmMSCs. Leptin was found to directly affect the mesenchyme-lineage differentiation potentials of both types of MSCs tested. Data from our study suggest that the diverse functional potentials of MSCs from different sources should play an important role in their further applications.
M
ATERIALS ANDM
ETHODSEstablishment of MSCs from Human Bone Marrow
and Cord Blood
Term umbilical cord blood (UCB) of newborns was harvested into a standard 250-ml blood bag containing citrate-phosphate-dextrose-adenine anticoagulant (Terumo; Tokyo, Japan; http:// www.terumomedical.com) with the mother’s informed consent. Cord blood samples were processed within 24 hours. Buffy coat was obtained from UCB by centrifugation (700 ⫻ g for 20 minutes) and diluted with an equal volume of wash buffer (Dulbecco’s phosphate-buffered saline [PBS]; Sigma; St. Louis; http://www.sigmaaldrich.com). The buffy coat cells were then layered onto Ficoll-Paque solution (1.077 g/ml; Amersham; Uppsala, Sweden; http://www.amershambiosciences.com) and centrifuged to deplete the residues of red blood cells, platelets, and plasma (700⫻ g for 40 minutes). Cord blood mononuclear cells (MNCs) in the interface were collected and washed twice with PBS. Human adult bone marrow MNCs were fresh col-lected (one male, 19 years old; one female, 37 years old) by Ficoll-Paque density centrifugation or supplied by Cambrex Co. (two males, 19 years and 30 years old; one female, 31 years old) (Walkersville, MD; http://www.cambrex.com). For the frozen MNCs supplied by Cambrex, cells were washed twice with culture medium immediately after being thawed. Both bmMNCs and cbMNCs were seeded at a concentration of 106cells/cm2in
alpha-modified minimum essential medium (␣-MEM; Hyclone; Logan, UT; http://www.hyclone.com), containing 20% fetal bo-vine serum (FBS; Hyclone), 4 ng/ml basic fibroblast growth factor (R&D Systems; Minneapolis; http://www.rndsystems. com), 100 units/ml penicillin, and 100 g/ml streptomycin (Sigma), and cultured at 37°C in a humidified atmosphere with 5% CO2. The nonadherent cells were removed using a medium change after 3 days of seeding, and the medium was changed twice a week thereafter for 2–3 weeks. When well-developed colonies of fibroblast-like cells appeared, cells were washed with PBS, harvested with 0.05% trypsin-EDTA (Sigma) and passed into new T75 flasks. This protocol was approved by the Institutional Review Board of Taipei Med-ical University, Taiwan.
Immunophenotyping of MSCs
Cells at passage four were trypsinized, washed, and resuspended in PBS at a concentration of about 100,000 cells/ml. After fixing with 1% methanol at 4°C for 10 minutes, cells were blocked in 1% bovine serum albumin (BSA; Sigma) plus 0.1% FBS for 1 hour at room temperature, then washed with three volumes of PBS. The cell pellet was resuspended in 0.5 ml of primary antibody solution containing 1% BSA plus 0.1% FBS for 40
minutes at 4°C, then washed three times in PBS. Cells were immunolabeled with the following mouse anti-human antibod-ies: CD34, CD45 (Miltenyi Biotech; Auburn, CA; http://www. miltenyibiotec.com), SH2, SH3, and SH4 (culture supernatants obtained from hybridoma cells; American Type Culture Collec-tion; Manassas, VA; http://www.atcc.org). The nonspecific mouse IgG (Vector; Burlingame, CA; http://www.vectorlabs. com) was substituted for the primary antibodies as an isotype control. The secondary antibody, anti-mouse IgG-fluorescein isothiocyanate (FITC) or IgG-phycoerythrin (PE) (Vector), was incubated with cells for 20 minutes at 4°C in the dark. The cells were then washed with PBS and resuspended in 1 ml of PBS for analysis. Data were analyzed using the fluorescence-activated cell sorter (FACS) FACSscan flow cytometer (Becton, Dickin-son and Company; San Jose, CA; http://www.bd.com) with a minimum of 30,000 events.
Osteogenic and Adipogenic Differentiation
MSCs established from bone marrow and cord blood were seeded at about 7⫻ 103cells/cm2into six-well plates and grown
to confluence. To induce osteogenic differentiation, cells were incubated in ␣-MEM supplemented with 10% FBS, 0.1 M dexamethasone (Sigma), 10 mM-glycerolphosphate (Sigma), and 50 M ascorbic acid (Sigma) for 3 weeks. To initiate adipogenic differentiation, cells were incubated in␣-MEM sup-plemented with 10% FBS, 1M dexamethasone (Sigma), 0.5 mM methyl-isobutylxanthine (Sigma), 10g/ml insulin (Gibco-BRL; Carlsbad, CA; http://www.lifetech.com), and 100 M indomethacin (Sigma) for 3–5 weeks. To assay the effect of leptin on osteogenic and adipogenic differentiation, human re-combinant leptin (PeproTech; London, U.K.; http://www. peprotech.com) was added, at concentrations of 0.6 and 1.5 g/ml, to each differentiation medium. After 3 weeks of culture, cells were analyzed for osteogenic and adipogenic features. Three replicates were tested for each sample.
Quantification and Detection of Osteogenic and
Adipogenic Differentiation Potential
Cells were analyzed for alkaline phosphatase (ALPase) activity and Alizarin Red S staining (Sigma) to assess their osteogenic differentiation. ALPase activity was assayed following the man-ufacturer’s instruction (Sigma). Briefly, 1 ml of 0.05 N NaOH in ethanol was added to each well after ALPase activity stain [12]. The extraction was measured spectrophotometrically at 550 nm. The amount of ALPase activity was represented as a ratio compared with that of the undifferentiated cells. To quantify calcium deposition, cells were washed with PBS and incubated with 2% Alizarin Red S solution (preadjusted to a pH of 5.5 with 0.5% NH4OH) for 5 minutes [12]. After PBS washing, 1 ml
phosphate buffer (8 mM Na2HPO4⫹ 1.5 mM KH2PO4) con-taining 10% cetylpyoidimium chloride (Sigma) was added and incubated overnight. The extracted solution of cell-bound Al-izarin Red S was measured spectrophotometrically at 550 nm and compared with a standard titration curve [12].
Adipogenic differentiation was assessed by Oil Red O (Sigma) staining for 15 minutes at room temperature. After-ward, cells were washed completely with 60% isopropanol (Sigma), and 1 ml ethanol was added to each well to extract the cell-bound Oil Red O. The amount of Oil Red O released was determined spectrophotometrically at 550 nm with a reference
of 650 nm and compared with an Oil Red O standard titration curve [12]. The extraction of cell-bound Alizarin Red S and Oil Red O was normalized to the average cell number at the time of dye extraction. A panel of wells was trypsinized in parallel to count the number of cells.
Measurement of mRNA Level by Real-Time
Polymerase Chain Reaction
Total RNA from each sample was isolated using Trizol reagent (MRC; Cincinnati, OH, http://www.mrcgene.com/tri.htm) fol-lowing the manufacturer’s instructions. Complementary DNA (cDNA) was synthesized from 1g total RNA using ImPro-II reverse transcriptase (Promega; Madison, WI; http://www. promega.com) with oligo-dT primer in 20l reaction mixture. The relative expression level of-actin was used as an internal control to normalize specific gene expression in each sample. Real-time polymerase chain reaction (PCR) using the ABI Prism 7000 Sequence Detection System (Applied Biosystems; Foster City, CA; http://www.appliedbiosystems.com) was per-formed with 2 l of the single-stranded cDNA sample with SYBR Green PCR master mix (Applied Biosystems). The rel-ative quantitation of marker genes (Table 1) was performed according to the ‚‚Ct method, as described elsewhere [13].
Statistical Analysis
The results of quantification of ALPase activities, the extracted cell-bound Alizarin Red S and Oil Red O, and gene expression by real-time PCR are presented as mean⫾ standard deviation (SD). Comparisons between experimental groups and the con-trol were made using the Student’s t-test. Differences were considered statistically significant at p⬍ .05.
R
ESULTSEstablishment of MSCs from Bone Marrow and
Cord Blood
Both bone marrow and cord blood MNCs were seeded at a concentration of 1⫻ 106cells/cm2, and the nonadherent
hema-topoietic cells were removed by decanting the medium. Two weeks after the first seeding, colonies of adherent cells with elongated fibroblast-like morphology, a characteristic feature of MSCs, were observed in culture. When the cells grew to con-fluence, they were trypsinized and passaged with a ratio of 1:4 split. Initially, colonies from cord blood established more slowly than those from bone marrow under the same seeding and culture conditions, with the former taking 1–2 weeks longer. The frequency of colony-forming unit-fibroblast (CFU-F) for-mation in cbMSCs was also markedly lower than that in bmMSCs by about one tenth. However, after MSC culture estab-lishment, cbMSCs had a shorter population doubling time (PD),
28⫾ 3 hours (n ⫽ 5), than bmMSCs, 34 ⫾ 3 hours (n ⫽ 5). We established five different bmMSC populations (three males and two females), one from each of our three frozen and two fresh bone marrow samples, but only five different cbMSCs (two males and three females) from 10 cord blood samples. After primary culture, MSCs derived from these two sources repre-sented a morphologically homogeneous fibroblast-like popula-tion (Fig. 1). FACS analysis was used to characterize cell surface markers on bmMSCs and cbMSCs at passage 4. As shown in Figure 2, two typical profiles from bmMSCs and cbMSCs exhibited similar immunophenotypes, which were neg-ative for CD34 (a hematopoietic stem cell marker) and CD45 (leukocyte common antigen) and positive for the mesenchymal progenitor–specific markers SH2, SH3, and SH4. These data are consistent with previous reports [3, 14].
Osteogenesis and Adipogenesis of bmMSCs
and cbMSCs
To assay the differentiation potentials of MSCs along the mes-enchyme lineage, confluent cultures of both types of MSC were exposed to osteogenic and adipogenic induction media. In the osteogenic induction medium, both bmMSCs and cbMSCs dif-ferentiated into osteoblasts. However, the osteogenic differenti-ation potential differed significantly between these two types of MSCs. cbMSCs generated a large amount of mineral nodules within 1 week and increased continuously thereafter. More than 60% mineral accumulation was observed after 1 week of osteo-genic culture of cbMSCs (Fig. 3A). After 3 weeks in culture, cbMSCs fully differentiated into osteoblasts. Comparatively, bmMSCs showed a relatively lower osteogenic tendency; only about 20% of the bmMSCs produced mineral nodules after 1 week of osteogenic induction and about 60% osteoblasts were found after 3 weeks of culture. The difference in the osteogenic differentiation capacity between cbMSCs and bmMSCs was further examined by Alizarin Red S staining and ALPase activ-ity analysis (Fig. 3A). The amounts of Alizarin Red S and ALPase activity were 6.9-fold and 2.7-fold greater for cbMSCs than for bmMSCs in osteogenic culture, respectively (data not shown).
In contrast, bmMSCs exhibited a significantly stronger ca-pacity for adipogenic induction than cbMSCs. Neutral lipid droplets appeared in the cytoplasm of bmMSCs in the first week, and the amount and volume of lipid droplets increased dramatically. The lipid droplet– containing cells accounted for more than 80% of the induced bmMSC culture at week 3. In contrast, typical lipid droplets were rarely present in the cbMSC adipogenic culture, even when the induction period was ex-tended to 5 weeks. The induction of adipogenesis in cbMSCs resulted in⬍5% Oil Red O–positive cells found in the culture, Table 1. Marker genes used in real-time polymerase chain reaction
Gene Accession number Primer sequence (5ⴕ 3 3ⴕ)
-actin NM001101 Forward: TGTGGATCAGCAAGCAGGAGTA
Reverse: CAAGAAAGGGTGTAACGCAACTAAG
Cbfa1 NM004348 Forward: CATGGCGGGTAACGATGAA Reverse: CGGCCCACAAATCTCAGATC
PPAR␥2 NM138712 Forward: CCAGAAAATGACAGACCTCAGACA
Reverse: GCAGGAGCGGGTGAAGACT
and the size of lipid droplets was also smaller than that found in the bmMSC adipogenic culture (Fig. 3B).
The adipogenic induction protocol used in this study dem-onstrated that bmMSCs had a markedly greater adipogenic tendency than cbMSCs. The amount of cell-bound Oil Red O in bmMSC adipogenic cultures was 17.3-fold higher than that found in cbMSC adipogenic cultures (data not shown).
Effects of Leptin on Osteogenesis and Adipogenesis
Leptin has been demonstrated to be an important factor in regulating bone and fat formation in humans [10, 11]. To
evaluate whether leptin could affect the differentiation of MSCs in vitro, recombinant human leptin was added in combination with the differentiation media. After 3 weeks, osteogenesis was significantly enhanced by leptin in both bmMSCs and cbMSCs. Mineralization was estimated by the amount of cell-bound Al-izarin Red S (Fig. 4A). The effect of leptin in increasing osteo-genesis was also confirmed by ALPase activity staining (Fig. 4B). Interestingly, a dose-dependent enhancement of osteogen-esis by leptin was only found in bmMSCs. bmMSCs treated with 0.6g/ml and 1.5 g/ml of leptin had mineral accumula-tion levels that were 73% and 144% greater, respectively. The ALPase activity staining ratios were also 36% and 51% greater, respectively. However, treatment of cbMSCs with 0.6g/ml of leptin resulted in only a 25% greater mineral accumulation and a 13% greater ALPase activity staining ratio. Increasing the leptin concentration to 1.5g/ml had no effect; the leptin effect was seemingly saturated at the lower level, according to the analysis of mineral accumulation and ALPase activity staining in cbMSCs. These results indicate that leptin had a relatively stronger osteogenesis promoting effect in bmMSCs than in cbMSCs, although the osteogenic capacity of bmMSCs was still much lower than that of cbMSCs under leptin treatment.
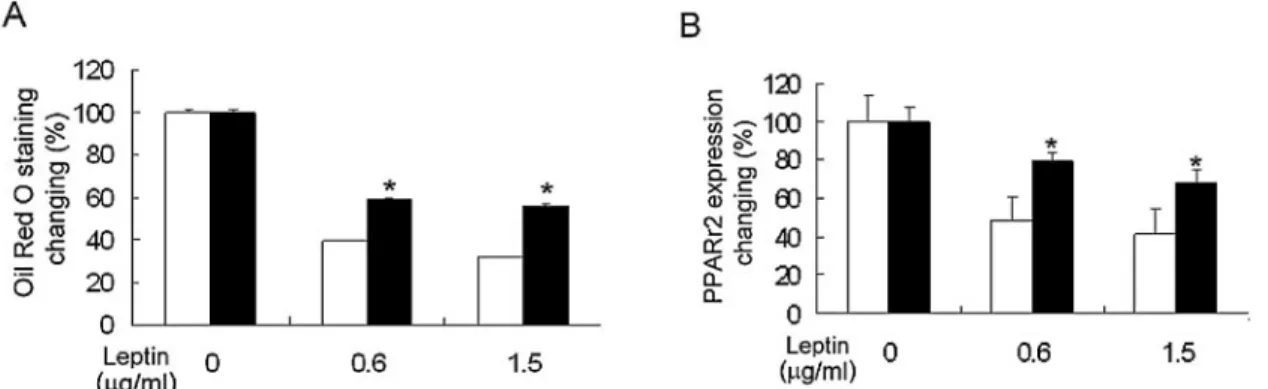
The adipogenic effect of leptin on both types of MSC was also compared, as shown in Figure 5A. Leptin significantly reduced adipogenesis in both bmMSCs and cbMSCs, as as-sessed by Oil Red O staining. When leptin was incorporated into the adipogenic media, both types of MSC yielded a lower number of lipid droplets. The accumulation of cell-bound Oil Figure 2. Fluorescence-activated cell sorter (FACS) analysis of
undif-ferentiated human bone marrow– derived mesenchymal stem cells (bmMSCs) (A) and cord blood– derived MSCs (cbMSCs) (B) at passage 4. A homogeneous confluent monolayer of MSCs was trypsinized and analyzed by staining with various antibodies. Both bmMSCs and cbM-SCs lacked the expression of CD34 and CD45 and expressed SH2, SH3, and SH4. The respective isotype control is shown as the dotted line. Abbreviations: FITC, fluorescein isothiocyanate; FSC, forward scatter; PE, phycoerythrin; SSC, side scatter.
Figure 1. Morphology of cultured human mesenchymal stem cells (MSCs). Typical phase-contrast images of bone marrow– derived MSCs (A) and cord blood– derived MSCs (B) showed a fibroblast-like homo-geneous phenotype. Scale bars⫽ 100m.
Figure 3. Osteogenic and adipogenic capabilities of bone marrow– derived mesenchymal stem cells (bmMSCs) and cord blood– derived MSCs (cbMSCs). Cells were incubated in osteogenic or adipogenic medium for 3 weeks after confluence. Osteogenic capability was imaged at week 1 and week 3 and characterized by alkaline phosphatase (AL-Pase) activity and Alizarin Red S staining after 3 weeks’ induction (A). Adipogenic capability was imaged at week 1 and week 3, and lipid droplet accumulation was detected by staining with Oil Red O after 3 weeks induction (B). The pictures taken from each culture condition are representative of the entire culture dish.
Red O was 61% and 68% lower in bmMSCs under treatment with 0.6g/ml and 1.5 g/ml of leptin, respectively, whereas the cell-bound Oil Red O was 41% and 44% lower in cbMSCs
under the same conditions. These results indicate that leptin had a relatively stronger suppressive effect on adipogenesis in bmMSCs than in cbMSCs, although the accumulated oil was still much higher in bmMSCs than cbMSCs under leptin treat-ment.
Leptin Effects on Osteogenic (Cbfa1) and
Adipogenic (PPAR
␥2) Transcription
Because leptin influenced the differentiation potentials of both types of MSC, we further quantitated the gene expression of mesenchyme-lineage transcription factors in osteogenesis and adipogenesis using real-time PCR analysis. Cbfa1 and PPAR␥2 are the major transcription factors for early osteogenesis and adipogenesis respectively.
Consistent with the Alizarin Red S staining and ALPase activity assay, leptin produced a dose-dependent increase in Cbfa1 expression during osteogenesis only in bmMSCs. Cbfa1 mRNA expression was 2.0-fold and 3.2-fold greater in bmMSCs under the 0.6 g/ml and 1.5 g/ml leptin treatments, respec-tively, at the first week of osteogenesis, while it was only 1.2-fold and 1.3-fold greater in cbMSCs under the same condi-tions (Fig. 4C).
During adipogenic induction, PPAR␥2 mRNA expression levels in bmMSCs treated with 0.6g/ml and 1.5 g/ml leptin supplementation were only 48% and 41% of the levels observed without leptin treatment, respectively (Fig. 5B). In cbMSCs, the corresponding PPAR␥2 mRNA expression levels were 79% and 68% of the level seen without leptin supplementation, respec-tively. These results confirm that bmMSCs were significantly more sensitive to leptin than cbMSCs in osteogenic promotion and adipogenic suppression.
D
ISCUSSIONMSCs play a vital role in cell regeneration and the repair of damaged tissues in human growth. The ease of culturing and expanding MSCs ex vivo has recently spurred numerous ther-apeutic applications and clinical trials [3]. MSCs have also been used as developmental models for osteogenesis and adipogen-esis [15, 16]. MSCs isolated by different methods were reported to be similar, without much variation in their differentiation potentials [17]. Currently, the two main sources of human MSCs are bone marrow and umbilical cord blood. Moreover, MSCs from these two different sources possess similar surface marker profiles [2, 3]. Each MSCs sample from bone marrow (n⫽ 5) and cord blood (n ⫽ 5) in this study exhibited the typical fibroblast-like morphology and the same immunophenotypes of MSCs—positive for the mesenchymal-specific markers SH2, SH3, and SH4 and negative for the hematopoietic-specific markers CD34 and CD45. We also observed that cbMSCs proliferated faster (PD, 28⫾ 3 hours) than bmMSCs (PD, 34 ⫾ 3 hours), which is in agreement with what is known regarding fetuses versus adults. The average telomere length of cbMSCs was significantly longer than that of bmMSCs, 12.0 kb versus 10.0 kb, both at passage 4, respectively (data not shown). Moreover, we didn’t find any differences between bmMSCs established from frozen or fresh bone marrow.
At the same developmental stage, however, MSCs isolated from different tissues might exhibit diverse differentiation ca-pacities. For example, MSCs isolated from different fetal tissues during the second trimester showed diverse adipogenic and Figure 4. Comparison of leptin effect on osteogenic differentiation of
mesenchymal stem cells (MSCs). Bone marrow– derived MSCs (bmMSCs) and cord-blood– derived MSCs (cbMSCs) were exposed to osteogenic medium containing 0, 0.6, or 1.5g/ml of leptin. Leptin enhanced osteogenic potential in both types of MSCs as assessed by staining with Alizarin Red S (A) and by alkaline phosphatase (ALPase) activity (B) after 3 weeks of induction. Expression of the early osteo-genic transcription factor Cbfa1 was detected using real-time polymer-ase chain reaction after 1 week of induction (C). Results are represented as the percentage of the corresponding no leptin treatment and expressed as the mean⫾ standard deviation of three replicates of bmMSCs (n ⫽ 5) and cbMSCs (n⫽ 5). 䡺, bmMSCs; f, cbMSCs. * indicates statis-tically significant difference (p⬍ 0.05) versus bmMSCs under the same conditions.
osteogenic differentiation potentials [12]. The adipogenic capac-ity was markedly lower, but the osteogenic capaccapac-ity was higher, in the MSCs derived from fetal spleen than from bone marrow, liver, or lung [12]. Bieback et al. [18] also reported a higher adipogenic potential in bmMSC clones than cbMSC clones. Thus, do MSCs from adult bone marrow and postnatal cord blood possess different differentiation tendencies? In this study, cbMSCs displayed an apparently higher tendency to undergo osteogenesis than bmMSCs did. During osteogenic differentia-tion, osteoblasts exhibited strong ALPase activity, followed by matrix maturation and then transition into the matrix mineral-ization period [19]. cbMSCs accumulated much more mineral nodules and expressed higher ALPase activity than bmMSCs under the same osteogenic induction conditions. In contrast, bmMSCs had more lipid droplet– containing cells than cbMSCs during adipogenesis. These findings indicate that cbMSCs have a stronger osteogenic potential but much lower adipogenic ca-pacity than bmMSCs.
Although leptin has emerged as a potential contributor to bone turnover and fat mass, its effects on bone metabolism remain unclear. Some in vivo evidence has revealed that reduc-ing the serum leptin level or the expression level of functional leptin receptor increases bone mass [20, 21]. Conversely, leptin has also been reported to have many positive effects on osteo-blasts, by increasing cell proliferation, differentiation, and bone mineralization [10, 22]. Leptin also acts on muscle cells and chondrocytes in vitro [8, 9]. Not surprisingly, these cells are all derived from mesenchymal stem cells. Thomas et al. [23] re-ported that leptin could enhance osteogenesis and inhibit adi-pogenesis in hMS-12 cells, a conditionally immortalized human marrow stromal cell line. Our data demonstrate, for the first
time, that leptin can act directly on primary MSCs to regulate mesenchyme-lineage differentiation in vitro, including promot-ing osteogenesis and suppresspromot-ing adipogenesis. Moreover, bmMSCs are more sensitive to leptin than cbMSCs in both osteogenesis and adipogenesis. Because of the high leptin ex-pression levels in human bone marrow adipocytes [24], leptin may serve as an endocrine modulator of MSC differentiation. These in vitro studies may be relevant to the clinical observation that obesity is associated with greater bone mineral density [25]. Our real-time PCR data are in agreement with the observa-tion that osteogenesis and adipogenesis are activated by the transcriptional regulators Cbfa1 and PPAR␥2, respectively [26]. Leptin consistently showed a dose-dependent upregulation of Cbfa1 expression and downregulation of PPAR␥2 expression in bmMSCs during osteogenesis and adipogenesis, while leptin had only a slight effect on cbMSCs.
In conclusion, our data indicate that bmMSCs and cbMSCs possess heterogeneous differentiation potentials and different responses to leptin in vitro. These disparate characteristics of tissue-derived MSCs from different sources should be consid-ered to better apply MSCs in vivo.
A
CKNOWLEDGMENTSThis work was supported by grants from the Ministry of Eco-nomic Affairs, Taiwan (93-EC-17-A-R7– 0525) and the Food Industry Research and Development Institute, Taiwan (FIRDI 04A006).
D
ISCLOSURESThe authors indicate no potential conflicts of interest.
R
EFERENCES1 Friedenstein AJ, Gorskaja JF, Kulagina NN. Fibroblast precursors in normal and irradiated mouse hematopoietic organs. Exp Hematol 1976; 4:267–274.
2 Minguell JJ, Erices A, Conget P. Mesenchymal stem cells. Exp Biol Med (Maywood) 2001;226:507–520.
3 Tocci A, Forte L. Mesenchymal stem cell: Use and perspectives. Hema-tol J 2003;4:92–96.
4 Pittenger MF, Mackay AM, Beck SC et al. Multilineage potential of adult human mesenchymal stem cells. Science 1999;284:143–147. 5 Zhang Y, Proenca R, Maffei M et al. Positional cloning of the mouse
obese gene and its human homologue. Nature 1994;372:425– 432. 6 Rosenbaum M, Leibel RL, Hirsch J. Obesity. N Engl J Med 1997;337:
396 – 407.
7 Hassink SG, de Lancey E, Sheslow DV et al. Placental leptin: An
Figure 5. Comparison of the effect of leptin on adipogenic differentiation of mesenchymal stem cells (MSCs). Bone marrow– derived MSCs (bmMSCs) and cord-blood– derived MSCs (cbMSCs) were exposed to adipogenic medium containing 0, 0.6, or 1.5g/ml of leptin. Leptin suppressed adipogenesis in both bmMSCs and cbMSCs as assessed by staining Oil Red O staining after 3 weeks of induction (A). Expression of the adipogenic transcription factor PPAR␥2 was detected using real-time polymerase chain reaction after 3 weeks of induction (B). Results are represented as the percentage of the corresponding no leptin treatment and expressed as the mean⫾ standard deviation of three replicates of bmMSCs (n ⫽ 5) and cbMSCs (n⫽ 5). 䡺, bmMSCs; f, cbMSCs. * indicates statistically significant difference (p ⬍ 0.05) versus bmMSCs under the same conditions.
important new growth factor in intrauterine and neonatal development? Pediatrics 1997;100:E11–E16.
8 Liu YL, Emilsson V, Cawthorne MA. Leptin inhibits glycogen synthesis in the isolated soleus muscle of obese (ob/ob) mice. FEBS Lett 1997; 411:351–355.
9 Nakajima R, Inada H, Koike T et al. Effects of leptin to cultured growth plate chondrocytes. Horm Res 2003;60:91–98.
10 Reseland JE, Syversen U, Bakke I et al. Leptin is expressed in and secreted from primary cultures of human osteoblasts and promotes bone mineralization. J Bone Miner Res 2001;16:1426 –1433.
11 Bai Y, Zhang S, Kim KS et al. Obese gene expression alters the ability of 30A5 preadipocytes to respond to lipogenic hormones. J Biol Chem 1996;271:13939 –13942.
12 in ’t Anker PS, Noort WA, Scherjon SA et al. Mesenchymal stem cells in human second-trimester bone marrow, liver, lung, and spleen exhibit a similar immunophenotype but a heterogeneous multilineage differen-tiation potential. Haematologica 2003;88:845– 852.
13 Winer J, Jung CK, Shackel I et al. Development and validation of real-time quantitative reverse transcriptase-polymerase chain reaction for monitoring gene expression in cardiac myocytes in vitro. Anal Biochem 1999;270:41– 49.
14 Erices A, Conget P, Minguell JJ. Mesenchymal progenitor cells in human umbilical cord blood. Br J Haematol 2000;109:235–242.
15 Jaiswal N, Haynesworth SE, Caplan AI et al. Osteogenic differentiation of purified, culture-expanded human mesenchymal stem cells in vitro. J Cell Biochem 1997;64:295–312.
16 Janderova L, McNeil M, Murrell AN et al. Human mesenchymal stem cells as an in vitro model for human adipogenesis. Obes Res 2003;11: 65–74.
17 Lodie TA, Blickarz CE, Devarakonda TJ et al. Systematic analysis of reportedly distinct populations of multipotent bone marrow-derived stem cells reveals a lack of distinction. Tissue Eng 2002;8:739 –751. 18 Bieback K, Kern S, Kluter H et al. Critical parameters for the isolation
of mesenchymal stem cells from umbilical cord blood. STEMCELLS
2004;22:625– 634.
19 Leskela HV, Risteli J, Niskanen S et al. Osteoblast recruitment from stem cells does not decrease by age at late adulthood. Biochem Biophys Res Commun 2003;311:1008 –1013.
20 Haberland M, Schilling AF, Rueger JM et al. Brain and bone: Central regulation of bone mass. A new paradigm in skeletal biology. J Bone Joint Surg Am 2001;83:1871–1876.
21 Elefteriou F, Takeda S, Ebihara K et al. Serum leptin level is a regulator of bone mass. Proc Natl Acad Sci U S A 2004;101:3258 –3263. 22 Gordeladze JO, Drevon CA, Syversen U et al. Leptin stimulates human
osteoblastic cell proliferation, de novo collagen synthesis, and mineral-ization: Impact on differentiation markers, apoptosis, and osteoclastic signaling. J Cell Biochem 2002;85:825– 836.
23 Thomas T, Gori F, Khosla S et al. Leptin acts on human marrow stromal cells to enhance differentiation to osteoblasts and to inhibit differentia-tion to adipocytes. Endocrinology 1999;140:1630 –1638.
24 Laharrague P, Larrouy D, Fontanilles AM et al. High expression of leptin by human bone marrow adipocytes in primary culture. FASEB J 1998; 12:747–752.
25 Felson DT, Zhang Y, Hannan MT et al. Effects of weight and body mass index on bone mineral density in men and women: The Framingham study. J Bone Miner Res 1993;8:567–573.
26 Nuttall ME, Gimble JM. Controlling the balance between osteoblasto-genesis and adipoosteoblasto-genesis and the consequent therapeutic implications. Curr Opin Pharmacol 2004;4:290 –294.