O International Epidemiological Association 1998 Printed in Great Britain International Journal of Epidemiology 1998;27:1053-1056
The meaning and use of the cumulative rate
of potential life lost
Wen-Chung Lee
Background The 'years of potential life lost' (YPLL) is a public health measure in widespread
use. However, the index does not apply to the comparisons between different
populations or across different time periods. It also has the limit of being
cross-sectional in nature, quantifying current burden but not future impact on society.
Methods A new years-lost index is proposed—the 'cumulative rate of potential life lost'
(CRPLL). It is a simple combination of the 'cumulative rate' (CR) and the YPLL.
Vital statistics in Taiwan are used for demonstration and comparison of the new
index with existing health-status measures.
Results The CRPLL serves the purpose of between-group comparison. It can also be
con-sidered a projection of future impact, under the assumption that the age-specific
mortality rates in the current year prevail. For a rare cause of death, it can be
interpreted as the expected years (days) of potential life lost during a subject's
lifetime.
Conclusions The CRPLL has several desirable properties, rendering it a promising alternative
for quantifying health status.
Keywords Age standardization, cumulative rate, epidemiological methods, health-status
indicator, life expectancy, vital statistics, years of potential life lost
Accepted 20 April 1998
The 'years of potential life lost' (YPLL) is a public health
measure in widespread use.
1The statistic measures the total
number of life yean lost due to premature deaths in a
popu-lation. The definition of premature includes death at the age of
less than 65, 70, 75 or the average life expectancy, etc.
1The
measure YPLL was introduced mainly because simple mortality
rates, including the age-specific and the age-adjusted ones, do
not fully address the issue of premature mortality, the impact of
disease/death and its cost to society.
Although, YPLL does provide a means of comparing the
relative importance of different causes of death for a specific
population at a specific point in time, the index does not apply
when one moves a step further in making comparisons between
different populations or across different time periods.
2This is
because the YPLL lacks a 'denominator' to adjust for the
differ-ences in the population sizes and age structures of the groups
being compared.
2Such modified indices as "YPLL per death' or
'RPLL (rate of potential life lost) do have a denominator with
them.
3However, these indices should be viewed as a kind of
'crude' rate at best. To facilitate valid comparisons between
groups, some suggest using age standardization.
23However, this
leads to further 'arbitrariness' in choosing a suitable 'standard
Graduate Institute of Epidemiology, College of Public Health, National Taiwan University and National Defense Medical Center, ROC.
Reprint requests: Dr Wen-Chung Lee, Graduate Institute of Epidemiology, National Taiwan University, No. 1, Jen-Ai Rd, 1st Sec Taipei, Taiwan, ROC.
population'. Also, the resulting age-standardized indices of
potential life lost are not easily interpretable by themselves.
Another problem with the YPLL index is that it quantifies
the cross-sectional (current) but not the prospective (future)
impacts on society. It should be noted that the deaths in a
cross-sectional table have already taken place and are no longer
pre-ventable.
4Therefore, when setting health goals for preventing
and controlling diseases, it seems more pertinent to consider the
future impact rather than the current burden.
4In this paper, we propose a new years-lost index, namely the
'cumulative rate of potential life lost' (CRPLL). It is in fact a very
simple index—a simple marriage of the 'cumulative rate' (CR)
5and the YPLL. Yet, it serves the purpose of between-group
com-parison. It can also be considered a projection of future impact
under the assumption that the age-specific mortality rates in the
current year prevail.
The author uses vital statistics in Taiwan for demonstration
and compares the new index with existing health-status
measures.
The Cumulative Rate of Potential Life Lost
(CRPLL)
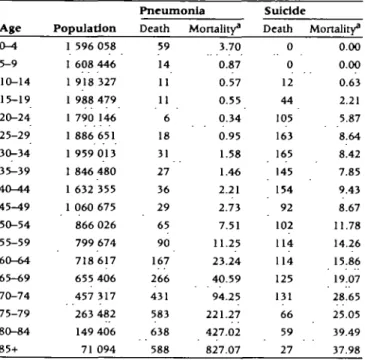
We use mortality data of pneumonia and suidde in Taiwan
(including the Kinma area), 1995, for the demonstration of
the new index. Table 1 presents the death counts, population
numbers, and mortalities in 5-year age groups. We assume the
1053
1 0 5 4 INTERNATIONAL JOURNAL OF EPIDEMIOLOGY
Table 1 Population size and mortality due to pneumonia and suidde in Taiwan, 1995 A g e 0 - 4 5-9 10-14 15-19 20-24 25-29 30-34 35-39 40-44 45-49 50-54 55-59 60-64 65-69 70-74 75-79 80-84 85+ Population 1 596 058 1 608 446 1 918 327 1 988 479 1 790 146 1 886 651 1 959 013 1 846 480 1 632 355 1 060 675 866 026 799 674 718 617 655 406 457 317 263 482 149 406 71 094 Pneumonia Death 59 14 11 11 6 18 31 27 36 29 65 90 167 266 431 583 638 588 Mortality" 3.70 0.87 0.57 0.55 0.34 0.95 1.58 1.46 2.21 2.73 7.51 11.25 23.24 40.59 94.25 221.27 427.02 827.07 Suicide Death 0 0 12 44 105 163 165 145 154 92 102 114 114 125 131 66 59 27 Mortality3 0.00 0.00 0.63 2.21 5.87 8.64 8.42 7.85 9.43 8.67 11.78 14.26 15.86 19.07 28.65 25.05 39.49 37.98 " Per 100 000 population.
deaths, on average, occur at the mid-points of the intervals. And
for the last interval (age *85), we assume an exponential decay.
This is of course a very rough approximation, especially in the
younger and the older age groups. For refinement one should
turn to a more refined age grouping. We stop short of doing so
in this paper since the principle remains the same. We also
assume the upper age limit of the potential life lost to be 75,
though the methodology can easily be modified for other cutoffs.
The proposed CRPLL is simply a cumulative rate with the
'weight' taken, in addition to the usual interval length, as the
average years lost of a death occurring in each age group. Given
the assumptions presented above, the average lost years in each
age group i (denoted as /,) can be calculated as /,- = 75 - (5i - 2.5),
for / «£15. And for i >15, /, = 0. The CRPLL is defined through
the following equation:
CRPLL =£[(/,-
ni)m\
i
where the n
fis the interval length of each age group and the m
iis the age-spedfic mortality of the cause under concern.
For the above example of death from pneumonia, the CRPLL
is calculated as 0.0961. And for suidde, it is 0.1505. Note that
they take the unit of 'year
1. However, for ease of presentation
and interpretation, we change their units into 'day' (CRPLL =
35.1 days for pneumonia death and 55.0 days for suidde).
It is of interest to note that the above-defined CRPLL has
an intuitive appeal when applied to a rare cause of death. The
appendix shows that it can be interpreted as the expected years
(days) of potential life lost due to the cause under concern (e.g.
pneumonia and/or suidde) during a subject's lifetime, if he/she
does not succumb to other competing causes of death.
The formula for the confidence intervals (CI) of the CRPLL
can be derived easily which takes a very simple form:
95% C.I. of CRPLL
=X[('|-n,)-mi]±l-96-where the pi is the population number of the age group ;. For
the example of pneumonia death, the 95% CI of the CRPLL are
calculated as 32.8, 37.5 (days). And for suidde, the 95% CI are
52.0, 57.9 (days).
Comparison with Other Health-status
Measures
In this section, we compare the newly proposed CRPLL with some existing health-status measures, namely, the crude rate, the 'ASR' (age-standardized rate),5 the CR,5 the 'life table risk',6
the YPLL,1"3 the YPLL per death,3 the RPLL,3 the 'SRPLL'
(stand-ardized rate of potential life lost),3 and the T.YPLL' (lifetime years
of potential life lost).4 The formulae for these indices are shown
in Table 2. It can be seen that all these indices are similar in form —they either take average or sum the age-spedfic mortalities
Table 2 Comparison of various health-status measures In quantifying the impacts of pneumonia death and suidde in Taiwan, 1995
Measures*
Pneumonia
Formula1" death Suicide
Crude rate
ASR CR
life-table risk YPLL YPLL per death
RPLL SRPLL LYPLL CRPLL
AtA
IK"
1-]
14.44C 7.61C [loo.ooo 14.55C 0.0834 0.0353 20 207.5 6.58 7.06c 0.0122 0.0080 43 500 26.89 95.02c 107.08c 30.4d 35. ld 2O4.5c 181.2C 51.0d 55.0d1 ASR: age-standardized rate, CR. cumulative rate, YPLL years of potential Ufe lost, RPLL rate of potential life lost, SRPLL: standardized rate of potential hfe lost, LYPLL: lifetime years of potential life lost, CRPLL cumulative rate of potential life lost.
b /,: average lost years in age group i, />,: population number In age group i.
m(. mortality rate in age group i. n(: population structure of the standard population (1976 world standard population in our examples), yf. person-year in age group i of a life-table population, n,: interval length of age group i. c Per 100 000 population.
CUMULATIVE RATE OF POTENTIAL LIFE LOST 1055
(the w,-'s) of the population under study. The differences lie in the 'weights' being used. And this greatly determines the properties of the various indices. First, we see that the weights in calculating the crude rate, the YPLL, the YPLL per death, and the RPLL indices involve the age structure of the population under study (p,'s). Thus they are, as is already well known, crude measures unsuitable for between-group comparisons. The SRPLL is a standardized index like the ASR. They circumvent the problem of disparate population structures by introducing the 'Kj (standard population structure) as the basis of com-parison. As has been pointed out however, the choice of such a standard may sometimes present a problem. By contrast, we see that the newly proposed CRPLL does not have this kind of problem. Its weight (/,• • ttj) does not involve the population under study or any other standard populations at all. Therefore, the CRPLL can legitimately be used to compare the impact of disease on different countries.
Second, we see that the weights of the various years-lost indices all involve the /,-, while the crude rate, the ASR, the CR, and the life table risk don't. The /,-, the average years lost of a death occurring in each age group, can be viewed as a value judgment imposed on each death. It reflects, in some sense, consequent social, family and economic burdens. Without it, the impact of a death will be the same irrespective of the age.
Third, we note that the interpretation of the CRPLL as the expected years of potential life lost during a subject's lifetime is similar to the well-known link between the CR and the lifetime disease probability.5 They both reflect the projected risk an
in-dividual will have as he/she progresses through each age. How-ever, the CR weighs the risk according to the amount of time spent in each age category (the nt), whereas the CRPLL weighs
the cumulative risk additionally with value judgment. Con-sequently, these two indices have different implications. From Table 2, we see that the lifetime risk of pneumonia death in Taiwan is 0.0834 (CR = 0.0834), and it causes, on average, 35.1 (CRPLL = 35.1) days of potential life lost. As for suicide, we see that its lifetime risk (CR = 0.0122) is lower. Yet, it causes more potential life lost (CRPLL = 55.0 days) during a subject's lifetime. Fourth, it is also of interest to compare the CRPLL with the LYPLL.4 The LYPLL is a projected risk as well. However, the
index is developed using the life table methodology (it involves the 'y(, the person-year in age group i of a life-table popu-lation). A life table explicitly assumes the presence of competing
Table 3 The properties of the various health-status measures
deaths. Thereby the loss measured by the LYPLL is the interplay of the cause of death under study and the competing deaths. By contrast, the CRPLL in this paper quantifies specifically the pure effect from the cause of death under concern. Just as the CR can be called a 'conditional risk' and a life-table risk, an 'uncon-ditional risk', we may refer to the CRPLL as the 'con'uncon-ditional' years-lost index and the LYPLL, a YPLL of 'unconditional' type.
Finally, we note that the CRPLL, though it is a population summary index, is best understood at the individual level—a property also shared by the CR, the life-table risk, or the LYPLL. These indices reflect, from different perspectives, the lifetime history of an average subject in the population. This is in sharp contrast to the traditional YPLL index which, though it quantifies succinctly the burden of disease for the entire population, doesn't by any means possess an individual-level interpretation by itself. The properties of these various health-status measures are summarized in Table 3.
Discussion
In this paper, we see that the proposed CRPLL has several desirable properties, rendering it a promising alternative for quantifying health status. It nicely condenses the whole table of age-specific mortality into a single but meaningful value—the expected year of potential life lost during a subject's lifetime. This valuable information is not readily discernible from a simple inspection of the mortality table per se. However, one should note that any index derived from condensation or summarization can mask important features of the data. For an aetiologic investigation, we believe that comparisons should still be based primarily on the table of age-specific rates rather than on a summary of it.
Secondly, it should be pointed out that the CRPLL is based on 'cross-sectional' but not 'longitudinal' data. The situation is just like the case of cumulative risk or life expectancy. All of them rely on the same assumption, i.e. each subject in the population will be subject throughout his or her life to the same age-specific mortality rates prevailing in the current year. Clearly, this is a bold assumption. In previous papers, the age-period-cohort (APC) modelling technique has been adopted to obtain the cohort-specific lifetime risk7 and the cohort-specific life
expectancy8 from cross-sectional data. The same technique can
M e a s u r e s * Crude rate ASR CR Life-table risk YPLL
YPLL per death RPLL SRPLL LYPLL CRPLL Between-group comparison No Yes Yes Yes No No No Yes Yes Yes Need for an external standard No Yes No No No No No Yes No No Value judgment on death No No No No Yes Yes Yes Yes Yes Yes Lifetime projected risk No No Yes Yes No No No No Yes Yes Conditional risk -Yes No -No Yes Individual-level interpretation No No Yes Yes No No No No Yes Yes ' See the footnotes in Table 2.
1056 INTERNATIONAL JOURNAL OF EPIDEMIOLOGY
also be applied to the present context. However, such modelling is technically involved and is beyond the scope of this paper. At present, it is advised that we interpret CRPLL with due caution as with lifetime risk and life expectancy.
Finally, the CRPLL, being an index of the lost years due to death, is a measure of disease burden on society. However, a disease or an illness can exert its impact before death, by causing disability or jeopardizing quality of life, etc. Recently, there have been considerable efforts directed toward combining the two dimension of morbidity and mortality into a single index for disease burden (for example, the QALY and the DALY).9 It is
possible that the concept of cumulative rates may shed new light on the problem of constructing composite burden-of-disease indicators as well.
Acknowledgements
This paper is partly supported by the National Science Council, ROC.
References
1 Gardner JW, Sanbom JS. Years of potential life lost (YPLL)—what
does it measure? Epidemiology 1990,1:322-29.
2 Marlow AK. Potential years of life lost: what is the denominator?
J Epidemiol Community Health 1995;49:320-23.
3Esteve J, Benhamou E, Raymond L. Statistical Methods in Cancer
Research, Vol TV, Descriptive Epidemiology IARC Scientific Publication,
No. 128, Lyon, France, 1994.
4 Lee WC. Quantifying the future impact of disease on society: life
table-based measures of potential life lost. Am J Public Health 1997;87: 1456-60.
5 Breslow NE, Day NE. Statistical Methods in Cancer Research, Vol II,
The Design and Analysis of Cohort Studies IARC Scientific Publication,
No. 82, Lyon, France, 1987.
6 Schouten LJ, Straatman H, Kiemeney LALM, Verbeek ALM. Cancer
incidence: life table risk versus cumulative risk. J Epidemiol Community
Health 1994:48:596-600.
7 Campbell MK, Feuer EJ, Wun LM. Cohort-specific risks of developing breast cancer to age 85 in Connecticut. Epidemiology 1994:5:290-96.
8 Lee WC, Hsieh RL. Estimating life expectancy using an age-cohort
model in Taiwan. J Epidemiol Community Health 1996;50:214-17.
9 Morrow RH, Bryant JH. Health policy approaches to measuring and
valuing human life: conceptual and ethical issues. Am J Public Health 1995:85:1356-60.
Appendix
Let the age groups be indexed by ;', and the interval length and the cause-specific mortality of each age group be represented by n, and m, respectively. In the absence of compering deaths, the lifetime disease risk (probability of death) from birth to the end of the ith age interval is l-exp(-CR,), where
CR, =^d[nj-mj] (see5)
This probability is approximately equal to CR,, provided that it is small. Therefore, the probability of dying in the ith interval is CR, - CR,_j = rij mt Such a death incurs, on average, /,- years of
life lost (see text). We see that the expected years of potential life lost due to the cause under concern during a subject's life-time is