國
立
交
通
大
學
電子物理研究所
博 士 論 文
二六族化合物半導體及奈米結構的
光學性質
Optical Properties of II-VI Compound
Semiconductors and Nanocrystals
研究生:林彥丞
指導教授:周武清 教授
二六族化合物半導體及奈米結構的光學性質
Optical Properties of II-VI Compound
Semiconductors and Nanocrystals
研究生:林彥丞 Student:Yan-Cheng Lin
指導教授:周武清 教授 Advisor:Prof. Wu-Ching Chou
國 立 交 通 大 學
電 子 物 理 研 究 所
博 士 論 文
A Dissertation
Submitted to Institute of Electrophysics
College of Science
National Chiao Tung University
in Partial Fulfillment of the Requirements
for the Degree of
Doctor of Philosophy
in
Electrophysics
January 2009
Hsinchu, Taiwan, Republic of China
二六族化合物半導體及奈米結構的光學性質
研究生: 林彥丞 指導教授: 周武清 教授
國立交通大學電子物理研究所
中文摘要
本論文的第一部份使用鑽石高壓及半導體光頻譜技術,探討二六族化合物硒化鎘鋅 (鎘含量佔 0 至 32 莫耳百分比)和碲化錳鋅(錳含量佔 0 至 26 莫耳百分比)半導體薄膜的 光學聲子模態和晶體結構特性。藉由觀察拉曼散射光譜可以確定硒化鎘鋅以及碲化錳鋅 的光學聲子模都屬於中間態。我們以二次多項式去擬合縱向光學聲子頻率隨壓力變化的 關係,求得格留乃森 (Grüneisen) 參數。在鎘濃度較高的硒化鎘鋅樣品中發現由外加壓 力引起的共振拉曼散射增強效應,這個共振效應也被用來研究在常溫常壓時拉曼訊號相 當微弱之碲化錳鋅半導體。高壓拉曼實驗結果顯示,半導體轉變為金屬相的開始壓力會 隨著鎘和錳元素的參雜濃度增加而下降。當鎘(錳)濃度從 0 增加到 32 莫耳百分比(0 增加 到26 莫耳百分比)時,相轉變壓力從 13.6 降至 9.4 (15.7 至 10.3) GPa。此外,實驗結果 顯示在常壓時,錳離子的參雜會增加碲化鋅半導體的離子性質,然而外加壓力卻會降低 碲化錳鋅的離子性。 利用拉曼光頻譜來觀察以氯摻雜之 n 型硒化鋅薄膜半導體 (電子濃度範圍從 8.2 × 1015 cm-3 到 1.8 × 1018 cm-3) 的聲子振動、電子濃度以及晶體結構的特性。實驗發現,氯 摻雜之 n 型硒化鋅半導體的拉曼光譜會受到縱向光學聲子以及自由電子耦合效應的影 響。因此藉由拉曼散射效率方程式以及介電方程式來擬合譜線,可以求得樣品的電子濃 度和載子遷移率。實驗發現半導體轉變為金屬相的開始壓力會隨著電子濃度的增加而下 降,這個現象指出樣品參雜電子也會造成晶體的不穩定。此外,我們發現外加壓力會使得縱向光學聲子和自由電子的耦合效率變低,可能是因為加壓造成另一個深層施子能態 的產生,使得樣品的電子濃度降低所造成。 本論文的第二部份我們發現由Kohlrausch提出的指數延伸定律與等電性碲硒化鋅半 導體螢光的衰減頻譜有極高的關聯性。當碲原子的濃度增加時,延伸參數 (β) 會先降低 而後增加,這個結果可以用跳躍遷移 (hopping-transport) 以及能量轉移的模型來解釋。 當等電性碲原子捕捉態 (trap states) 的數量增加時,碲硒化鋅半導體光激發光的衰減速 率會變慢、光頻譜的半寬會變寬;然而,當碲原子局域性能態與共價帶的邊緣能態開始 混成之後,碲硒化鋅半導體光激發光的生命期和光頻譜的半寬都會產生下降的趨勢。 最後,我們用時間解析光頻譜技術來討論碲化鎘膠質量子點之間能量轉移的現象。 量子點間的能量轉移的效率不但會與小尺寸量子點的放射譜和大尺寸量子點的吸收譜 的重疊程度有關,還會與量子點之間的距離有關。在混合的量子點溶液和固態薄膜中, 發現小尺寸的量子點的光激螢光強度和生命期會變低,然而大尺寸的量子點的光激螢光 強度和生命期會變高,這些實驗結果是鄰近量子點極性耦合產生的共振能量轉移的直接 證據。在混合的量子點固態薄膜中,隨著量測能量的降低,延伸參數 (β) 會隨之增加, 並且趨向一,這個現象直接反映了有效率的能量轉移從小的量子點至大的量子點。
Optical Properties of II-VI Compound
Semiconductors and Nanocrystals
Student: Yan-Cheng Lin Advisor: Dr. Wu-Ching Chou
Institute of Electrophysics
National Chiao Tung University
Abstract
The first part of this thesis explores the optical phonon modes and crystal characteristics of Zn1–xCdxSe (0 ≦ x ≦ 0.32) and Zn1-xMnxTe (0 ≦ x ≦ 0.26) thin films using
high-pressure techniques and optical spectroscopy. The phonon Raman spectra of ZnCdSe and ZnMnTe all exhibit intermediate phonon modes. The pressure-dependent longitudinal optical phonon frequencies and the Grüneisen parameter were obtained by quadratic polynomial fitting. The pressure-driven resonant Raman scattering effect was observed in Zn1–xCdxSe
with a high Cd concentration, and it was exploited to analyze the crystal characteristics of ZnMnTe, which has weak Raman signals under ambient conditions. The pressure at the onset of metallic phase transition (Pt) declines as the Cd and Mn contents increase. As the Cd (Mn) concentration increases from 0 to 0.32 (0 to 0.26), the Pt falls from 13.6 to 9.4 (15.7 to 10.3) GPa.
The vibrational, electronic, and crystalline characteristics of n-type chlorine-doped ZnSe (ZnSe:Cl) layers with a carrier concentration from 8.2 × 10¹⁵ to 1.8 × 1018 cm-3 were also studied by Raman spectroscopy. The spectral lineshapes of the longitudinal-optical-phonon and plasmon coupling (LOPC) modes are analyzed using the Raman scattering efficiency and
the dielectric function to determine the electron densities and mobility. The metallic phase transition pressure of ZnSe:Cl layers decreases as the carrier concentration increases, indicating that n-type doping reduces crystal stability. Additionally, the pressure-induced weakening of the LOPC efficiency suggests that pressure tends to degrade the n-type characteristic of ZnSe:Cl because of the emergence of a new deep donor-like state.
In the second part of this thesis we found that the Kohlrausch’s stretched exponential law is correlated well with the PL decay profiles of ZnSe1−xTex. As the Te concentration increases,
the stretching exponent β initially declines and then monotonically increases. This result can be understood using the hopping-transport and energy transfer model. An increase in the number of isoelectronic Te localized traps reduces the PL decay rate and increases the linewidth, whereas the hybridization of the Te localized states with the valence-band edge states reduces both the lifetime and the linewidth.
Finally, the transfer of electronic energy between CdTe colloidal quantum dots (QDs) was studied using time-resolved photoluminescence (PL) spectroscopy. The efficiency of energy transfer in QDs depends not only on the spectral overlap of small dots emission and large dots absorption, but also on the inter-dot distances. The quenching of the PL intensity (lifetime) of small dots, as well as an enhancement of large dots in mixed solution and a solid film are evidence of a resonant transfer of energy due to dipolar coupling between proximal QDs. In a solid with mixed QDs, the stretching exponent β increases as the probe-energy declines, and approaches one, implying efficient energy transfer from smaller to larger QDs.
Acknowledgements
時光飛逝,我的求學生涯,隨著這本論文的完成即將畫下句點,回想在交大做研究 的日子,有歡笑也有淚水。從一開始實驗室搬遷、空間規畫和儀器架設、參加人生最後 一次期末考、第一篇論文接受發表、通過資格考直到最後論文口試,一路走來遭遇許多 困難與挫折,但也因為有你們的陪伴與提攜,總是在我最失落時,給我建議、鼓勵與支 持,成為我繼續往前邁進的最大動力,讓我能夠再次實現自我、提升自己,並完成博士 學位。 在這段日子裡,最感謝的是我的指導教授–周武清博士,帶領我進入光電半導體的 研究領域。七年來,在周老師的耐心指導下,使我從一個懵懂專題生,逐漸對物理研究 產生興趣,最後完成博士論文。從老師身上,我感受到學術研究家的專注與深思,以及 待人處事的細心與氣度,老師的身教及言教,一直以來都是我最尊崇的榜樣。謝謝老師 多年來對我的栽培,您總是不厭其煩地教導我每一件事情,不斷提醒我做事應該更細心 與仔細;與人相處應該和善與尊重;從事學術研究應走出去多看、多學、多討論,您的 教導與提醒,我會銘記在心。 感謝褚德三教授將珍貴的實驗儀器留給我們,讓我能順利完成這本論文。雖然與您 討論的次數不多,但是您淵博的學問與豐富人生經驗卻一直是我尊敬與學習的目標。我 也要感謝楊賜麟教授、中原物理系邱寬城教授與沈志霖教授對我論文的建議,以及對我 多年來的照顧,讓我能順利完成學業。感謝成大地科系余樹楨教授在高壓技術、觀念及 論文寫作上給予我非常多寶貴的建議,讓我的知識更為正確且深入,也謝謝您一直以鼓 勵的方式激勵我,讓我不至於一直否定自己。感謝光電所謝文峰教授、中央電機系綦振 瀛教授對我論文內容的建議和指教,讓我獲益良多。感謝實驗室所有成員及過去曾經與 我一起熬夜打拼的學弟妹們,謝謝你們的加油、鼓勵與歡笑聲,一切點滴也同時記錄於 這本論文中,也只有我們感受的到。 最要感謝的還有我的女友Michelle,謝謝妳多年的照顧、陪伴、體諒與包容,沒有 妳一路上的支持與鼓勵,我無法順利完成學業,並進入人生下一個階段。你總在我最失落時,鼓勵我、替我難過,是妳給我信心,要我相信自己,也讓我更加堅定。每當我小 有收穫時,妳陪著我慶祝,並告訴我不可驕傲放縱,要再接再厲、自我突破。最要感謝 的還有我的父母、大姊與二姊,你們對我的養育、栽培、關愛、包容與支持,並給予我 所有的一切,讓我能無後顧之憂地專注於研究工作,並在求學之路上持續邁進。感謝爸 媽,對你們的感恩之意溢於言表,已超乎筆墨所能形容! 最後僅將這本論文獻給我最敬愛與最疼愛我的父母親,所有成就與榮耀都屬於你 們! 林彥丞 于新竹交大 January 11, 2009
Contents
Abstract in Chinese i Abstract in English iii Acknowledgements v Contents vii
List of Figures ix List of Tables xiv
Chapter 1 Introduction 1
1.1 Physical Properties of Semiconductors under High Pressure 2 1.2 Optical Properties of Isoelectronic Semiconductors 6
1.3 Electronic Energy Transfer in Semiconductor Nanocrystals 8
Chapter 2 Experimental Details 15 2.1 High-Pressure Techniques 15 2.2 Optical Spectroscopy 29
Chapter 3 Pressure-Dependent Raman Scattering and Photoluminescence of Zn1–xCdxSe 34
Chapter 4 Pressure-Induced Metallization and Resonant Raman Scattering in Zn1-xMnxTe 55
Cl-Doped ZnSe under High Pressure 70
Chapter 6 Time-Resolved Photoluminescence of Isoelectronic Traps in ZnSe1-xTex
Semiconductor Alloys 92
Chapter 7 Electronic Energy Transfer in CdTe Colloidal Quantum Dots 104
Chapter 8 Conclusions 116
List of Figures
FIG. 2.1. (a) Schematic depiction of diamond anvil cell (DAC). 24 FIG. 2.1. (b) Diamond anvil cell as used in this thesis. 24
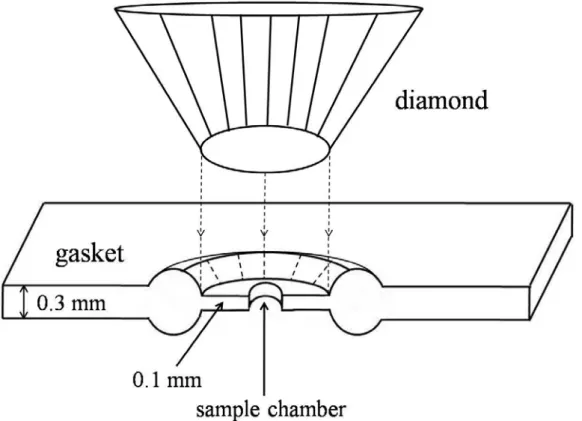
FIG. 2.2. Section of gasket indentation area and the sample chamber. 25
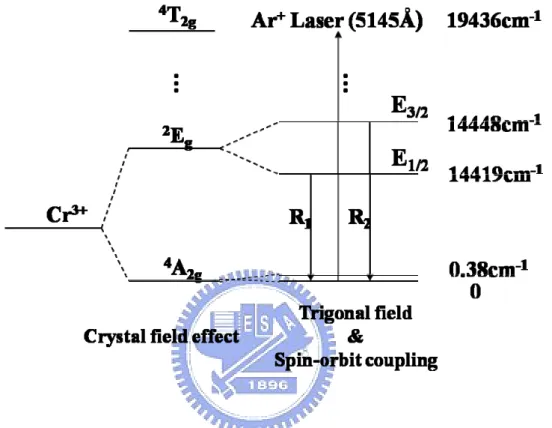
FIG. 2.3. Energy levels of Cr3+ in Al2O3. The transitions E1/2 → A and E3/2 → A yield R1 and R2 lines, respectively. 26
FIG. 2.4. Wavelength of ruby fluorescence against pressure. [Ref. 19] 27
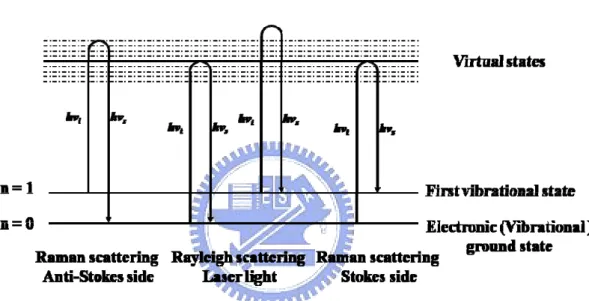
FIG. 2.5. Pressure-dependent ruby fluorescence spectra at room temperature. 28 FIG. 2.6. Schematic scattering of light. 31
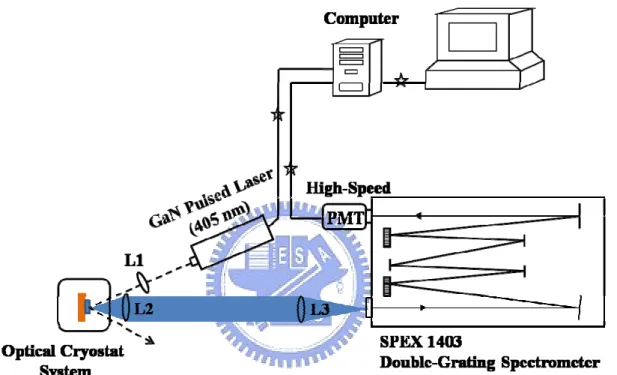
FIG. 2.7. Experimental setup of micro-Raman (PL) system. 32 FIG. 2.8. Experimental setup of time-resolved PL system. 33
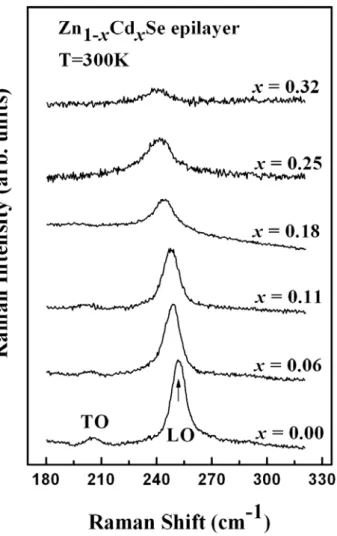
FIG. 3.1. Raman spectra of Zn1–xCdxSe epilayers (0 ≦ x ≦ 0.32) at 300 K and ambient
pressure. 47
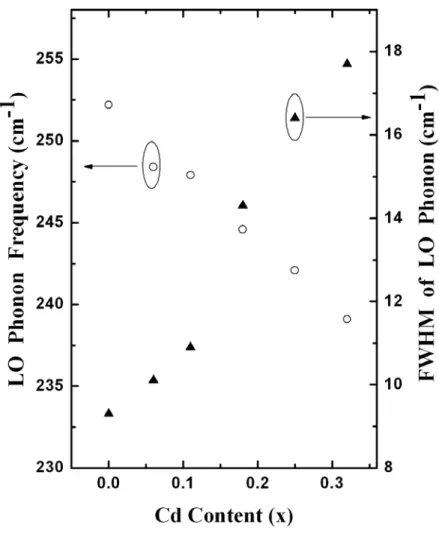
FIG. 3.2. Dependence of LO phonon frequencies (open circle) and FWHM (solid triangle) on Cd concentration (x). 48
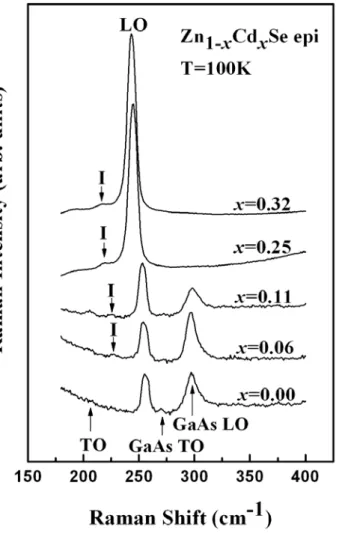
FIG. 3.3. Raman spectra of Zn1–xCdxSe epilayers (0 ≦ x ≦ 0.32) at 100 K and ambient
pressure. The impurity (I) modes, indicated by black arrows, appear at low temperature. The LO and TO phonons of the GaAs substrate are also labeled.
49
FIG. 3.4. Up-stroke pressure-dependent Raman spectra of Zn1–xCdxSe (x = 0.06) at room
change from semiconductor to metal. 50
FIG. 3.5. Down-stroke pressure-dependent Raman spectra of Zn1–xCdxSe (x = 0.06) at room
temperature. The splitting of the TO phonon, labeled by black arrows, was observed clearly as the pressure was released. 51
FIG. 3.6. Up-stroke pressure-dependent Raman spectra of Zn1–xCdxSe (x = 0.25) at room
temperature. The pressure-driven resonant Raman scattering effect occurred as the pressure was increased. The LO phonon was found to disappear at about 11.0 GPa.
52
FIG. 3.7. Pressure-dependent photoluminescence spectra of Zn1–xCdxSe (x = 0.25) at 300 K.
The 514.5 nm (2.41 eV) Ar+ laser was fixed as an excitation source. The black dashed arrow at 2.41 eV labels the energy of the excitation laser, whereas the Stokes and anti-Stokes Raman spectra occur at the lower and higher energy sides of the laser, respectively. The inset plots the pressure dependence of PL energies, and the dashed line indicates the energy of the excitation laser. 53
FIG. 3.8. Cd concentration (x)-dependent phase transition (semiconductor-to-metal) pressure of Zn1–xCdxSe epilayers. The solid curve represents a quadratic polynomial fit. 54
FIG. 4.1. Raman spectra of Zn1-xMnxTe (0 ≦ x ≦ 0.26) at 300 K under ambient pressure.
The excitation source is a 514.5 nm line from an Ar+ laser. 65
FIG. 4.2. Dependence of LO phonon frequencies (open circle) and PL energy (solid square) on Mn concentration (x) at room temperature. The solid curve is a quadratic polynomial fit for the LO phonon. 66
indicate the LO and the TO phonons. The excitation source is a 488.0 nm line from an Ar+ laser. The pressure-induced RRS enhancement occurs as the external pressure is increased. 67
FIG. 4.4. Up-stroke pressure-dependent Raman spectra of Zn0.91Mn0.09Te at 300 K. LO, TO, LO + TA, and impurity (I) modes are labeled. 68
FIG. 4.5. Mn concentration (x)-dependent semiconductor-to-metal phase transition pressure of Zn1–xMnxTe. The solid curve is a quadratic polynomial fit, given by Pt (x) = 15.7 –
25.4 x + 19.0 x2 (GPa). 69
FIG. 5.1. Raman spectra (open circles) with calculated lineshape analysis (solid lines) of n-type ZnSe:Cl layers for various carrier densities at 300 K and ambient pressure, including Lorentzian fit for the TO phonon. 84
FIG. 5.2. Carrier concentration obtained at 300 K from Hall measurement nH (full squares),
compared with those obtained from optical Raman measurement nR (open circles),
as function of ZnCl2 source temperature. The dashed line is merely a guide for the eye. 85
FIG. 5.3. Mobility obtained at 300 K from Hall measurement μH versus those obtained from
optical Raman measurement μR. The solid, dashed, and dotted lines, respectively,
represent the ratio, μH / μR = 1, 2, and 3. 86
FIG. 5.4. (a) Up-stroke pressure-dependent Raman spectra of the ZnSe:Cl layer (nH = 8.2 ×
1015 cm-3) at 300 K. The behavior of mode I and the TO phonon are indicated by solid and dashed arrows, respectively. (b) Pressure dependence of Raman shifts for LO, TO, TO split, and mode I of ZnSe:Cl layer (nH = 8.2 × 1015 cm-3). The solid
FIG. 5.5. (a) Up-stroke pressure-dependent Raman spectra of the ZnSe:Cl layer (nH = 1.8 ×
1018 cm-3) at 300 K. The LO phonon disappears at about 12.5 GPa. (b) Pressure-dependent Raman shifts of ZnSe:Cl layer (nH = 1.8 × 1018 cm-3). The
solid curves represent quadratic polynomial fits. 88
FIG. 5.6. Carrier concentration (nH)-dependent semiconductor-to-metal phase transition
pressure of n-type ZnSe:Cl layers. The dashed curve represents a quadratic polynomial fit. The inset displays the PL spectra of undoped ZnSe and the n-type ZnSe:Cl layers at 300 K, excited by an He-Cd 325 nm laser. 89
FIG. 5.7. Pressure-dependent LO phonon of undoped ZnSe (full squares) and LOPC mode of n-type ZnSe:Cl for nH = 8.2 × 1015 cm-3 (open triangles) and nH = 1.8 × 1018 cm-3
(full circles). The solid curve is a quadratic polynomial fit of an undoped ZnSe LO phonon, and the dashed curve is the same curve but shifted downward to capture the presumed behavior of the LOPC mode of ZnSe:Cl (nH = 1.8 × 1018 cm-3). The inset
plots the pressure-dependent FWHM of the undoped ZnSe LO phonon and the ZnSe:Cl LOPC mode (nH = 1.8 × 1018 cm-3). 90
FIG. 5.8. Schematic band structure of n-type ZnSe:Cl. (a) At ambient pressure, the energy difference between the D state and the conduction band minimum, ∆E (ED – EC), is positive. (b) With compression, ∆E (ED – EC) declines and eventually becomes negative. 91
FIG. 6.1. Normalized PL spectra of ZnSe1−xTex (0 ≦x ≦ 1) at 13 K. 100
FIG. 6.2. TRPL spectra of ZnSe1−xTex at 13 K. The inset plots the data on a double
logarithmic scale; the stretched-exponential function is then a straight line.
FIG. 6.3. (a) PL lifetime, (b) PL linewidth, and (c) stretching exponent β of ZnSe1−xTex as
functions of Te concentration. 102
FIG. 6.4. (a) Dependence of TRPL measurements on probing energies of ZnSe0.90Te0.10. (b) TRPL image of ZnSe0.90Te0.10. 103
FIG. 7.1. (a) PL spectra of 3.3 nm CdTe QDs in water at various concentrations - 1 mol.L-1 (solid), 5.0 × 10⁻² mol.L-1 (dashed), and 1.0 × 10⁻⁴ mol.L-1 (dotted). (b) PL peak intensity versus concentration of QDs. (c) Temporal evolution of PL spectra of QDs (1.0 × 10⁻¹ mol.L-1). 111
FIG. 7.2. (a) Absorption spectra of pure small (donor) and pure large (acceptor) CdTe QDs in water. PL spectra of pure donors (D), pure acceptors (A), and mixed (M) CdTe QDs (b) in water, and (c) solid. 112
FIG. 7.3. TRPL spectra of (a) donors in pure and mixed solution probed at 537 nm, and (b) acceptors in pure and mixed solution probed at 618 nm. 113
FIG. 7.4. (a) Dependence of TRPL measurements on probing energies of mixed CdTe QDs solid. (b) Time-resolved PL image of mixed CdTe QDs solid. Inset plots the TRPL data obtained at 2.27 eV (open squares) and 1.95 eV (open circles) on a double logarithmic scale. 114
FIG. 7.5. True-color images of pure small, pure large and mixed QDs in solution and solid.
List of Tables
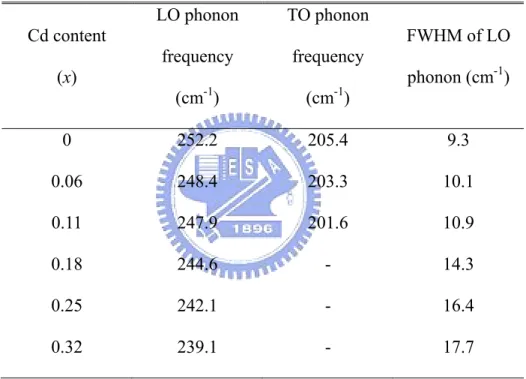
Table 3.1 LO and TO phonon frequencies and FWHM of LO phonon for Zn1–xCdxSe epilayers. 45
Table 3.2 Pressure-dependent LO phonon frequencies (ωLO), dωLO/dp, calculated mode Grüneisen parameters (γLO) and phase transition pressures for Zn1-xCdxSe
epilayers. 46
Table 4.1 Pressure-dependent LO, TO, and I phonon frequencies (ωi), dωi/dp, calculated
mode Grüneisen parameters (γi), and phase transition pressures of Zn1-xMnxTe. 64
Table 5.1 Hall carrier concentration (nH) and mobility (μH), LOPC mode frequencies,
linewidth (FWHM) and peak intensity ratio (ILOPC / ITO) of all studied ZnSe
samples with various ZnCl2 doping temperatures (TCl). 82
Table 5.2 Carrier concentration (nR), mobility (μR), and mobility ratios (μH / μR) obtained by
optical Raman measurements. Plasmon frequency (ωp), plasmon damping constant
(γ), and phonon damping constant (Γ) are derived by the calculated lineshape analysis. 83
Chapter 1 Introduction
The main focus of this thesis is to study the optical properties of II-VI compound semiconductors and nanocrystals (NCs). This dissertation comprises three parts: (1) physical properties of semiconductors under high pressure, (2) optical properties of isoelectronic semiconductors, and (3) electronic energy transfer in semiconductor NCs.
This thesis is organized as follows. This chapter introduces the history of high-pressure research and the physical properties of semiconductors under high pressure (Section 1.1), the unique optical characteristics of isoelectronic semiconductors (Section 1.2), and the electronic energy transfer in semiconductor NCs (Section 1.3); it also presents the latest relevant scientific findings. Chapter 2 describes the high-pressure techniques used and the optical measurements made in this study. Chapters 3, 4, and 5 present the experimental results and discussion of the first part of this thesis. Chapter 3 discusses the physical properties of Zn1–xCdxSe at high pressure using photoluminescence (PL) and Raman scattering. Chapter 4
studies the metallic phase transition of Zn1-xMnxTe using the pressure-induced resonance
Raman scattering approach. Chapter 5 discusses LO-phonon-plasmon coupling, structural stability, and carrier concentration as functions of applied hydrostatic pressure in n-type chlorine-doped ZnSe (ZnSe:Cl) using Raman spectroscopy. Chapter 6, the second part of the thesis, explores the decay dynamics of isoelectronic traps in ZnSe1-xTex semiconductors using
time-resolved PL. Chapter 7, the third part of the thesis, compares in detail the electronic energy transfer behavior of mixed CdTe quantum dots solution with that of the solid, using time-resolved and spectrally-resolved PL. Finally, Chapter 8 summarizes this thesis.
1.1 Physical Properties of Semiconductors under High Pressure
I. History of High-Pressure Research
Materials under high pressure exhibit interesting physical properties. High pressure conditions exist at the center of the earth and in both natural and man-made explosions. Furthermore, hydrostatic pressure can be continuously tuned from ambient pressure to ultra-high pressure in a laboratory using a diamond anvil cell (DAC), which is a device that is sufficiently small that it can fit in the palm of a hand. The transparency of diamond over a wide range of frequencies from the near ultraviolet (~ 5.5 eV) to the infrared is the most important and useful characteristic for optical measurements.
The DAC can generate high pressures because of the exceptional hardness of diamond, but even high-quality diamonds will shatter under sufficiently high loads. The hydrostatic pressure applied by the DAC can be adopted to study the pressure-dependent physical properties of condensed matter, including insulators, semiconductors and metals. Studies of the pressure-dependent physical properties of condensed matters have in the past been limited by experimental techniques, which could not generate high enough pressures to cause significant changes in the physical properties. Recently, however, this limitation has been overcome and ultra-high pressures of several mega-bars can now be generated. (One mega-bar is approximately one million atmospheres of pressure or 100 giga-pascals (GPa) in SI units.) Therefore, high-pressure techniques have become powerful tools in studying the physical properties of condensed matter.
Hydrostatic pressure, as an external thermodynamic parameter, is a convenient probe of crystalline stability. Accordingly, one of the interesting phenomena that occur under applied pressure is a sudden rearrangement of atoms, in structural phase transitions. The applied pressure reduces the lattice constant and the crystalline volume, markedly changing the inter-atomic bonding. Research into such phenomena logically begins with hydrogen, the
simplest element, which is the first in the Periodic Table, and the most abundant in the gravitationally compressed interiors of Jupiter, Saturn and some of the newly discovered extrasolar planets. Many solids that are electrical insulators at atmospheric pressure become metallic at high pressure at 300 K in the DAC; they include BaSe [1], xenon [2,3], sulphur [4], and oxygen [5]. During the past two decades, much effort has been made to realize metallic hydrogen at ultrahigh pressures [6-10]. However, the robust evidence for the metallic hydrogen in the form of either optical or conductivity measurements remains. Although the quest to observe metallic hydrogen in the laboratory is ongoing, high-pressure methods have advanced significantly and a variety of surprising new phenomena have been observed. The developments are crucial to deepening our understanding of condensed matter.
II. Semiconductor Thin Films under High Pressure
As hydrostatic pressure can be utilized to tune electronic energy bands and change the crystal phases of semiconductors, the high-pressure method has been established as an important tool for understanding the optical and crystal characteristics of semiconductors. Rapid advances in epitaxial growth and high-pressure techniques, as well as the development of sophisticated data analysis methods, have facilitated investigations of the physical properties of II–VI and III–V semiconductors under high pressure.
Notably, ZnSe is an important semiconductor in II–VI compounds. Tuchman et al. [11] studied pressure-dependent exciton recombination in bulk ZnSe and in strained and strain-relaxed ZnSe epilayers grown on GaAs substrates. They found that the energy difference between heavy- and light-hole excitons in strained ZnSe film initially decreases as applied pressure increases. When the pressure is increased to around 2.9 GPa, the crossover of heavy- and light-hole excitons energy is observed, revealing that strain in the ZnSe film transforms from a compressive to tensile strain. Smith and Martin [12] demonstrated that
ZnSe undergoes a crystallographic phase transition from a four-fold coordinated zincblend (ZB) structure into a six-fold coordinated rocksalt (RS) structure at about 13.5 GPa, as determined by x-ray diffraction. Itkin et al. [13] examined the marked decline in resistance from 1021 to 104 Ω in ZnSe at 13.5 GPa,whichindicates that pressure-induced metallization of ZnSe occurs when the crystalline structure is transformed from ZB into RS. High-pressure optical studies by Cardona’s group [14] showed that the direct energy gap of ZnSe monotonically increases as the pressure is increased. At 13.5 GPa the sample becomes opaque, indicating the metallic phase transition. Moreover, Arora et al. [15,16] demonstrated that Raman scattering is another approach to exam high-pressure phases of semiconductors. The disappearance of Raman signals at high pressure is evidence of semiconductor-to-metal phase transition due to changes in the Raman selection rule or extremely poor scattering efficiency in the metallic phase.
In the recent decade, high-pressure investigations by Chou’s group have analyzed the physical properties of epitaxial-grown II–VI semiconductors, such as undoped ZnSe [17] and ZnSe-based ternary compounds ZnMnSe [18], ZnFeSe [17], ZnCdSe [19] and ZnSeTe [20]. Energy-dispersive X-ray diffraction (EDXD), Raman scattering and photoluminescence (PL) have been extensively applied to elucidate the structural stability, vibrational modes, and electronic transitions of these semiconductors. The authors observed that phase-transition pressure in ternary compound semiconductors decreases as the substituted element content increases. The reduction behavior in phase-transition pressure of the ZnSe-based ternary semiconductors depends on the fractional volume change (∆V/V0), not the kinds of impurity
ions doped. Furthermore, the authors suggest that the disappearance of longitudinal optical phonons at which the phase becomes metal is due to the extremely thin penetration depth (skin depth) for incident light.
and III–V, and II–VI compound semiconductors. Although this investigation presents sufficient experimental and theoretical results for binary II–VI and III–V semiconductors, the physical properties of n-type and p-type semiconductors and ternary compounds under pressure when one element is replaced by a third element remain unclear.
Chapter 3 discusses in detail the PL and Raman scattering of Zn1–xCdxSe under high
pressure because the semiconductor-to-metal phase transition and crystalline stability of Zn1–xCdxSe at hydrostatic pressure remain controversial. Chapter 4 describes the effect of
applied pressure on physical properties of Zn1-xMnxTe using the resonance Raman Scattering
approach. Analytical results are useful when investigating the magnetic properties of p-doped Zn1-xMnxTe under high pressure. Chapter 5 discusses comprehensively LO-phonon-plasmon
coupling as a function of applied hydrostatic pressure in n-type ZnSe:Cl with a carrier concentration of 8.2 × 10¹⁵ to 1.8 × 1018 cm-3 using Raman spectroscopy.
1.2 Optical Properties of Isoelectronic Semiconductors
In addition to donors, acceptors, and electrically inactive impurities in semiconductors, there exists a fascinating subset designated as isoelectronic [22]: an impurity that replaces a host atom with the same valence orbital is labeled isoelectronic. Localized states in the forbidden band generally exist because of the excitons that are bound to such centers. Nitrogen that replaces phosphorus in GaP is an example of such a trap [23]. The bonding scheme of substitutional donors or acceptors in the tetrahedrally coordinated semiconductors is based on the sp3 hybridized covalent bond. For example, consider GaP that is doped with Zn and S. Zn that replaces Ga is an acceptor and S that replaces P is a donor. As well as acceptor-bound holes and donor-bound electrons, such crystals contain donor-bound and acceptor-bound excitons [24], which are bound to the neutral donors and acceptors by a van der Waals interaction. However, N and Bi, replacing P in GaP, have the same number of valence electrons as P, but they can trap a charge carrier by a non-Coulombic, short-range impurity potential, which arises from the substantial difference between the electronegativity of N and that of P (or Bi and P). The impurity, originally neutral, then acquires a charge relative to the lattice. The impurity N (Bi) is called an isoelectronic acceptor (donor), based on the type of the charge carrier (electron or hole) that is bound to it [25]. Bound excitons arise when the Coulomb field of this charge binds a second charge carrier of the opposite sign. The exciton binding energy of isoelectronic impurities ranges from tens to hundreds of meV, depending on the impurity and the host. Isoelectronic impurities have been fascinating subjects of investigation with photoluminescence, absorption, PL excitation, and localized vibrational modes; they play an important role in optoelectronic device applications.
The number of investigations of isoelectronic ZnSe1−xTex ternary compound
semiconductors has increased remarkably. The surge in activity has been a response to their unique and interesting physical properties. These properties include, for example, the unusual
spontaneous formation of a superlattice [26], large band-gap bowing [27], and a broad emission linewidth [27,28].The band anticrossing (BAC) model[29,30] based on the Green’s function calculation [31,32] has been proposed to elucidate the large band-gap bowing and the broadening of the emission linewidth. Additionally, the transfer of excitons among the Te localized sites in ZnSe1−xTex with a low Te concentration has been studied [28]. The
self-trapped excitons that are bound to various isoelectronic centers (ICs) dominate the optical properties of ZnSeTe. Akimova et al. utilized cathodoluminescence to obtain direct experimental evidence of Te-bound emissions [33].
Of all of the fascinating optical properties, however, little attention has been paid to the decay dynamics of isoelectronic ZnSeTe semiconductors. Chapter 6 will discuss in detail the decay dynamics of isoelectronic traps in ZnSe1-xTex semiconductor alloys.
1.3 Electronic Energy Transfer in Semiconductor Nanocrystals
In addition to semiconductor heterostructures, highly luminescent colloidal quantum dots (QDs) or semiconductor nanocrystals (NCs) are attracting increasing interest in science, with potential for use in diverse fields, including light-emitting diodes [34], photodetectors [35], biosensing [36], and biolabeling [37]. Very recently, increasing research effort has been devoted to the new generation of solar cells which contain NCs as active materials [38-40]. Colloidal QDs are easily synthesized with low energy and material consumption [41]. They are perfect building blocks for controlled nano assemblies on a molecular scale, such as spatially ordered structures [42] or colloidal supercrystals [43]. The typical length scale of QDs is responsible for chemical and physical properties that differ markedly from those of both their bulk and molecular counterparts. The properties of QDs depend on their size, shape and surface effects. Over the last two decades, extensive studies that have applied optical techniques to CdSe QDs.
Energy transfer between semiconductor NCs has attracted substantial interest in recent years [44-51]. Förster resonance energy transfer (FRET) is a nonradiative process that is driven by dipole–dipole interactions [52-54]. The efficiency of FRET depends on the degree of spectral overlap between the emission spectrum of the donor and the absorption spectrum of the acceptor, and on the sixth power of the separation between the donor and acceptor pair. The rate of nonradiative energy transfer according to the Förster theory is given by the formula [54], 6 0 1 T D R k r τ ⎛ ⎞ ⎛ ⎞ =⎜ ⎟ ⎜× ⎟ ⎝ ⎠ ⎝ ⎠ , (1) where τD represents the excited-state radiative lifetime of the donor in the absence of transfer
and R0 is the Förster critical radius. R0 (in angstrom) is given by
( ) ( )
16 2 4 4 0 0.2108 D 0 D A R = ⎡κ Φ n− ∞I λ ε λ λ λd ⎤ ⎢ ⎥ ⎣∫
⎦ , (2)where κ2 is the orientational factor and depends on the relative orientation of the donor and acceptor dipoles. The values of κ2 range from 0 (perpendicular) to 4 (collinear). ΦD denotes
the fluorescence quantum yield of the donor in the absence of transfer; n is the average refractive index of the medium in the wavelength range where spectral overlap is significant;
ID(λ) is the fluorescence spectrum of the donor normalized such that
( )
0 ID λ λd 1 ∞
=
∫
; εA(λ) isthe molar absorption coefficient of the acceptor, and λ is the wavelength in nanometers. The transfer efficiency is given by
(
)
6 0 1 1 1 T T D T k k r R τ Φ = = + + . (3) According to Eq. (3), the dipole-dipole coupling mechanism is most sensitive to the donor-acceptor distance when this distance is comparable to the Förster critical radius. The characteristics of FRET can be adopted as a “spectroscopic ruler” [55]. FRET has been widely employed in vivo and in vitro biological studies, such as the monitoring of DNA hybridization and sequencing, protein conformation studies, and diffusion dynamics [55].In contrast, radiative transfer is a two-step process: an acceptor absorbs a photon that is emitted by a donor. This process occurs when the average distance between the donor and acceptor exceeds the wavelength. Such a transfer does not involve any interaction between particles. Radiative transfer results in a decrease of the donor fluorescence intensity in the region of spectral overlap. The fraction a of photons emitted by donors and absorbed by acceptors is given by
( ) ( )
0 2.3 A D A D a= C l ∞I λ ε λ λd Φ∫
, (4) where CA is the molar concentration of acceptors [54].The FRET process in semiconductor nanocrystals has recently attracted great interest. Bawendi’s group was the first to demonstrate the FRET process between close-packed CdSe
QDs [44,45].Crooker et al. elucidated FRET dynamics in monodisperse, mixed-size, and layered assemblies of CdSe/ZnS QDs using time-resolved and spectrally-resolved PL [46]. They all found an enhancement in luminescence and lifetime of the acceptor that was accompanied by a reduction of both of the donor. These phenomena are direct evidence of energy transfer from small to large QDs, eliminating the reabsorption effect, which would not increase the decay rate from small QDs. Very recently, Feldmann’s group also studied the cascaded FRET in a funnel-like structure and FRET in layer-by-layer assemblies of CdSe and water-soluble CdTe QDs [47-51]. The FRET process in an aqueous solution of QDs, which holds much promise for use in biological studies, is limited by the inter-dot distance and the spectral overlap between the donor emission and the acceptor absorption. Chapter 7 compares in detail the electronic energy transfer behavior of mixed CdTe QDs solution with that of the solid using time-resolved and spectrally-resolved PL.
References
[1] S. T. Weir, Y. K. Vohra, and A. L. Ruoff, Phys. Rev. B 35, 874 (1987).
[2] R. Reichlin, K. E. Brister, A. K. McMahan, M. Ross, S. Martin, Y. K. Vohra, and A. L. Ruoff, Phys. Rev. Lett. 62, 669 (1989).
[3] K. A. Goettel, J. H. Eggert, and I. F. Silvera, Phys. Rev. Lett. 62, 665 (1989).
[4] H. Luo, S. Desgreniers, Y. K. Vohra, and A. L. Ruoff, Phys. Rev. Lett. 67, 2998 (1991). [5] S. Desgreniers, Y. K. Vohra, and A. L. Ruoff, J. Phys. Chem. 94, 1117 (1990).
[6] H. K. Mao and R. J. Hemley, Rev. Mod. Phys. 66, 671 (1994).
[7] S. T. Weir, A. C. Mitchell, and W. J. Nellis, Phys. Rev. Lett. 76, 1860 (1996). [8] H. K. Mao and R. J. Hemley, Science 244, 1462 (1989).
[9] C. Narayana, H. Luo, J. Orloff, and A. L. Ruoff , Nature 393, 46 (1998). [10] P. Loubeyre, F. Occelli, and R. LeToullec, Nature 416, 613 (2002).
[11] J. A. Tuchman, S. Kim, Z. Sui, and I. P. Herman, Phys. Rev. B 46, 13371 (1992). [12] P. L. Smith and J. E. Martin, Phys. Lett. 19, 541 (1965).
[13] G. Itkin, G. R. Hearne, E. Sterer, M. P. Pasternak, and W. Potzel, Phys. Rev. B 51, 3195 (1995).
[14] S. Ves, K. Strössner, N. E. Christensen, C. K. Kim, and M. Cardona, Solid State Commun. 56, 479 (1985).
[15] A. K. Arora, D. U. Bartholomew, D. L. Peterson, and A. K. Ramdas, Phys. Rev. B 35, 7966 (1987).
[16] A. K. Arora and T. Sakuntala, Phys. Rev. B 52, 11052 (1995).
[17] C. M. Lin, D. S. Chuu, T. J. Yang, W. C. Chou, J. Xu, and E. Huang, Phys. Rev. B 55, 13641 (1997).
[18] C. S. Yang, C. S. Ro, W. C. Chou, C. M. Lin, D. S. Chuu, J. Hu, E. Huang, and J. Xu, J. Appl. Phys. 85, 8092 (1999).
[19] C. M. Lin, D. S. Chuu, J. Xu, E. Huang, W. C. Chou,, J. Hu, and J. Pei, Phys. Rev. B 58, 16 (1998).
[20] C. S. Yang, W. C. Chou, D. M. Chen, C. S. Ro, J. L. Shen, and T. R. Yang, Phys. Rev. B 59, 8128 (1999).
[21] A. Mujica, A. Munoz, and R. J. Needs, Rev. Mod. Phys. 75, 863 (2003), and references therein.
[22] W. Czaja, in Festkörprobleme XI, edited by M. O. Madelung (Pergamon, Oxford, 1971), pp. 65–85.
[23] D. G. Thomas and J. J. Hopfield, Phys. Rev. 150, 680 (1966).
[24] P. J. Dean and D. C. Herbert, in Excitons, edited by K. Cho (Springer, Berlin, 1979), pp. 55–182.
[25] J. J. Hopfield, D. G. Thomas, and R. T. Lynch, Phys. Rev. Lett. 17, 312 (1966).
[26] S. P. Ahrenkiel, S. H. Xin, P. M. Reimer, J. J. Berry, H. Luo, S. Short, M. Bode, M. Al-Jassim, J. R. Buschert, and J. K. Furdyna, Phys. Rev. Lett. 75, 1586 (1995).
[27] M. J. S. P. Brasil, R. E. Nahory, F. S. Turco-Sandroff, H. L. Gilchrist, and R. J. Martin, Appl. Phys. Lett. 58, 2509 (1991).
[28] D. Lee, A. Mysyrowicz, A. V. Nurmikko, and B. J. Fitzpatrick, Phys. Rev. Lett. 58, 1475 (1987).
[29] W. Walukiewicz, W. Shan, K. M. Yu, J. W. Ager III, E. E. Haller, I. Miotkowski, M. J. Seong, H. Alawadhi, and A. K. Ramdas, Phys. Rev. Lett. 85, 1552 (2000).
[30] W. Shan, W. Walukiewicz, J. W. Ager III, E. E. Haller, J. F. Geisz, D. J. Friedman, J. M. Olson, and S. R. Kurtz, Phys. Rev. Lett. 82, 1221 (1999).
[31]J. Wu, W. Walukiewicz, K. M. Yu, J. W. Ager III, E. E. Haller, I. Miotkowski, A. K. Ramdas, Ching-Hua Su, I. K. Sou, R. C. C. Perera, and J. D. Denlinger, Phys. Rev. B 67, 035207 (2003).
[32] J. Wu, W. Walukiewicz, and E. E. Haller, Phys. Rev. B 65, 233210 (2002).
[33] I. V. Akimova, A. M. Akhekyan, V. I. Kozlovsky, Yu. V. Korostelin, and P. V. Shapin, Sov. Phys. Solid State 27, 1041 (1985).
[34] S. Coe, W. K. Woo, M. Bawendi, and V. Bulovic, Nature 420, 800 (2002).
[35] A. Biebersdorf, R. Dietmüller, A. S. Susha, A. L. Rogach, S. K. Poznyak, D. V. Talapin, H. Weller, T. A. Klar, and J. Feldmann, NanoLett 6, 1559 (2006).
[36] A. P. Alivisatos, Nat. Biotechnol 22, 47 (2004).
[37] X. Michalet, F. F. Pinaud, L. A. Bentolila, J. M. Tsay, S. Doose, J. J. Li, G. Sundaresan, A. M. Wu, S. S. Gambhir, and S. Weiss, Science 307, 538 (2005).
[38] I. Gur, N. A. Fromer, M. L. Geier, and A. P. Alivisatos, Science 310, 462 (2005).
[39] I. Robel, V. Subramanian, M. Kuno, and P. V. Kamat, J. Am. Chem. Soc. 128, 2385 (2006).
[40] P. V. Kamat, J. Phys. Chem. C 111, 2834 (2007).
[41] A. L. Rogach, T. Franzl, T. A. Klar, J. Feldmann, N. Gaponik, V. Lesnyak, A. Shavel, A. Eychmüller, Y. P. Rakovich, and J. F. Donegan, J. Phys. Chem. C 111, 14628 (2007).
[42] A. A. Mamedov, A. Belov, M. Giersig, N. N. Mamedova, and N. A. Kotov, J. Am. Chem. Soc. 123, 7738 (2001).
[43] A. L. Rogach, D. V. Talapin, E. V. Shevchenko, A. Kornowski, M. Haase, and H. Weller, Adv. Funct. Mater. 12, 653 (2002).
[44] C. R. Kagan, C. B. Murray, M. Nirmal, and M. G. Bawendi, Phys. Rev. Lett. 76, 1517 (1996).
[45] C. R. Kagan, C. B. Murray, and M. G. Bawendi, Phys. Rev. B 54, 8633 (1996).
[46] S. A. Crooker, J. A. Hollingsworth, S. Tretiak, and V. I. Klimov, Phys. Rev. Lett. 89, 186802 (2002).
84, 2904 (2004).
[48] T. Franzl, S. Schietinger, A. L. Rogach, and J. Feldmann, Nano Lett. 4, 1599 (2004). [49] T. Franzl, A. Shavel, A. L. Rogach, N. Gaponik, T. A. Klar, A. Eychmüller, and J. Feldmann, Small 1, 392 (2005).
[50] V. K. Komarala, A. L. Bradley, Y. P. Rakovich, S. J. Byrne, Y. K. Gun’ko, and A. L. Rogach, Appl. Phys. Lett. 93, 123102 (2008).
[51] D. Gross, A. S. Susha, T. A. Klar, E. D. Como, A. L. Rogach, and J. Feldmann, Nano Lett. 8, 1482 (2008).
[52] T. Förster, in Comparative Effects of Radiation, edited by M. Burton, J. S. Kirby-Smith, and J. L. Magee (Wiley, New York, 1960), p. 301.
[53] D. L. Andrews and A. A. Demidov, Resonance Energy Transfer, (Wiley, Chichester, U.K., 1999).
[54] B. Valeur, Molecular Fluorescence: Principles and Applications, (Wiley, New York, 2002).
[55] J. R. Lakowicz, Principles of Fluorescence Spectroscopy, 2nd Ed., (Kluwer Academic,
Chapter 2 Experimental Details
This chapter elucidates experimental approaches for the use of the diamond-anvil cell, and for performing Raman scattering studies of phase stability and electronic transition in ZnCdxSe1-x, ZnMnxTe1-x, and chlorine-doped ZnSe epilayers. The photoluminescence and
time-resolved photoluminescence optical setups for examining ZnSe1-xTex epilayers and CdTe
colloidal quantum dots are also depicted. Section 2.1 describes in detail the diamond-anvil cell that is adopted herein and the related techniques. Section 2.2 describes the optical spectroscopy, Raman scattering, photoluminescence, and time-resolved photoluminescence.
2.1 High-Pressure Techniques
I. Diamond Anvil Cell
The diamond-anvil cell (DAC) is currently the most popular instrument for studying materials under static high pressure. It has revolutionized high-pressure research, not only because it can easily reach the pressures that exist close to the center of the earth, but also because it allows the use of various measurement methods for the study of matter under such conditions. Before the DAC was developed, high-pressure studies of materials were conducted mostly using large hydraulic presses [1]. Although such hydraulic presses commonly occupy a full room and weigh several tons, they generate maximum pressures of only a few hundred kilobars (1 kbar = 0.1 GPa). In contrast, the modern DAC fits in the palm of one’s hand and gives laboratory access to very high static pressures in a relatively easy and safe manner, allowing experimental measurements to be made at pressures above 100 GPa.
The DAC was first developed by J. C. Jamieson et al. [2] and Weir et al. [3] in 1959. Figure 2.1 presents the components of the diamond anvil cell. In Fig. 2.1(a), “A” denote the
hemispherical rockers on which the diamond anvil is mounted, “B” are the diamonds and “C” represents the gasket. The force is applied by turning the screws shown in Fig. 2.1(b), pressing together the two opposing diamonds. A uniform pressure is thus continuously applied as the screw is rotated.
The principles on which all types of high-pressure cells are based are similar. A force F is applied to a small surface of area A, generating a pressure P = F/A, which can be increased by reducing the size of the area of contact. The anvil flat (culet) is typically set parallel to the (100) or (110) plane of the diamond. The culet is removed by grinding a flat, octagonal surface with a vertex-to-opposite- vertex distance of approximately 0.10 to 0.60 mm; diamonds are typically sized from 1/8 to 1/2 carat. The DAC used herein is 1/3 carat and the cutlet has a diameter of 0.50 mm.
The selection of diamonds and their sizes depends on the type of DAC and the purpose of the investigation. Diamonds are classified into two types based on their UV excited fluorescence and their IR absorption spectra. Type I diamonds contain nitrogen impurities, and Type II are relatively pure and rare in nature. Both types are subdivided into (a) and (b) subgroups. Type I (a) diamonds contain nitrogen impurities in pairs or larger aggregates, and Type I (b) diamonds contain single substitution impurities. Type II (a) are regarded as pure and Type II (b) contain boron impurities, and are commonly semiconducting. Diamonds with very low fluorescence should be adopted for light scattering studies in the DAC. Type II diamonds typically have lower fluorescence. The selected Type I diamonds have low fluorescence and are used for both Raman and photoluminescence measurements because of their plentiful supply and low cost. Type II diamonds are required for infrared absorption measurements in the range 6 to 13 μm [4,5].
In the DAC, the sample is placed between the flat faces (culets) of two brilliant-cut diamonds. The culets are separated by a thin metallic foil (gasket) which has previously been
indented by the diamonds. In the middle of the indented zone a small hole forms the pressure chamber into which the sample is placed. The sample is usually immersed in a fluid, which fills the chamber and acts as a pressure medium, maintaining hydrostatic and homogeneous conditions. The deformation and eventual fracture of the material that forms the pressure device limits the generation of very high pressures. The DAC can generate very high pressures because of the exceptional hardness of diamond, but even high-quality diamonds shatter under sufficiently high loads. The transparency of diamond over a wide range of frequencies from the near ultraviolet (~ 5.5 eV) to the infrared is the most important property, which is exploited in optical measurements.
II. Metallic Foil (Gasket)
The introduction of a metal gasket to contain the pressure medium is key to the generation of hydrostatic pressure in the DAC. Early work on the operation of DAC was conducted on solids that were pressed between a pair of diamonds without the use of a gasket. This setup provided a seriously non-hydrostatic environment for the solids. Accordingly, a gasket must be introduced into the DAC apparatus, to make it an effective tool for high-pressure research.
The metal gaskets not only prevent the damage to the diamonds but also maintain hydrostatic conditions for samples surrounded with a pressure medium. The hydrostatic state is highly desirable because a non-hydrostatic environment prevents precise control of the pressure, and makes measurements difficult to make. The gasket with a hole (~ 150 μm in diameter) in the center of the indentation zone (~ 500 μm, depending on the culet of the diamonds) is drilled using an electric discharge machine. As shown in Fig. 2.2, typical gaskets have a thickness of about 0.3 mm, reduced to approximately 0.1 mm in the indented zone. The gasket is placed on the lower diamond culet, and then samples and ruby chips are loaded
into the hole. Then, the hole is filled with pressure medium and sealed immediately by covering the upper anvil.
III. Pressure Medium
The pressure-transmitting medium markedly affects conditions within the sample chamber. Samples and ruby chips in the sample chamber must be maintained under hydrostatic conditions by the use of an appropriate pressure-transmitting medium. Ideally, the medium should remain fluid at high pressure; however, at high enough pressures, all materials solidify and develop shear strength, producing non-hydrostatic conditions. Piermarini et al. discovered that a mixture of four parts methanol to one part ethanol by volume is a good pressure medium for hydrostatic experiments [6]. Fluids such as 4 : 1 methanol - ethanol mixture, 16 : 3 : 1 methanol - ethanol - water, and deionized water [7] are widely used to make high-pressure measurements. Moreover, helium, nitrogen, hydrogen, argon, and xenon are excellent pressure transmitters [8-11], and are usually used in the Mbar (1 GPa ~ 104 bar) range and at cryogenic temperatures. However, they require the use of cryogenic or high-pressure gas loading techniques which complicate the experimental setup.
In the experiments herein, deionized water or 4 : 1 methanol – ethanol mixture was utilized as the pressure medium. Although water is considered to be a bad pressure medium because it transforms to ice VI and VII at 0.6 and 2.1 GPa, respectively, Lin et al. demonstrated that the R1-R2 splitting in ruby fluorescence was maintained up to 36 GPa [7]. Therefore, deionized H2O seems to be a suitable pressure medium for high-pressure study.
IV. Pressure Calibration
The use of the fluorescence of ruby for pressure calibration was a breakthrough in the development of the DAC. Before that time, pressure in the DAC was estimated using many
methods including directly calculating force per unit area [12], relying on the well-established freezing points of numerous liquids or the known “fixed points” of various solid-solid phase transitions [13], and, in X-ray studies, recording the lattice constant of internal markers such as NaCl or silver [14]. These methods commonly proved to be either inconvenient or inaccurate [15].
Forman et al. initially calibrated the shift in the R-line ruby fluorescence peaks as a function of pressure in the DAC, and demonstrated that this shift could be used as a convenient internal pressure-calibrator [15]. Ruby consists of Al2O3 that is doped with Cr2O3, in which some of the Al3+ ions are replaced by Cr3+. Although the full site symmetry is C3v, the crystal field is dominated by its cubic component, splitting the states of the Cr3+ ion, forming an A-symmetric quartet ground state and a doubly degenerate first-excited state with E-symmetry, as displayed in Fig. 2.3. The combined effects of the trigonal field and spin-orbit coupling further splits the first excited into E3/2 and E1/2 states such that they are separated by 3.6 meV [16]. The electronic transitions E1/2 → A and E3/2 → A give rise to the R1 line at 6942 Å and the R2 line at 6928 Å. These R-lines are the active transitions in a ruby laser. Using X-ray diffraction, Barnett et al. [16,17] measured the unit volume of NaCl while concurrently monitoring the ruby fluorescence. They found that the R-lines shift linearly to longer wavelength as the pressure increased, and demonstrated that this linear relation holds up to 30 GPa with an accuracy of 3 %. The accepted value for the ruby R-line shift in this pressure range is 3.65 Å / GPa or -7.53 cm-1 / GPa. Above 30 GPa, nonlinear terms in the pressure-dependence of the R-line frequencies become important. Mao and Hemley have shown that a more accurate relation [18,19] for the R1-line shift is
0 ( ) 1 1 . B A P GPa B λ λ ⎡⎛Δ ⎞ ⎤ ⎢ ⎥ = ⎜ + ⎟ − ⎢⎝ ⎠ ⎥ ⎣ ⎦ (1)
wavelength of the ruby R1 line at ambient pressure. The inaccuracy of Eq. 1 is about 5 % below 1 Mbar and probably at least around 10 % above 2 Mbar. Figure 2.4 plots the R-line wavelength shift as a function of pressure. The circles represent the experimental results from the X-ray studies of Hemley et al. [19], the solid [20] and dashed [21] lines represent the experimental results from the X-ray studies of Mao et al.. The dotted line plots the results of Aleksandrov et al. [22]. Figure 2.5 exhibits the pressure-dependent R-lines up to 25.4 GPa at room temperature.
The ruby lines are also sensitive to temperature and shift to longer wavelength as the temperature increases, but this dependence is substantially weaker (d 0.068
dT
λ
= Å / oC) than
the dependence on pressure [23,24]. Hence, below 30 GPa, the linear R-line pressure scale holds well at any temperature from 300 K down to 4.2 K, with the rate of the pressure shift essentially constant over this range of temperatures. The thermal population of R2 and R1 follows Boltzman statistics, and consequently the intensity ratio R2 to R1 declines sharply as the temperature decreases, when kT is of the order of the R2-R1 splitting. Weinstein demonstrated that this property of the intensity ratio allows the R-lines also to be used as an in-situ thermometer in the DAC with reasonable accuracy over 10 – 100 K [25].
V. Sample Preparation
The thin-film samples studied herein were all grown on semi-insulating GaAs substrates. However, the presence of thick GaAs substrate may affect the transition pressure of each thin crystal. The final conclusions and the transition pressure may include some systematic errors, because the strain is not uniform. Moreover, if GaAs remains, precisely determining the semiconductor-to-metal phase transition pressure (whether the thin crystal becomes opaque at high pressure) is rather difficult. For these reasons, before the sample was loaded into the diamond cell, the GaAs substrates had already been removed from all of the samples by
mechanical polishing and then were chemically etched using H2O : H2O2 : NaOH = 30 ml : 21 ml : 4 g. Therefore, the intense Raman singles from GaAs at 267 and 292 cm-1 for TO and LO, respectively, were absent.
References
[1] H. G. Drickamer and A. S. Balchan, in Modern Very High Pressure Techniques, edited by R. H. Wentorf, Jr. (Butterworths, Washington, DC, 1962), p. 25.H.
G. Drichamer, Rev. Sci. Instrum. 32, 212 (1961).
[2] J. C. Jamieson, A. W. Lawson, and N. D. Nachtrieb, Rev. Sci. Instrum. 30, 1016 (1959). [3] C. E. Weir, E. R. Lippincott, A. van Valkenburg, and E. N. Bunting, J. Res. Natl. Bur. Stand., Sect. A 63, 55 (1959).
[4] C. D. Clark, in Physical Properties of Diamond, edited by R. Berman (Clarendon, Oxford, 1965) p. 295; G. Davies, in Chemistry and Physics of Carbon, edited by P. W. Phillips and P. A. Turner (Dekker, New York, 1977). Vol. 13, p. 10.
[5] R. J. Wijingaaden and I. F. Silvera, in High Pressure Science and Technology, edited by B. Vodar and P. H. Martean (pergamon, Oxford), 1, 157 (1980).
[6] G. J. Piermarini, S. Block, and J. D. Barnett, J. Appl. Phys. 44, 5377 (1973).
[7] C. M. Lin, D. S. Chuu, T. J. Yang, W. C. Chou, J. Xu, and E. Huang, Phys. Rev. B 55, 13641 (1997).
[8] P. M. Bell and H. K. Mao, in Carnegie Institution of Washington Year Book 80, 404 (1981).
[9] H. K. Mao and P. M. Bell, in Carnegie Institution of Washington Year Book 78, 663 (1979).
[10] K. Asaumi and A. L. Ruoff, report #5531, Mater. Sci. Center, Cornell University [11] H. K. Mao, J. Xu, and P. M. Bell, J. Geophys. Res. Jamieson Volume (1980). [12] S. Block, C. E. Weir, G. J. Piermarini, Science 169, 586 (1970).
[13] H. G. Drickamer, Rev. Sci. Instrum. 41, 1667 (1970).
[14] W. A. Bassett, T. Takahashi, H. K. Mao, J. Appl. Phys. 39, 319 (1968).
[16] J. D. Barnett, S. Block, and G. J. Piermarini, Rev. Sci. Instrum. 44, 1 (1973).
[17] G. J. Piermarini, S. Block, J. D. Barnett, and R. A. Forman, J. Appl. Phys. 46, 2774 (1975).
[18] H. K. Mao, J. Xu, and P. M. Bell, Journal of Geophysics Research, 91, 4620 (1986). [19] R. J. Hemley, C. S. Zha, A. P. Jephcoat, H. K. Mao, L. W. Finger, and D. E. Cox, Phys. Rev. B 39, 11820 (1989).
[20] H. K. Mao, P. M. Bell, J. W. Shaner, and D. J. Steinberg, J. Appl. Phys. 49, 3276 (1978). [21] H. K. Mao, J. A. Xu, and P. M. Bell, Journal of Geophysics Research, 91, 4673 (1986). [22] I. V. Aleksandrov, A. F. Goncharov, A. N. Zisman, and S. M. Stishov, Zh. Eksp. Teor. Fiz. 93, 680 (1987) [Sov. Phys. JETP 66, 384 (1987)].
[23] D. M. Adams, R. Appleby, and S. K. Sharma, J. Phys. E 9, 1140 (1976).
[24] T. H. Huang, C. C. Hsu, C. T. Kuo, P. Lu, W. S. Tse, D. P. Wang, T. C. Chou, and A. Y. G. Fuh, J. Appl. Phys. 75, 3599 (1994).
FIG. 2.1. (a) Schematic depiction of diamond anvil cell (DAC).
FIG. 2.3. Energy levels of Cr3+ in Al2O3. The transitions E1/2 → A and E3/2 → A yield R1 and R2 lines, respectively.
2.2 Optical Spectroscopy
I. Introduction to Raman Scattering
All of the Raman parameters, such as frequencies, peak intensity, lineshape, linewidth, and polarization behavior, can be applied to characterize the lattice, impurities and free carriers in semiconductors. Intensity yields information about crystallinity. Raman phonon frequencies can reveal the composition of elements in a ternary material. The linewidth increases when a material is damaged or disordered because of phonon damping or changes to the selection rules.
Raman scattering is the interaction of the incident light with optical phonons. When the polarization of a phonon is transverse (longitudinal) relative to the wavevector of incident light, it is described as being in the TO (LO) mode. In terms of the corpuscular theory of light, Rayleigh scattering corresponds to an elastic collision process between the phonon and the crystal, whereas Raman scattering corresponds to an inelastic collision in which the phonon either loses one or more quanta (Stokes shifts) or acquires one or more quanta (anti-Stokes shifts). Figure 2.6 plots the transition associated with Rayleigh scattering, first-order Stokes scattering, and anti-Stokes scattering. As shown in Fig. 2.6, νi
(Ki) is the frequency (wavevector) of incident photon, νs (Ks) is the frequency (wavevector)
of the scattered phonon, and νo (Ko) represents the frequency (wavevector) of the optical
phonon that is involved in the scattering process. Energy and momentum are conserved between the initial and final states of the system. The conservation conditions are
hνs = hνi ± hνo (2)
Ks = Ki ± Ko (3)
where the plus sign refers to an anti-Stokes shift and the minus sign stands for Stokes shift. However, the conditions for Rayleigh scattering are νi = νs and Ki = Ks. Generally, the
Raman scattering is inherently a weak process, but lasers provide sufficient power to enable the spectra to be routinely measured.
II. Micro-Raman and Micro-PL Systems
Figure 2.7 depicts the experimental setup of the micro-Raman (PL) measurements which were made using a Jobin-Yvon microscope system. Raman and PL spectra were obtained at room temperature and collected in the backscattering configuration using 514.5 or 488.0 nm lines of an Ar+-ion laser as the excitation source. An incident beam from an argon-ion laser was focused to about 5 μm in diameter on the sample using a 20x long-working-distance (~ 20 mm) microscope objective.
To eliminate Rayleigh scattering, a 514.5 or 488.0 nm holographic super notch plus filter was used to filter it out of the laser. The spectra were analyzed using a SPEX 1404 double grating 0.85 m spectrometer that was equipped with a multichannel LN2-cooled charge-coupled device (CCD). The spectrometer was controlled using a computer, which was used to store and plot the collected data.
III. Time-Resolved PL System
Figure 2.8 presents the experimental setup of the time-resolved PL (TRPL) system. The 300 ps GaN pulsed laser diode (405 nm / 2.5 MHz) and a 200 fs mode-locked Ti:sapphire laser (400 nm / 76 MHz) were used as an excitation source. The laser light is focused on the sample by a convex lens (L1). The combination lenses (L2 and L3) guide the luminescence into the spectrometer. The signal is dispersed using a SPEX 1403 double-grating 0.85 m spectrometer and detected using a high-speed photomultiplier tube. The signal is further analyzed by a computer with a plug-in time-correlated counting card.
Chapter 3 Pressure-Dependent Raman Scattering and
Photoluminescence of Zn
1–xCd
xSe
This chapter discusses Raman and photoluminescence of cubic Zn1–xCdxSe (0 ≦ x ≦
0.32) epilayers at high pressure. The impurity mode I observed in the phonon Raman spectra at low temperature confirms the intermediate phonon mode behavior. A split transverse optical phonon mode was found in the down-stroke high-pressure Raman scattering. Additionally, the pressure-dependent longitudinal optical phonon frequencies and the Grüneisen parameter were obtained by quadratic polynomial fitting. Pressure-driven resonant Raman scattering effect was observed in samples with a high Cd concentration (x ≧ 0.18). The pressure at the onset of semiconductor-to-metal phase transition (Pt) decreases as the Cd content increases. As the Cd concentration increases from 0 to 0.32, Pt falls from 13.6 to 9.4 GPa, according to Pt (GPa) = 13.6 – 6.8x – 20.3x2.
I. Introduction
Wide-band-gap II-VI ternary compound semiconductor, Zn1–xCdxSe, has attracted much
attention because its tunable band gap covers the visible spectrum. The physical properties of Zn1–xCdxSe have been extensively studied over the last decade because the material is
extensively employed as an active layer in ZnSe-based laser diodes [1-4]. The crystal structure of bulk Zn1–xCdxSe is zincblende (ZB) for x < 0.3, wurtzite for x > 0.7, and is a
mixture of both for 0.3 ≦ x ≦ 0.7 [Ref. 5 and 6]. A single-phase ZB crystalline structure over the entire Cd composition range from ZnSe to CdSe [6-8] can be grown on (001) GaAs substrates by molecular beam epitaxy (MBE). Furthermore, the energy-dispersive X-ray diffraction (EDXD) and Raman scattering of ZnSe-based II-VI ternary compounds
[9-12] were investigated at high pressure to study the phase transformations. However, the pressure-induced phase transition and the crystal stability of ZB Zn1–xCdxSe epilayers
under hydrostatic pressure still remain unexplored. The phase transitions from semiconductor to metal and the ZB (B3 phase) to rocksalt (RS), (B1 phase), were found to be consistent with the disappearance of the LO phonon from the Raman spectra [10-13].
This work discusses the phonon Raman and photoluminescence (PL) spectra of ZB Zn1–xCdxSe epilayers (x = 0, 0.06, 0.11, 0.18, 0.25, and 0.32) at room temperature and high
pressures. The optical phonon mode behavior, pressure-dependent LO phonon frequencies, LO phonon line broadening, the splitting of the TO mode in the down-stroke pressurized process and the Grüneisen parameter (γLO) of Zn1–xCdxSe epilayers were determined.
Moreover, samples with a high (x ≧ 0.18) Cd content exhibit pressure-driven resonant Raman scattering (RRS) enhancement. Additionally, the pressure at the onset of semiconductor-to-metal phase (Pt) transition was plotted as a function of Cd content (x).
II. Experiment
The Zn1–xCdxSe epilayers (x = 0, 0.06, 0.11, 0.18, 0.25 and 0.32) were grown on
semi-insulating GaAs (001) substrates with a Veeco Applied EPI 620 MBE system using Zn (6N purity), Se (6N purity) and Cd (6N purity) solid sources. The substrate temperature was maintained at 300 oC, and the thickness of the Zn1–xCdxSe epilayers was fixed at around 0.5
μm. The Cd content was determined by energy-dispersive X-ray (EDX) analysis.
High-pressure measurements were taken in a gasket diamond anvil cell (DAC). The culets of the diamond anvils are 500 μm in diameter. The sample chamber was a circular hole with a diameter of about 170 μm, which was predrilled on the stainless steel gasket using an electrical discharge machine. A methanol-ethanol 4:1 mixed liquid was used as a pressure-transmitting medium in order to maintain the hydrostatic conditions. The hydrostatic
pressure was determined by the spectral shift of the ruby R1 line, which is widely used in high-pressure Raman and PL measurements [14,15]. The pressure gradient was less than 0.5 GPa, as determined by measurements made at various positions of the sample chamber. Before the Zn1–xCdxSe sample was loaded into the DAC, the GaAs substrate was removed by
mechanical polishing and chemical etching with H2O : H2O2 : NaOH = 30 ml : 21 ml : 4 g. Raman and PL spectra were performed at room temperature and collected in backscattering configuration using a 514.5 nm line of an Ar+-ion laser as the excitation source. The spectra were analyzed by a SPEX 1404 double grating spectrometer equipped with a multichannel LN2-cooled charge-coupled device (CCD). The 514.5 nm holographic notch filter was used to filter out the Rayleigh scattering.
III. Results and Discussion
Figure 3.1 presents the first-order Raman spectra of Zn1–xCdxSe (x = 0, 0.06, 0.11, 0.18,
0.25, and 0.32) epilayers. The spectra were all obtained at room temperature and ambient pressure under (z x y x y z+ , + ) backscattering geometry. The Raman selection rule for this geometry forbids the TO and allows the emission of LO only. However, a weak TO feature which appears at 205.4 , 203.3, and 201.6 cm-1 for x = 0, 0.06, and 0.11 samples, respectively, can be attributed to a slight deviation from perfect backscattering geometry. Table 3.1 presents the LO and TO phonon frequencies and the linewidth of the LO phonons of all Zn1–xCdxSe
samples. As the Cd content increases, the LO and TO phonon frequency decreases. Asymmetric broadening of the peaks of the LO phonon at high Cd content (x ≧ 0.18) is observed, attributed primarily to the disorder of the alloy [16], and becomes more evident under pressure. Figure 3.2 shows the dependence of LO phonon frequencies and the full width at half maximum (FWHM) on the Cd concentration (x), respectively. The LO phonon frequency falls as x increases, and is accompanied by an increase in FWHM.