Proceedings of the 25" Annual lntemational Conference of the IEEE EMBS Cancun, Mexico September 17-21,2003
The phenomenon of Breathing Pattern yf Weaning for Success and Failure Groups
MengLun Hsueh', Jen-Chien Chien
,
Fok-Ching Chong', Huey-Dong Wu?
'Institute of Electrical Engineering, National Taiwan University, Taiwan, R.0.C *National Taiwan University Hospital
Abstract- Weaning the discontinuation of mechanical ventilator, it can be regarded as a stress processll]. It will trigger central neural feedback response to maintain the balance of our body and environments. This phenomenon is usually easily observed in breathing pattern. Weaning will caused a rhythmic change in breathing pattern. We collect data before and after weaning, weaning success and weaning failure in clinical environment. Statistical analysis methods are used to investigate this rhythm change. It also provides valuable information about respiratory system. In this paper, we showed that there is obviously difference in normalized standard deviation of after weaning data minus before weaning data between weaning success and weaning failure groups. The success groups also have lower value (bellow to zero) in after minus before weaning data than failure groups. In frequency domain, we find there is obviously difference in weaning success and weaning failure groups in total power of inspiratory time spectrum (p value=0.028). The result obtains in the time and frequency domain is the same. However, the third frequency peak power amplitude of the
spectrum has the same result (p value=0.021). This
phenomenon in breathing pattern may be used a s a good weaning index to predict weaning success and failure.
Keywords
-
mechanical ventilator, rhythmic change, weaning, breathing patternI. INTRODUCTION
Recently, mechanical ventilation is widely used in Intensive Care Unit and plays an important role in lifesaving. However, it may be associated with numerous complications. It should be discontinued as soon as possible. Many weaning indices
have been developed to predict the successful
discontinuation of mechanical ventilator. However,
determination of the optional time to discontinue ventilator support can be very difficult. The existing weaning indexes include breathing pattern, arterial blood gas and lung mechanisms. With the help for these weaning indexes, the reintubation rate (weaning failure) still range form 7 to 19%
and patients of weaning failure also have high mortality [2].
Analyzing breathing pattern can provide valuable information about respiratory system. In a patient with intact respiratory center (preserved brain stem function), which is as usual in most patients, respiratory center output is most closely associated to patients stress and physiologic condition. Many weaning parameters, such as frequency, tidal volume, rapid shallow breathing index, are related to respiratory center output.
Attention has been focused on the pattern of breathing as a guide to weaning outcome, i.e. respiratory frequency, tidal volume and rib cage-abdominal motion. It is suggested that respiratory muscle fatigue might be a primary course of failure to weaning
e ].
Patients who failed a waning trail0-7803-7789-3/03/$17.00 02003
IEEE
had considerable breathto-breath variation in relative contribution of the rib cage and abdomen to tidal volume [ 31.
Many methods have been used to analyze breathing pattern and respiratory central output. The most f a m u s one is the rapid shallow index that can predict better weaning outcome. An elevated respiratory frequency is often the sign of impending respiratory failure. Tachypnea is common index of intubation for respiratory failure and index of weaning failure [4].
Additional information on respiratory center function can be obtained by an alternative approach to breathing pattern analysis. The measure of minute ventilation can be partitioned into respiratory frequency and tidal volume component whereas tidal wlume can be participated into flow and inspiration time. Respiratory flow rate, especially the mean inspiratory flow rate, is employed as a measure respiratory drive.
The classic methods for analyzing breathing pattern all focused on single or mean value. For example, in rapid shallow index value above 105 is considered to be potential weaning failure and in tidal volume value less than 300 ml suggests an unsuccessful weaning outcome. Little attention is given to rhythm change. Series data may give more information than spot data. A time-series, breathby breath plot of respiratory frequency and tidal volume in a patients who failure a weaning trial showed a rapid and fluctuated respiratory frequency.
Without external stimulation, breathing pattern is relative stable but not clockwise regularity. The regularity of breathing pattern is not studied. From clinic observation, the breathing pattern is rhythmic change in normal or lightly stressed patients, but it is more fluctuate in impending respiratory failure patients. There are few studies concerned about breathing pattern changing after weaning. In this paper, we use signal process methods (spectral analysis) to study the breathing pattern (rhythm) change before and after weaning. Then after quantification, we try to find out the difference between success and failure weaning group. W e also discover the difference of result in time and frequency domain.
11. METHODOLGGY Our experiment is bellow:
1)Patients Selection
We select twenty-nine patients, who is mechanically ventilated for more than 24 hours in Intensive Care Unit and
prepared for weaning. The timing of weaning is according to the general weaning guideline and decided by the primary care physician who does not involve in this study.
2)Weaning Protocol and Data Collection
For each patient, general care and sputum suction, a fixed orifice flow sensor is connected into endotracheal tube orifice. The signals of flow are collected by VentrakB respiratory monitor with sample rate of 100 Hz. The patient breaths form T-tube with Fi02 5% higher than the ventilator setting, which supply by an alkpurpose nebulizer. The signal will be collected at least 5 min after 30 minutes of T-tube trial. No therapy or physical interruption is allowed in this period The patient' s basic information including sex, age, causes of respiratory failure, ventilator day and weaning outcome will be recorded. The failure of weaning is defined as intubation or reuse of mechanical ventilator within 48
hours of weaning. The usage of noninvasive ventilator is not regarded as weaning failure.
3)Signal Process
The VentrakB raw data is shown as fig 1.We process the data as shown in fig2. First, we use a filter to eliminate error and noise. Then, the inspiratory time, e qiratory time, .cycle time and breathing pattern variability, four physiology parameters, will be identified by zero-crossing method 4)Statistical Analysis Method
Breath-by-breath base variables will be calculated. These include mean and standard deviation. Normalized standard deviation (standard deviatiodmean) is used to investigate neural control of weaning stress.
Mean:
1 "
x
=
- c x i
__
Smoothing Filter -Noise cancellationI
t
I IZero crossing Expiratory Time method Respiratory Time
Breathing Pattem Variabilitv
Characteristic Spectral Analysis Extraction AR Power
Spectral Density
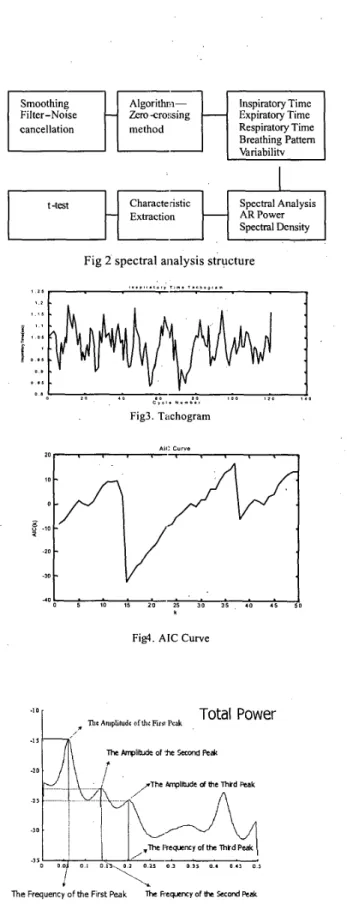
Fig 2 spectral analysis structure
1 I D I O 0 1 2 0 3 . 0 C l c l . ""Ib., Fig3. Tachogram AI,: Curve 2 0 r
. .
,.
,. .
, , 1 fl. j = ] Standard Deviation: k5)Frequency-domain measurement (Spectmm analysis) The four physiology parameters are plotted into tachogram (fig.3).Then, mdified covariance method is used to evaluate autoregressive coefficients. In autoregressive model, order selection is very important We use Akaike Information Criterion to calculate the order of each case. Then, the average value is used as the autoregressive model order. Autoregressive Power Spectral Density will be calculated based on these autoregressive coefficients and order 14 (fig.4). The spectral parameters, the first three peak power ratio in low frequency will also be calculated (fig.5)
PI
..,... , . . ,
...
,...L ~ . . .
...
4Fig 1. The Ventrako recorded flow waveform
-I0
I
Figl. AIC Curve
ntr Anrplilude ofthe Fira Peak
Total
Power
. 3 5 j + ; : : : :
'.
t,,i""!
i \The Frequency of the First Peak lhz fiequemy of ttc Second P e t
FigS. Power Spectral Density
REFERENCES
Deviation
Inviratory Time
111. RESULTS
In our analysis, no matter inspiratory time, expiratory time, cycle time, and breathing pattern variability, no significant difference is found for normalized standard deviation before and after weaning. This also happens in weaning success and failure groups.
Training Failure Group Success Group
After weaning minus Before Weaning Training -0.042 10.098 0.007a
TABLE
I . -Exspiratory Time Cvcle TimePeak Power Ratio of Inspiratory Time between before and aner weaning
INomalized Standard I Weaning IWeaning Training IF’value
(0.095) (0.152) -0.005 0.063 0.008a (0.083) (0.127) -0.039 0.079 0.004a Breathing Pattem Variability(1nspiratory TimeKycle Time) Breathing Pattem (0.071) (0.127) -0.043 0.049 0.020a (0.076) (0.1 13) -0.019 0.069 0.008a Variability (Exspiratory Time/ Cycle Time) (0.039) (0.1 17)
In this paper we investigate breathin pattern using
normalized standdrd deviation of after minusgbefore weanin data to distineuish success and failure weanine erouus.
k
frequency dohain, the result is the similar in tfm; dohain. So it also can provide some information of respiratory svstem to us. This central feedback control uhenomenon in
[ l ] Cohen CA. Zagelbaum G. Cioss D. Roussos C. Macklem PT. Clinical manifestations of inspiratory muscle fatigue. American Journal of Medicine. 73(3):308- 16, 1982 Sep.
830 19736
[2] Esteban A. Alia I. Tobin MJ. Gil A. Gordo F. Vallverdu
I. Blanch L. Bonet A. Vazquez A. de Pablo R. Torres A. de
La Cal MA. Macias S. Effect of spontaneous breathing trial duration on outcome of attempts to discontinue mechanical ventilation. Spanish Lung Failure Collaborative Group. American Journal of Respiratory & Critical Care Medicine.
159(2):512-8, 1999 Feb. 99126673
[3] Tobin MJ. Perez W. Guenther SM. Semmes BJ. Mador
MJ. Allen SJ. Lodato RF. Dantzker DR. The pattern of
breathing during successful and unsuccessful trials of weaning from mechanical ventilation. American Review of Respiratory Disease. 134(6): 11 11 -8, 1986 Dec. 87074370 [4] Tobin MJ, Perez W, Guenther SM et al. The pattern of breathing during successful and unsuccessful trials of waning from mechanical ventilation. Am Rev Respi Dis 1986; [5] Heart Rate Variability
,
Task Force of the European Society of Cardiology and the North American Society of Pacing and Electrophysiology, Circulation. 1996;93 : 1043-1065
134:llll-1118.
bieathing papern may be used, as a good wianing index to predict weaning success and failure.