COMPARISON OF MAJOR
EPIDEMIOLOGICAL SURVEYS USING THE
DIAGNOSTIC INTERVIEW SCHEDULE
Contents
1. Summary
2. Introduction
3. Design of this comparison study
4. General features of six major psychiatric epidemiologic surveys
5. Lifetime Prevalence Rates (LPRs) in urban populations of six different countries
6. Lifetime Prevalence Rates (LPRs) in rural populations of four different countries
7. Intra-cultural comparison of lifetime prevalence of psychiatric disorders
8. Chinese samples
9. Hispanic samples
10.American samples
11.Global view of lifetime prevalence of main categories of psychiatric disorders by the indicator of greatest prevalence ratio (GPR) among major surveys
12.Comparison of gender predominance in lifetime prevalence rates of psychiatric disorders in six major survey samples
13.Comparison of urban/rural prevalence rates of psychiatric disorders in four major survey samples
14.Comparison of ratios of one-year to lifetime prevalence in four major surveys of Taiwan, USA, Canada and Puerto Rico
15.Discussion
16.Limitations
17.Conclusion
18.References Summary
The National Institutes of Mental Health Diagnostic Interview Schedule (DIS) was developed to assess members of the general public for presence of psychiatric symptoms in the landmark Epidemiological Catchment Area (ECA) study in the United States. The success of this undertaking combined with the acceptance by researchers throughout the world of the Diagnostic and Statistical Manual of Mental Disorders, Third Edition (DSM-III) led to the
replication of the ECA in various countries. This report summarizes the comparative results of six of these studies conducted in:
Edmonton, Canada; Seoul and rural Korea; Christchurch, New Zealand,' Puerto Rico; Taiwan; and the United States. The data presented includes comparison of: (1) rates of psychiatric disorders in selected urban areas from all six studies; (2) rates of psychiatric disorders in rural populations of the four studies with rural samples; (3) intra-cultural rates of psychiatric disorders in Chinese, Hispanic and American settings; (4) rates of psychiatric disorders between genders m the six different countries; (5) urban/rural predominance of psychiatric disorders in the four countries with urban and rural samples; and (6) the ratio of one-year versus lifetime prevalence of psychiatric disorders in all six countries. In general, the Asian sites had lower rates of most disorders. The marked differences in
prevalence rates of psychiatric disorders among countries may be due to methodological or cultural factors. Perhaps just as important, one major 'risk factor' for certain psychiatric conditions--gender--showed remarkably consistent results across sites. These findings are discussed. Overall, the great cultural variations and similarities invite more specific scientific designs to explore the rich data sets.
Introduction
Although cross-national comparison of prevalence rates of psychiatric disorders is an important approach in psychiatric
research for exploring etiologi-cal factors and for testing the validity of diagnostic classification, there has been strong skepticism about such cross-national comparisons because of differences in diagnosis and assessment methods (Shapiro & Stromgren, 1979). Answering these problems during the past several decades has had an
& Guze, 1970; Robins & Barrett, 1988). Diagnostic criteria for
discrete psychiatric disorders were proposed (Feighner et al., 1972; Spitzer et al., 1978; APA, 1980), and structured interview schedules were constructed (Spitzer & Endicott, 1975; Helzer, 1981; Robins et al., 1981) for standard diagnostic assessment. By this time a new era, "the third generation of psychiatric epidemiology"--as named by Dohrenwend & Dohrenwend (1982)--emerged with the
characteristics of (1) using diagnostic criteria for definition of specific psychiatric disorders, (2) using standardized structured interview schedules for symptom assessment, (3) face-to-face personal interviews, (4) reliable lay-interviewers for large scale community survey, and (5) computerized data management and analyses.
The NIMH Epidemiological Catchment Area (ECA) program was the first major survey guided by this new wave of psychiatric
epidemiology (Regier et al., 1984). The ECA used the NIMH
Diagnostic Interview Schedule (DIS) (Robins et al., 1981) for case ascertainment, which allowed DSM-III diagnoses to be generated. Based on the success of this study and on the worldwide acceptance of the third edition of the Diagnostic and Statistical Manual (DSM-III) (APA, 1980) by Oriental, Hispanic and Caucasian cultures (Mezzich et al., 1985; Heizer & Canino, 1989), the DIS was widely translated into different languages (Helzer & Robins, 1988) for diagnostic assessment in various research projects. Some of the most significant of these projects included major psychiatric
epidemiological surveys in general populations of different countries in the 1980's (Robins et al., 1984; Canino et al., 1987; Bland et al., 1988; Hwu et al., 1989; Wells et al., 1989; Lee et al., 1990a, 1990b; Robins & Regier, 1991). Since the DSM-III criteria for case definitions and the translated versions of the NIMH DIS both were considered to be applicable in those major surveys, it is plausible to do a cross-national comparison of the data. Results of such comparisons may provide useful data for understanding the differences in prevalence rates and for looking into possible cross-cultural etiological factors of specific psychiatric disorders.
There were six major psychiatric epidemiological surveys completed between 1980 and 1986 using the DIS (Robins, et al., 1984; Canino et al., 1987; Bland et al., 1988, Hwu et al., 1989; Wells et al., 1989; Lee et al., 1990a, 1990b; Robins & Regier, 1991). These studies were performed in six countries with diverse cultures: the United States, Puerto Rico, Canada, Korea, Taiwan and New Zealand. For detailed explanations of the specific methods of each study, see the original publications. In general, these were surveys of general population samples designed to be representative of the areas from which they were selected. The Canadian and New Zealand studies were of urban areas only; the other four sampled from both urban and rural areas.
From these studies comparisons were made of the lifetime prevalence rate (LPR) of discrete psychi-attic disorders as the dependent variable. The independent variables used in analyses included cultural background, urban versus rural area, and gender. The data presented include: (1) comparison of LPRs of psychiatric disorders in selected urban areas from all six studies; (2)
comparison of LPRs of psychiatric disorders in rural populations of the four studies with rural samples; (3) intra-cultural comparison of LPRs of psychiatric disorders in Chinese, Hispanic and American settings; (4) comparison of LPRs of psychiatric disorders between genders in the six different countries; (5) an urban/rural comparison of LPRs of psychiatric disorders in four different countries; and (6) a comparison of the ratio of one-year versus lifetime prevalence of psychiatric disorders in all six countries.
This design emphasizes the fact that cities all over the world have some similarity in economic activities and ways of living. However, cities of different cultures have their unique life cycles of
development. Some western cities, especially downtown areas, are in later stages of development and may have unfavorable living conditions. In contrast, many Oriental cities are in earlier stages of development. These differences invite comparison of psychiatric disorders in various modern cities across countries. The rural areas of each country may have more 'native characteristics' for that specific culture, although modern communication has introduced
major changes even into rural areas. This again invites testing of the LPRs of psychiatric disorders in rural areas of various cultures.
In this comparative study, the LPRs of various psychiatric disorders in different cultural settings were predicted to vary greatly. The prevalence ratio (PR), which is the ratio of higher prevalence rate to lower prevalence rate, is designed to check the variation in LPRs between two samples, and the greatest prevalence ration (GPR), which is the ratio of the highest prevalence rate to the lowest prevalence rate, is designed to check the greatest degree of variation in LPRs of disorders among three or more samples. The statistical meaning of PR and GPR is similar to the odds ratio. In the process of comparison, the mean GPR or mean PR was calculated. The results of inter-cultural comparisons are compared to the intra-cultural comparisons. It was hypothesized that the intra-intra-cultural comparison would have much less variation in PRs or GPRs than the inter-cultural comparisons. Other analyses include assessment of the chronicity of various disorders in different settings by calculating the one-year/lifetime prevalence ratio of each disorder among
different samples. Gender, urban/rural and one year/lifetime
analyses are used as indicators of validity of the comparisons in that they may provide evidence of a consistent pattern in a specific culture or among different cultures (Heizer & Canino, 1989). A consistent pattern would be considered a sign of validity of the LPRs obtained in the use of the DIS across different cultures.
General features of six major psychiatric epidemiologic surveys
All these surveys were carried out in the early to mid-1980's. In all cases, data collection was performed by in person interviews with the DIS from which diagnoses according to DSM-III criteria were generated by computer. The DIS was modified somewhat to fit local culture, especially in the Oriental and Hispanic studies (Hwu et al., 1983; Karno et al., 1983; Hwu et al., 1984; Hwu et al., 1986a,
1986b; Lee et al., 1990a, 1990b; Bravo et al. 1991), and the specific surveys included in this study all used general populations for
sampling, although the specific sampling techniques varied somewhat.
All these surveys were major psychiatric projects in their own countries and these studies were done by distinguished university departments in each nation. Urban and rural samples were included in the US, Puerto Rican, Korean and Taiwan surveys, but not in the Canadian or New Zealand surveys. The specific communities involved in these surveys were Taipei (Taiwan), Seoul (Korea), St. Louis (US), New Haven (US), Baltimore (US), Durham (US), Los Angeles (US), Edmonton (Canada), Christchurch (New Zealand) and San Juan (Puerto Rico).
As seen in Table 1, there were some variations in psychiatric disorders studied across different surveys. Therefore, the data presented in this report have some missing data of some disorders in specific surveys. There were 13 common core diagnostic
categories covered by all six surveys. The total number of subjects studied and their demographic characteristics are presented in Table 2. In general, there is significant variation in the demographic
features among different survey subjects. These differences have to be kept in mind when interpreting data. The response rates were high, especially in the Oriental and Hispanic surveys. The
percentage of male subjects was higher in Oriental studies, especially in Taiwan. New Zealand had the lowest percentage of male gender (34%). The US sample had the highest proportion of senior subjects and the lowest pro-portion of the youngest age group (18--25 years). The Oriental studies had the highest percentage of married subjects and the lowest percentage of divorce/separation. The Taiwan Chinese subjects had the highest percentage to have less than a high school education (61%).
Lifetime Prevalence Rates (LPRs) in urban populations of six different countries
From the six major surveys, Taipei (Taiwan), Seoul (Korea), St. Louis and Durham (US), Edmonton (Canada), Christchurch (New Zealand) and San Juan (Puerto Rico) were chosen for study. The downtown and suburban areas of St. Louis were included separately in this analysis because these two samples might represent different ethnic groups. The urban sample of Durham was also chosen as a
comparison city from the US. Several outstanding comparative features, as revealed in Table 3, deserve attention. The greatest prevalence ratios (GPRs), which are measurements of the greatest difference in LPR of specific disorders among different study
samples, ranged from 2.6 (pathological gambling) to 83.8 (drug abuse/dependence). Other high GPRs (all over 20) were found in antisocial personality disorder, cognitive impairment of severe degree, and psychosexual disorder which had GPRs of 40.4, 23.0 and 21.8, respectively. Low GPRs (less than five) were found not only in pathological gambling but also in generalized anxiety (2.9), obsessive-compulsive disorder (3.6), alcohol abuse/dependence (4.2), dysthymic disorder (4.5), and phobic disorder (4.7). In general, the LPRs were similar between the two Oriental samples and among the American, Canadian, New Zealand, and Hispanic samples.
Lifetime Prevalence Rates (LPRs) in rural populations of four different countries
Four out of six major surveys included rural samples. The greatest difference in LPRs of each specific disorder among these surveys is .shown in the greatest prevalence ratio (GPR) in Table 4. Antisocial personality disorder and psychosexual disorder had low LPRs in the Taiwan rural sample, and these made the GPRs high, 80.7 and 22.2, respectively. All other disorders had GPRs ranging from 1.8 to 10.4. On average, the prevalence ratio was 5.1 (excluding the exceedingly high GPRs of antisocial personality and psychosexual disorder). In the US survey, there were two sites with rural samples--St. Louis and Durham. Phobic disorder and cognitive impairment showed great differences between these two rural US samples. Phobic disorder was much higher in the Durham rural sample (20.3%) than in the St. Louis rural sample (8.2%). Actually, the Durham rural sample had the highest prevalence of phobic disorder across all four countries. The St. Louis rural sample had much lower prevalence (2.6%) of cognitive impairment than that of the Durham rural sample (12.3%). The St. Louis rural sample had the lowest prevalence of cognitive impairment among the available samples.
Schizophrenia had relatively high LPRs in the Durham and Puerto Rico samples, and the Taiwan rural sample had the lowest LPR for schizophrenia. The GPR of schizophrenia was 7.1. As was also seen in the urban samples, manic episode and major depressive disorder had the lowest LPRs in the Chinese sample. Dysthymic disorder had similar LPRs across different cultures. Manic episode had the highest GPR among the mood disorders (7.3). The average GPR among the mood disorders was 4.7. In the categories of anxiety/somatoform disorders, the GPR was the highest for psychosexual disorder (22.2). Excluding this exceedingly high value, the average GPR was 7.0 in this category.
The GPRs of the substance use/behavior disorders ranged from 2.2 to 80.7. A GPR for drug abuse/dependence was not calculated because the Taiwan rural sample had no cases. Otherwise, the greatest GPR was for antisocial personality disorder in which the Taiwan rural sample had the lowest LPR (0.03%), and the St. Louis rural sample had the highest (2.42%). Cognitive impairment of severe degree had a GPR of 2.8 while mild cognitive impairment had a GPR of 4.7. In general, the Taiwan rural sample had lower LPRs than the other samples. The exceptions were generalized anxiety disorder and manic episode, where the rates were slightly higher in rural Taiwan than in some other samples.
Intra-cultural comparison of lifetime prevalence of psychiatric disorders Chinese samples
In addition to the six major community surveys already described, there have been community surveys of lifetime prevalence of
psychiatric disorders in Chinese culture using the Chinese-translated NIMH-DIS in Taipei, Taiwan (Hwu et al., 1989) and Hong Kong (Chen et al., 1993). Because rural samples were not available from Hong Kong, the town and village samples of the Taiwan study were not included in this comparison. The gender, age and education levels of these samples were similar. The Taipei sample was 49% male, 49% of the subjects were age 25 to 44, and 55% had completed secondary school. The Hong Kong sample was 48% male, 61% were age 30 to 49, and 59% had completed secondary school.
Results of the Chinese intra-cultural comparison are shown in Table 5. The prevalence ratios (PRs) were calculated between the Taipei and Hong Kong samples using male and female samples separately. In general, the LPRs of various disorders between the two Chinese samples were similar, as revealed by the low prevalence ratios (PRs) in Table 5. Only one disorder, antisocial personality disorder, had a PR greater than 10: in this disorder, the Hong Kong Chinese had much higher LPR than Taipei Chinese in both male and female subjects.
In 17 disorders with available data for comparison between Taipei and Hong Kong surveys, there were two disorders (schizophrenia and phobic disorder) which had higher LPRs in Taipei male subjects (PRs > 2.0) than in Hong Kong male subjects; there were two
disorders (schizophrenia and alcohol abuses) with higher LPRs in Taipei female subjects (PR>2.0) than in Hong Kong female subjects; there were five disorders with higher LPRs (PR > 2.0) in Hong Kong male than in Taipei male subjects; there were seven disorders with higher LPRs (PR>2.0) in Hong Kong female than in Taipei female subjects. Perhaps the modernization process in Hong Kong is more advanced than in Taipei. This might be one explanation for the differences in LPRs of psychiatric disorders in Chinese sub-cultural samples.
Hispanic samples
The Puerto Rico (Canino et al., 1987) and Los Angeles Hispanic surveys (Karno et al., 1987) provided data for Hispanic intra-cultural comparison of LPRs of 8 disorders. The comparative data are
presented separately for men and women in Table 6. As was found in the Chinese intra-cultural comparison, the Hispanic sites had quite similar rates; the ranges of PRs in males and females were 1.1 to 6.3 and 1.1 to 4.0 respectively. Five out of eight disorders in male subjects had high (> 2.0) PRs: The Puerto Rico male subjects had LPRs higher than Los Angeles Hispanic males for schizophrenia, manic episode, panic disorder and obsessive-compulsive disorder. Dysthymic disorder had a higher LPR in the Los Angeles Hispanic males than in Puerto Rican males. In female subjects, schizophrenia,
and dysthymic disorder had higher LPRs in Puerto Rico than in Los Angeles. Among the women, only one disorder (alcohol
abuse/dependence) had a higher LPR in Los Angeles than in Puerto Rico.
American samples
Five American samples from the ECA survey (Compton et al., 1991) were included in this American 'intra-cultural' comparison. As shown in Table 7, all five samples were from urban catchment areas. Like the other intra-cultural analyses with the Chinese and Hispanic samples, the American samples had similar LPRs of various
psychiatric disorders. The greatest prevalence ratios (GPRs) ranged from 1.3 to 4.6. Only two out of eight disorders (phobic disorder and cognitive impairment) had GPRs over 2.0. Phobic disorder had a high LPR (30.22%) in the Johns Hopkins Hospital Catchment Area, while the lowest LPR of phobic disorder (6.53%) was found in central New Haven. A high LPR of cognitive impairment (10.3%) also was found in the Johns Hopkins Hospital Catchment Area, and the lowest (3.07%) was found in the central Baltimore Area. All other disorders had GPRs below 2.0 and so could be considered to have similar LPRs.
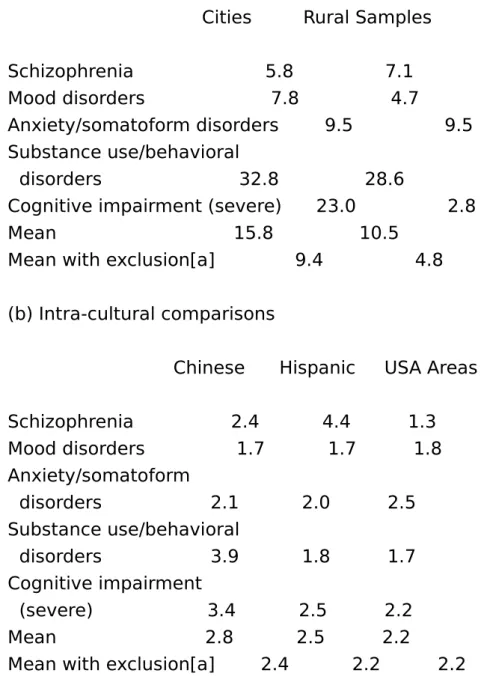
Global view of lifetime prevalence of main categories of psychiatric disorders by the indicator of greatest prevalence ratio (GPR) among major surveys
Tables 3 to 7 illustrate the Greatest Prevalence Ratio (GPR) of each specific disorder. The GPR provides information about the greatest degree of difference in LPRs among samples. Table 8 shows the summarized results of GPRs using the mean GPRs of each major category of disorders including schizophrenia, mood disorders, anxiety/somatoform disorders, substance use/behavior disorders and cognitive impairment. From the summarized data, it is clear that the variation within the intra-cultural samples is much smaller than that among the intercultural samples. The means of the
intra-cultural comparisons ranged from 2.2 to 2.8 only. However, the means of the inter-cultural comparisons ranged from 10.5 to 15.8.
With exclusions of drug abuse/ dependence, antisocial personality and psychosexual disorders (i.e. the extreme cases), the means in the inter-cultural comparisons were 4.8 in the rural samples and 9.4 in the city samples. The mean GPR of intra-cultural comparisons with exclusions were 2.2, 2.2 and 2.4 for the USA, Hispanic and Chinese samples.
Comparison of gender predominance in lifetime prevalence rates of psychiatric disorders in six major survey samples
Table 9 shows a general trend of depressive disorders,
anxiety/somatoform disorders and cognitive impairment having a female predominance. On the other hand, the substance
use/behavior disorder group had a male predominance. There was no difference in LPRs between male and female subjects in any of the six samples in manic episode and somatization disorder. Schizophrenia, obsessive-compulsive disorder, cognitive
impairment, and 'all disorders covered' had a strong tendency of no gender predominance.
Comparison of urban/rural prevalence rates of psychiatric disorders in four major survey samples
The Taiwan, Korea, USA and Puerto Rico samples had data available for analyses regarding urban/rural residence. In contrast to sex predominance in the analyses of LPRs, the urban/rural (or town) analyses of LPRs of various disorders did not reveal a clear cut pattern of urban or rural predominance in LPRs in the different countries/cultures (Table 10).
Comparison of ratios of one-year to lifetime prevalence in four major surveys of Taiwan, USA, Canada and Puerto Rico
The ratio of one-year versus lifetime prevalence rates (ROL) could be considered as one indicator of clinical course of a psychiatric disorder. The higher the ROL value, the more 'chronic' the disorder. That is, the less likely is a subject who 'ever' had a syndrome to report no symptoms recently. The lower the ROL, on the other hand, the more likely is a current remission. Table 1 ! shows the ROLs for
14 disorders from the surveys of Taiwan (Hwn et al., 1989), USA (Robins & Regier, 1991), Canada (Bland et al., 1988) and Puerto Rico (Canino et al., 1987). The Puerto Rican data only had six-month prevalence rates available and thus the ROLs of the Puerto Rico sample appearing in Table 11 are likely an underestimate. Despite this methodological bias, the ROLs of the Puerto Rico data were not the lowest among the four major surveys. Eight (57.1%) out of 14 disorders in the Taiwan sample had a mean ROL above 0.70, and four (28.6%) out of 14 disorders had a mean ROL above or equal to 0.80. In the USA and Canada samples, only one (10.0%) out of 10 disorders had an ROL over 0.70 and none above or equal to 0.80. In the Puerto Rico sample,two (20.0%) out of 10 disorders had ROLs above 0.70 and the ROLs of these two disorders were also over 0.80.
Apparently (as shown in Tables 3 and 4), the Taiwan Chinese had lower LPRs than the USA, Canada, and Puerto Rico samples, but generally had more chronic courses as revealed by the R0L values presented here. The mean ROL of the Taiwan Chinese sample was 0.70. The mean ROLs of the USA and Canada samples were 0.57 and 0.52 respectively and the mean ROL of the Puerto Rico sample was 0.62. Phobic disorder, obsessive-compulsive disorder, alcohol abuse/dependence and pathological gambling varied from this general observation. The ROLs of phobic disorder, alcohol
abuse/dependence and pathological gambling were very similar among the four surveys, and the ROLs of obsessive-compulsive disorder were even higher in the USA and Canada samples than in the Taiwan Chinese sample.
Discussion
Because of the invention of standardized diagnostic criteria and standardized diagnostic interviews, cross-cultural comparison of the prevalence of specific psychiatric disorder became possible. This review takes advantage of one of the most successful series of studies using such standardized criteria and interviews by bringing together data from community surveys which used the DIS in countries with markedly divergent cultures. Cross-national .
comparison of community survey data obtained by using DIS has been reported for the Taiwan and USA data (Compton et al., 1991) and has been done in detail for some disorders such as alcoholism (Helzer & Canino, 1992), depressive disorder (Cross-National
Collaborative Group, 1992) and obsessive-compulsive disorder (Weissman et al., 1994). All these analyses provided useful and important data. This article expands on these earlier reports by presenting cross-national data covering a broad range of psychiatric disorders from six major surveys. The strengths of the comparisons in this article are that all six studies were of general population samples during approximately the same cross-sectional time period, that all used the DIS, and that all used DSM-III criteria (for most disorders). These similarities lend credence to the assumption that the results in each sample are roughly comparable.
It remains a critical finding that intra-cultural rates varied much less than inter-cultural rates. The rates between two Chinese samples, between two Hispanic samples and among American samples varied much less than the rates between the six samples. This would seem to indicate that culture has an important effect on reporting of
symptoms. Because 'state of the art' psychiatric epidemiology methods were used to determine rates of disorders from Oriental (Taiwan Chinese and Korean), Western (USA, Canada and New Zealand) and Hispanic (Puerto Rican and one site in the USA) cultures, the results are intriguing. In fact, these analyses not only used the whole national data for comparison, but also separated the samples into city and rural residence and male and female genders for cross-national comparison.
The city samples had greater variations in LPRs than the rural samples. This may reflect that the modern city has different
characteristics in different cultures. 'Newly developed' and 'old style' cities might have different economic and political activities and ways of living. These could contribute to the great variation in LPRs of psychiatric disorders in cities across different cultural
backgrounds. Additionally, there was no consistent pattern of
differences in LPRs of rural/urban residence across different cultural backgrounds. Thus, it might be understood that rural or urban
residence varies in its influence on the rate of psychiatric disorders in different countries. In contrast, sex predominance in all disorders had a remarkably uniform pattern in all samples. This suggests that psychiatric conditions have certain stable characteristics across different cultures.
Limitations
Several caveats are in order. First, methodological considerations include the observation that these studies were not designed for cross-cultural comparisons and so important details in the
implementation of the projects may have invalidated the
comparisons. For example, translation of instruments may have varied somewhat between the studies, and the computer programs which scored the data may have varied somewhat as well. For the Taiwan and USA samples this concern Was addressed in a recent paper by Compton and colleagues (1991) in which DIS data from the Taiwan sample was cleaned and analyzed using the exact programs from the USA ECA study. Future cross-cultural studies using these important data sets may need to be performed with such methods. Second, the demographic characteristics of the samples varied, and some of the variables such as sex, age, educational level and
marital status may have contributed to the variations in LPRs. Third, the comparisons included in this article were limited to secondary analyses of published data and thus certain gaps in the data from some samples (such as the comparison of six month prevalence rates in Puerto Rico to one year prevalence rates elsewhere) were not cleaned up. Fourth, the sensitivity of any single psychiatric symptom which was used for diagnostic definition may have varied in a non-random manner between the samples. Some symptoms might be highly tolerable in certain cultures, and thus might not be counted as psychiatric symptoms. This type of bias might also reduce the ability of respondents in certain cultures to remember accurately and report past psychiatric symptoms. On the other hand, some symptoms might be over-reported in certain cultures so that even subjects functioning at normal levels would report
certain cultures to 'over-report' past psychiatric symptoms.
Examination of the ratio of one-year versus lifetime prevalence rate (ROL) revealed generally higher ROLs in the Taiwan samples than in American and Hispanic samples. That means that psychiatric
disorders in Taiwan seemed to have more chronic courses; yet, the same Oriental samples generally had lower overall rates of most disorders. This is consistent with more severe cases being
ascertained in the Oriental samples (or conversely with milder cases being ascertained in the other cultures). The underlying 'true' rates may not be so discrepant, and the differences which were found may be explained by differential reporting of symptoms. A related influence on cross-cultural comparisons is differential social stigma which could reduce the willingness of respondents from certain cultural backgrounds to report symptoms in front of others, or could make an ill subject avoid research interviews altogether. As a result, the LPRs of disorders would be reduced in that culture. The sixth issue is that the phenomenological manifestations of a single psychiatric disorder may vary in numbers and in ways of
presentation of symptoms in different cultures. This would make the standardized diagnostic interview with the same set of criteria
symptoms less effective in identifying disorders of common nature. While this remains plausible, other cross-cultural research has found that the manifestations of major psychiatric disorders are generally quite similar indifferent cultures (Cooper et al., 1972; WHO, 1973; Mezzich, 1985; Sartorius et al., 1986).
Overall, all these factors can not be completely discounted and all cross-cultural comparisons included in this article must be
considered tentative. It could be that the DIS is quite reasonable for use within a single culture but could have shortcomings for cross-cultural comparison of diagnostic rates. On the other hand, the differences may be evidence of 'true' differences in psychiatric illness in the different countries, and determining factors for such differences could be ethnically determined biological and/or culturally determined psychological vulnerability traits.
The global findings of lower LPRs of psychiatric disorders in Oriental samples than in American, Caucasian and Hispanic samples might
thus be explained by the following factors: less biological
vulnerability, culturally-determined protective factors, a higher threshold for reporting symptoms, stronger social stigma, and lower rates of demographic risk factors (such as low divorce rates).
Alternatively, higher LPRs of psychiatric disorders could be
explained by the following factors: increased biological vulnerability, culturally-determined 'noxious' influences, a lower threshold for reporting symptoms, less social stigma, and increased rates of demographic risk factors. This tentative formulation provides
testable hypotheses for examining possible influential factors across different cultural backgrounds in future research.
Conclusion
The results presented in this report suggest a cultural (or national) relativism in the rates of psychiatric disorders in different cultures. Marked differences in prevalence rates of psychiatric disorders among countries may be due to methodological or cultural factors, and these great cultural variations invite more specific scientific designs to understand the differences. Perhaps just as important, one major 'risk factor' for certain psychiatric conditions, gender, showed remarkably consistent results across sites. This consistency supports the validity of the psychiatric conditions themselves
(Helzer & Canino, 1989) and is itself worthy of further exploration. Table 1. Diagnostic categories covered in six
major community psychiatric epidemiological surveys
Legend for Chart: A - Taiwan B - Korea C - USA D - Canada E - New Zealand F - Puerto Rico
A B C D E F (1) Non-Affective Psychosis Schizophrenia[a] + + + + + + Schizophreniform disorder[a] + + + + + + Paranoid disorder + -(2) Mood Disorders Manic episode[a] + + + + + + Major depressive disorderp[a] + + + + + + Dysthymia[a] + + + + + + (3) Anxiety Disorders
Generalized anxiety disorder + + + + Panic disorder[a] + + + + + + Phobic disorder[a] + + + + + + Obsessive Compulsive disorder[a] + + + + + + (4) Somatoform Disorders Somatization disorder[a] + + + + + + Psychophysiological disorder + Anorexia nervosa + + + + + Bulimia + -(5) Substance Use/Behavioral Disorders Alcohol abuse/dependence[a,b] + + + + + + Drug abuse/dependence[a,c] + + + + + + Tobacco dependence + + Pathological gambling + + + Antisocial personality disorder[a] + + + + + -(6) Sexual Disorders Psychosexual disorders + - - - + + Transsexuality + Homosexuality +
-(7) Cognitive Impairment[*] + + + + + + + diagnostic category included.
- diagnostic category not included.
[b] Alcohol abuse and alcohol dependence are combined in most reports.
[c] Drug abuse and drug dependence are combined in most reports. [a] common core disorders.
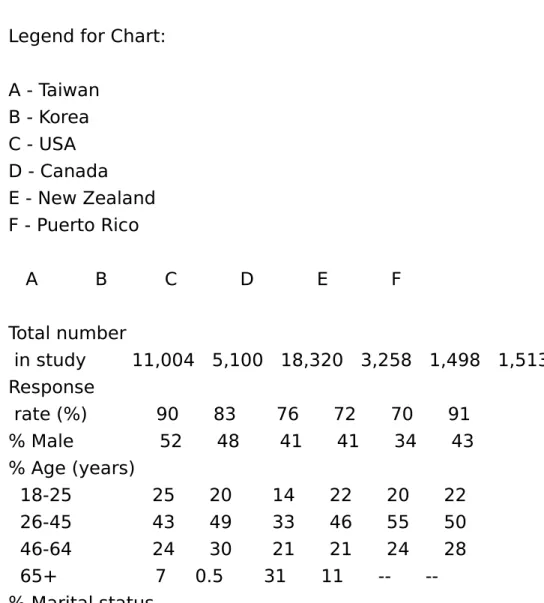
Table 2. Demographic characteristics of six major community psychiatric epidemiological surveys Legend for Chart:
A - Taiwan B - Korea C - USA D - Canada E - New Zealand F - Puerto Rico A B C D E F Total number in study 11,004 5,100 18,320 3,258 1,498 1,513 Response rate (%) 90 83 76 72 70 91 % Male 52 48 41 41 34 43 % Age (years) 18-25 25 20 14 22 20 22 26-45 43 49 33 46 55 50 46-64 24 30 21 21 24 28 65+ 7 0.5 31 11 --% Marital status
Married 69 74 47 51 60 56 Widowed/ divorced/ separated 5 5 33 22 16 19 Never married 24 20 21 27 24 26 % Education
Less than high
school 61 -- 43 -- -- 46 High school
graduate 36 -- 50 -- -- 51 Some college 3 -- 7 -- -- 3 Table 3. Lifetime prevalence rates of specific psychiatric disorders in urban populations of six countries
Legend for Chart:
A - Taipei[1] n = 4,997, % (S.E.) B - Seoul[2] n = 3,134, % (S.E.)
C - St. Louis downtown[3] n = 973, % (S.E.) D - St. Louis suburban[3] n = 1,262, % (S.E.) E - Durham urban[3] n = 1,881, % (S.E.) F - Edmonton[4] n = 1,498, % (S.E.) G - Christchurch[5] n = 1,498, % (S.E.) H - San Juan[6] n = 1,001, % (S.E.) I - Greatest Prevalence Ratio[*] A B C D E F G H I Schizophrenia 0.34 (0.08) 0.31 1.45 (0.68) 0.65 (0.32) 1.56 (0.35) 0.6 (0.1) 0.3 (0.2) 1.8 (0.5) 5.8 Mood disorders
Manic episode
0.16 (0.06) 0.40 0.86 (0.53) 0.43 (0.26) 0.41 (0.18) 0.6 (0.1) 0.7 (0.3) 0.5 (0.2) 5.4 Major depressive episode
0.94 (0.14) 3.31 5.80 (1.34) 4.75 (0.84) 5.13 (0.62) 8.6 (0.5) 12.6 (1.0) 4.9 (0.8) 13.4 Dysthymic disorder 1.42 (0.17) 2.41 4.94 (1.24) 4.53 (0.82) 2.39 (0.43) 3.7 (0.3) 6.4 (0.7) 5.5 (0.8) 4.5 Anxiety/somatoform disorders
Generalized anxiety disorder
4.72 (0.32) 3.56 8.64 (1.76) 8.61 (1.20) 10.43 (0.98) -- -- 2.9 Panic disorder 0.30 (0.08) 1.11 1.49 (0.70) 0.84 (0.36) 1.82 (0.37) 1.2 (0.2) 2.2 (0.4) 1.8 (0.5) 7.3 Phobic disorder 4.56 (0.30) 5.89 9.50 (1.68) 10.77 (1.22) 21.60 (1.15) 8.9 (0.5) 8.1 (0.8) 13.7 (1.3) 4.7 Obsessive-compulsive disorder 1.02 (0.14) 2.29 1.52 (0.70) 2.36 (0.60) 3.38 (0.50) 3.0 (0.3) 2.2 (0.4) 3.7 (0.7) 3.6 Somatization disorder
0.04 (0.03) 0.03 0.22 (0.27) 0.16 (0.16) 0.28 (0.15) 0.00 <0.1 (0.1) 0.7 (0.3) 17.5 Psychosexual disorders 1.52 (0.18) 33.2 (1.4) 24.5 (1.5) 21.8 Substance use/behavior disorders
Alcohol abuse/dependence 5.17 (0.32) 21.71 19.68 (2.28) 15.92 (1.44) 8.97 (0.80) 18.0 (0.8) 18.9 (1.3) 13.7 (1.2) 4.2 Drug abuse/dependence 0.10 (0.04) 0.88 8.38 (1.59) 5.61 (0.91) 5.05 (0.61) 6.9 (0.5) 5.7 (0.7) -- 83.8
Antisocial personality disorder
0.14 (0.05) 2.08 5.66 (1.32) 3.05 (0.68) 1.55 (0.34) 3.7 (0.4) 3.1 (0.5) -- 40.4 Pathological gambling 0.48 (0.10) 1.02 0.4 (0.2) -- 2.6 Cognitive impairment Severe 0.43 (0.09) 0.16 ---- ---- 0.8 (0.2) <0.1 (0.1) 2.3 (0.5) 23.0
Mild
1.53 (0.17) -- 11.70 (0.84) 4.77 (0.84) 7.07 (0.71) -- -- 7.6
* Greatest Prevalence Ratio: ratio of the greatest prevalence rate to the lowest prevalence rate of each specific disorder.
Sources: 1 Hwu et al. (1989); 2 Lee et al. (1990); 3 Compton et al. (1991); Robins & Regier (1991); 4 Bland et al. (1988); 5 Wells et al. (1989); 6 Canino et al. (1987).
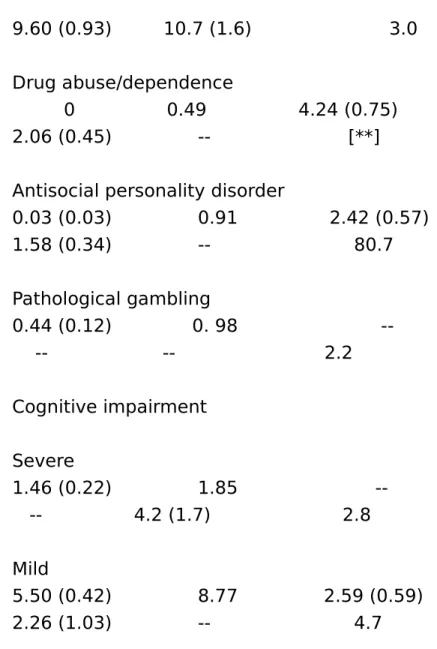
Table 4. Lifetime prevalence rates of specific psychiatric disorders in rural populations of four countries
Legend for Chart:
A - Taiwan villages[1] n = 2,964, % (S.E.) B - Seoul rural[2] n = 1,966, %
C - St. Louis rural[3] n = 736, % (S.E.) D - durham rural[4] n = 1,943, % (S.E.) E - San Juan rural[5] n = 513, % (S.E.) F - Greatest Prevalence Ratio
A B C D E F Schizophrenia 0.17 (0.08) 0.54 0.37 (0.22) 1.21 (0.35) 1.2 (0.5) 7.1 Mood disorders Manic episode 0.10 (0.06) 0.44 0.66 (0.30) 0.09 (0.10) 0.4 (0.4) 7.3
Major depressive disorder 1.01 (0.18) 3.47 4.95 (0.81) 2.44 (0.49) 4.9 (0.8) 5.0 Dysthymic disorder 1.45 (0.22) 1.89 2.74 (0.61) 2.03 (0.44) 3.9 (0.9) 1.8 Anxiety/somatoform disorders
Generalized anxiety disorder
3.42 (0.52) 2.89 9.16 (1.16) 7.66 (0.93) -- 3.2 Panic disorder 0.27 (0.10) 2.60 2.17 (0.54) 1.37 (0.37) 1.7 (0.6) 9.6 Phobic disorder 3.50 (0.34) 5.97 8.21 (1.02) 0.33 (1.27) 9.6 (1.3) 5.8 Obsessive-compulsive disorder 0.30 (0.10) 1.90 1.67 (0.48) 3.12 (0.55) 2.2 (0.7) 10.4 Somatization disorder 0.10 (0.06) 0.18 0.10 (0.12) 0.58 (0.24) 0.6 (0.3) 6.0 Psychosexual dysfunctions 1.34 (0.22) -- 29.7 (2.2) 22.2 Substance use/behaviors disorders
Alcohol abuse/dependence
9.60 (0.93) 10.7 (1.6) 3.0 Drug abuse/dependence
0 0.49 4.24 (0.75) 2.06 (0.45) -- [**] Antisocial personality disorder
0.03 (0.03) 0.91 2.42 (0.57) 1.58 (0.34) -- 80.7 Pathological gambling 0.44 (0.12) 0. 98 -- -- 2.2 Cognitive impairment Severe 1.46 (0.22) 1.85 -- 4.2 (1.7) 2.8 Mild 5.50 (0.42) 8.77 2.59 (0.59) 2.26 (1.03) -- 4.7
* Greatest Prevalence Ratio: ratio of the highest to the lowest prevalence rates of each specific disorder.
** excluded because Taiwan had no cases.
Sources: 1 Hwu, Compton et al. (1989); 2 Lee et al. (1990b); 3 Compton et al. (1991), Robins & Regier (1991); 4 Compton et al. (1991), Robins & Regier (1991); 5 Canino (1987).
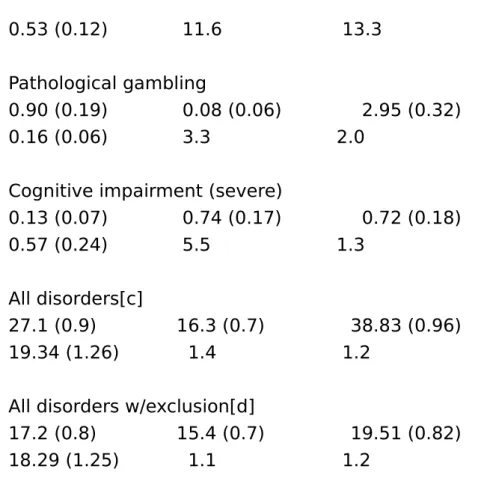
Table 5. Intra-cultural comparison of lifetime prevalence rates of specific psychiatric disorders in Chinese metropolitan surveys of Taipei and Hong Kong
Legend for Chart:
A - Taipei[1]: Male, % (S.E.) B - Taipei[1]: Female, % (S.E.) C - Hong Kong[2]: Male, % (S.E.) D - Hong Kong[2]: Female, % (S.E.) E - Prevalence Ratio[a]: Male
F - Prevalence Ratio[b]: Female A B C D E F Schizophrenia 0.28 (0.11) 0.32 (0.11) 0.12 (0.06) 0.13 (0.06) 2.3 2.5 Mood disorders Manic episode 0.16 (0.08) 0.16 (0.08) 0.15 (0.06) 0.16 (0.06) 1.1 1.0
Major depressive disorder
0.73 (0.17) 1.02 (0.20) 1.29 (0.21) 2.44 (0.39) 1.8 2.4 Dysthymic disorder 0.69 (0.17) 1.14 (0.21) 1.05 (0.17) 2.83 (0.40) 1.5 2.5 Anxiety/somatoform disorders Generalized anxiety disorder
2.39 (0.31) 5.04 (0.43) 7.77 (0.55)\ 11.11 (0.99) 3.3 2.2
Panic disorder
0.34 (0.10) 1.7 1.2 Phobic disorder 2.73 (0.33) 5.70 (0.46) 0.96 (0.20) 3.16 (0.51) 2.8 1.8 Obsessive-compulsive disorder 0.81 (0.18) 1.07 (0.20) 0.87 (0.16) 1.22 (0.18) 1.1 1.1 Somatization disorder 0 0.08 (0.06) 0.17 (0.07) 0.29 (0.09) -- 3.6
Substance use/behavior disorders Alcohol abuse/dependence -- -- 8.86 (0.56) 0.62 (0.25) --Alcohol abuse 6.43 (0.50) 0.43 (0.13) 6.02 (0.47) 0.19 (0.07) 1.1 2.2 Alcohol dependence 2.85 (0.34) 0.12 (0.07) 2.85 (0.25) 0.44 (0.23) 1.0 3.7 Drug abuse/dependence 0.09 (0.06) 0.12 (0.05) 0.33 (0.12) 0.16 (0.06) 3.4 1.3 Tobacco dependence 14.46 (0.71) 1.35 (0.23) 26.56 (0.76) 1.43 (0.19) 1.8 1.1
Antisocial personality disorder
0.53 (0.12) 11.6 13.3 Pathological gambling
0.90 (0.19) 0.08 (0.06) 2.95 (0.32) 0.16 (0.06) 3.3 2.0
Cognitive impairment (severe)
0.13 (0.07) 0.74 (0.17) 0.72 (0.18) 0.57 (0.24) 5.5 1.3
All disorders[c]
27.1 (0.9) 16.3 (0.7) 38.83 (0.96) 19.34 (1.26) 1.4 1.2
All disorders w/exclusion[d]
17.2 (0.8) 15.4 (0.7) 19.51 (0.82) 18.29 (1.25) 1.1 1.2
a Prevalence Ratio of male subjects between Taipei and Hong Kong samples using lifetime prevalence.
b Prevalence Ratio of female subjects between Taipei and Hong Kong samples using lifetime prevalence.
[c] Taipei sample includes 22 disorders.
[d] Taipei sample excludes tobacco dependence. Hong Kong sample excludes tobacco dependence and pathological gambling.
Sources: 1Hwu et al. (1989); 2Chen et al. (1993). Table 6. Intra-cultural comparison of lifetime prevalence rates of specific psychiatric disorders in Hispanic samples: Puerto Rico and Los Angeles
Legend for Chart:
B - Puerto Rico[1]: Female (n = 859), % (S.E)
C - Los Angeles[2] Hispanic Sample: Male (n = 591), % (S.E) D - Los Angeles[2] Hispanic Sample: Female (n = 652), % (S.E) E - Prevalence Ratio: Male
F - Prevalence Ratio: Female
A B C D E F Schizophrenia 1.9 (0.6) 1.2 (0.4) 0.3 (0.3) 0.5 (0.3) 6.3 2.4 Mood disorders Manic episode 0.7 (0.4) 0.4 (0.2) 0.2 (0.2) 0.5 (0.3) 3.5 1.3
Major depressive disorder
3.5 (0.8) 5.5 (0.9) 3.8 (0.8) 6.3 (1.1) 1.1 1.1 Dysthymic disorder 1.6 (0.5) 7.6 (0.9) 3.3 (0.8) 6.0 (0.8) 2.1 1.3 Anxiety/somatoform disorders Panic disorder 1.6 (0.5) 1.9 (0.5) 0.4 (0.3) 1.9 (0.5) 4.0 1.0 Phobic disorder 9.9 (1.3) 14.3 (1.3) 8.6 (1.4) 17.8 (1.7) 1.2 1.2 Obsessive-compulsive disorder
3.3 (0.8) 3.1 (0.7) 1.2 (0.5) 2.1 (0.6) 2.8 1.5
Substance use/behavioral disorders Alcohol abuse/dependence
24.6 (1.9) 2.0 (0.5) 31.1 (2.1) 4.6 (0.9) 1.3 2.3
All disorders covered
34.0 (2.3) 22.8 (1.6) 39.5 (2.2) 30.0 (2.2) 1.2 1.3
* Prevalence Ratio: Ratio of higher to lower prevalence rate of each disorder.
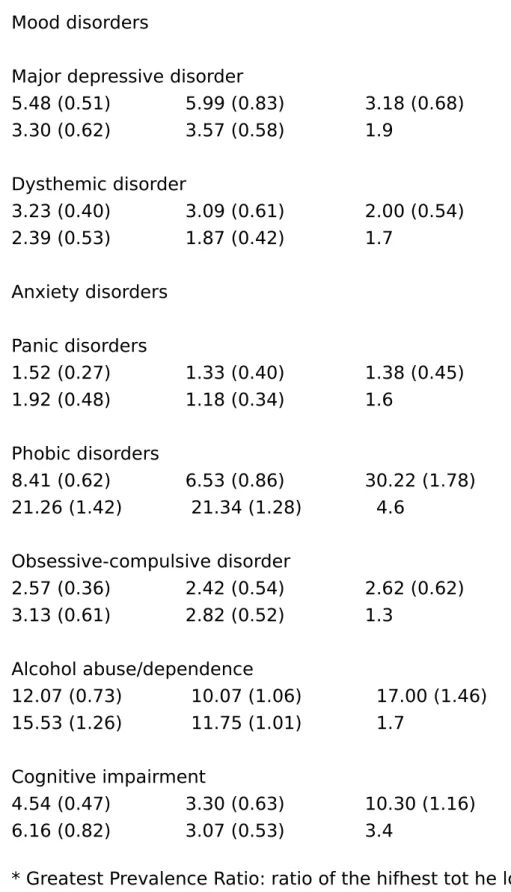
Sources: 1 Canino et al. (1987); 2 Karno et al. (1987). Table 7. Intra-cultural comparison of lifetime
prevalence of specific psychiatric disorder in five USA catchment area samples Legend for Chart:
A - Western New Haven (n = 3434), % (S.E) B - Central New Haven (n = 1465). % (S.E)
C - Johns Hopkins Hospital Catchment Area (n = 859), % (S.E) D - Baltimore City Hospital cathment Area (n = 1087), % (S.E) E - Central Baltimore (n = 1292), % (S.E)
F - Greatest Prevalence Ratio[*] A B C D E F Schixophrenia
1.35 (0.26) 1.59 (0.44) 1.51 (0.47) 1.16 (0.37) 1.09 (0.33) 1.3
Mood disorders
Major depressive disorder
5.48 (0.51) 5.99 (0.83) 3.18 (0.68) 3.30 (0.62) 3.57 (0.58) 1.9 Dysthemic disorder 3.23 (0.40) 3.09 (0.61) 2.00 (0.54) 2.39 (0.53) 1.87 (0.42) 1.7 Anxiety disorders Panic disorders 1.52 (0.27) 1.33 (0.40) 1.38 (0.45) 1.92 (0.48) 1.18 (0.34) 1.6 Phobic disorders 8.41 (0.62) 6.53 (0.86) 30.22 (1.78) 21.26 (1.42) 21.34 (1.28) 4.6 Obsessive-compulsive disorder 2.57 (0.36) 2.42 (0.54) 2.62 (0.62) 3.13 (0.61) 2.82 (0.52) 1.3 Alcohol abuse/dependence 12.07 (0.73) 10.07 (1.06) 17.00 (1.46) 15.53 (1.26) 11.75 (1.01) 1.7 Cognitive impairment 4.54 (0.47) 3.30 (0.63) 10.30 (1.16) 6.16 (0.82) 3.07 (0.53) 3.4
* Greatest Prevalence Ratio: ratio of the hifhest tot he lowest prevalence rate of each specific disorder
Source: Compton et al. (1991).
of greatest prevalence ratios among major surveys (a) Inter-cultural comparisons
Cities Rural Samples Schizophrenia 5.8 7.1 Mood disorders 7.8 4.7
Anxiety/somatoform disorders 9.5 9.5 Substance use/behavioral
disorders 32.8 28.6
Cognitive impairment (severe) 23.0 2.8 Mean 15.8 10.5
Mean with exclusion[a] 9.4 4.8 (b) Intra-cultural comparisons
Chinese Hispanic USA Areas Schizophrenia 2.4 4.4 1.3 Mood disorders 1.7 1.7 1.8 Anxiety/somatoform disorders 2.1 2.0 2.5 Substance use/behavioral disorders 3.9 1.8 1.7 Cognitive impairment (severe) 3.4 2.5 2.2 Mean 2.8 2.5 2.2
Mean with exclusion[a] 2.4 2.2 2.2
a excluding drug abuse/dependence, antisocial personality disorder, and psychosexual disorder.
Table 9. Specific disorders with significant differences in lifetime prevalence between sex in different survey samples
A - Taiwan[1]: Taipei B - Taiwan[1]: Rural C - Seoul[2,3]: City D - Seoul[2,3]: Rural E - USA[4]: New Haven F - USA[4]: Baltimore G - Canada[5]: Edmonton
H - New Zealand[6]: Christchurch I - Puerto Rico[7]: San Juan
A B C D E F G H I Schizophrenia O O O O F O O O O Mood disorders Manic episode O O O O O O O O O Major depressive disorder
O F F F F F F F O Dysthymic disorder
O F F F O F F F F Anxiety/somatoform disorders
Generalized anxiety disorder
F F O 0 F --Panic disorder
O O F F O F F F F Phobic disorder
Obsessive-compulsive disorder O O O O O O O F O Somatization disorder O O O O O O O O O Psychosexual disorder F F -- -- -- -- -- F F Substance use/behavior disorders Alcohol abuse/dependence M M M M M M M M M Drug abuse/dependence M? O O O O O M M --Tobacco dependence M M M M O --Antisocial personality M? O M M M M M O --Pathological gambling M M M M O --Cognitive impairment F O O F O O O O O All disorders covered
O OM/O[a] F[b] O O M/F(c) O O
[a] No difference between male and female if all substance use disorders were excluded.
[c] Male predominant if all disorders covered; female predominant if substance use disorders excluded.
M: Male predominant. F: Female predominant. O: No sex difference.
M?: Probably male predominant. Because of small case number, statistics showed no significant difference.
Sources: 1 Hwu et al. (1989); 2 & 3. Lee et al. (1990a, 1990b); 4 Robins et al. (1984); 5 Bland et al. (1988); 6 Wells et al. (1989); 7 Canino et al. (1987).
Table 10. Specific disorders with significant differences in lifetime prevalence between urban/rural areas in different survey samples
Legend for Chart:
A - Taiwan[1]: Urban/town B - Taiwan[1]: Urban/village C - Korea[2]: Seoul
D - USA[3]: Durham E - USA[3]: St. Louis
F - Puerto Rico[4]: San Juan
A B C D E F Schizophrenia O O O O U O Mood disorders Manic episode O O O O O O Major depressive disorder R O O U O O
Dysthymic disorder O O O O U U Anxiety/somatoform disorders Generalized anxiety disorder R R O U O Panic disorder O O R O O O Phobic disorder O O O O O U compulsive disorder O U O O O O Somatization disorder O O O O O O Psychosexual disorder O O -- -- -- O Substance use/behavior disorders
Alcohol abuse/ dependence R R R O U O Drug abuse/ dependence O O O U U Tobacco dependence R R O Antisocial personality O O U O U Pathological gambling O O O Cognitive impairment R R R R U O U: urban predominance R: rural predominance
Sources: 1 Hwu et al. (1989); 2 Lee et al. (199Ob); 3 Compton et al. (1991); 4 Canino et al. (1987).
Table 11. Comparisons of ratios of one-year prevalence rates versus lifetime prevalence rates in four major surveys of Taiwan, USA, Canada and Puerto Rico Legend for Chart:
A - Taiwan[1]: MT B - Taiwan[1]: ST C - Taiwan[1]: RV D - Mean E - USA[2] F - Canada[3] G - Puerto[4a] A B C D E F G Schizophrenia 0.90 1.00 0.87 0.92 0.69 0.50 0.94 Paranoid disorder 0.74 0.75 0.70 0.73 --Mood disorders Manic episode 0.75 0.43 1.00 0.73 0.75 0.33 0.60 Major depression 0.74 0.68 0.84 0.75 0.55 0.53 0.65 Anxiety/somatoform disorders Generalized anxiety disorder 0.90 0.82 0.82 0.85 0.45 Panic disorder 0.90 0.50 1.00 0.80 0.56 0.58 0.65 Phobic disorder 0.59 0.67 0.66 0.64 0.68 0.70 0.52 compulsive disorder 0.27 0.24 0.43 0.31 0.65 0.60 0.56
Somatization
disorder 1.00 1.00 1.00 1.00 -- 1.00 Substance use/behavior disorders
Alcohol abuse/ dependence 0.40 0.59 0.54 0.51 0.49 0.44 0.39 Drug abuse/ dependence 0.50 0.65 0.58 0.40 0.38 Tobacco dependence 0.48 0.92 0.83 0.74 Pathological gambling 0.58 0.67 0.61 0.62 0.65 --Mean ROL of each sample study 0.65 0.68 0.68 0.70 0.57 0.52 0.62
a Puerto Rico sample only had six-month prevalence rates for analysis.
MT = metropolitan Taipei; ST = small towns; RV = rural villages. Sources: 1 Hwu et al. (1989); 2 Robins & Regier (ed) (1991); Bland et al. (1988); 4 Canino et al. (1987).
Note: Cognitive impairment has same prevalence rates of one-year and lifetime prevalence, and it is not included in this analysis.
References
AMERICAN PSYCHIATRIC ASSOCIATION (1980) Diagnostic and
Statistical Manual, 3rd edition (Washington DC, American Psychiatric Press).
BLAND, R. C., NEWMAN, S.C. & ORN, H. (1988) Epidemiology of psychiatric disorders in Edmondton, Acta Psychiatrica Scandinavica, 77 (Suppl:338), pp. 1-80.
BRAvo, M., CANINO, G. J., RUBIO-STIPEC, M. & WOOD-BURY-FARINA, M. (1991) A cross-cultural adaptation of a psychiatric epidemiologic instrument: the diagnostic interview schedule's adaptation in Puerto Rico, Culture, Medicine and Psychiatry, 15, pp. 1-18.
CANINO, G. J., BIRD, H. R., SHROUT, P. E., RUBIO-STIPEC, M., BRAVO, M. MARTINEZ, R., SESMAN, M. & GUEVARA, L. M. (1987) The
prevalence of specific psychiatric disorders in Puerto Rico, Archives of General Psychiatry, 44, pp. 727-735.
CHEN, C. N., WONG, J., LEE, N., CHAN-HO, M. W., LAU, J. T. F. & FUNG, M. (1993) The Shatin community mental health survey in Hong Kong, II major findings, Archives of General Psychiatry, 50, pp. 125133.
COMPTON, W. M., HELZER, J. E., HWU, H. G., YEH, E. K., MCEVOY, L., TIPP, J. E. & SPITZNAGEL, E. L. (1991) New methods in cross-cultural psychiatry: psychiatric illness in Taiwan and the United States,
American Journal of Psychiatry, 148, pp. 1697-1704.
COOPER, J. E., KENDELL, R. E., GURLAND, B. J., SHARPE, L.,
COPELAND, J. R. M. & SIMON, R. (1972) Psychiatric Diagnosis in New York and London (London, Oxford University Press).
CROSS-NATIONAL COLLABORATIVE GROUP (1992) The changing rate of major depression: cross-national comparison, Journal of American Medical Association, 268, pp. 3098-3105.
DOHRENWEND, B. P. & DOHRENWEND, B. S. (1982) Perspectives on the past and future of psychiatric epidemiology, American Journal of Public Health, 72, pp. 1271-1279.
FEIGHNER, J.P., ROBINS, E., GUZE, S. B., WOODRUFF, R. A., WINOKUR, G. & MUNOZ, R. (1972) Diagnostic criteria for use in psychiatric research, Archives of General Psychiatry, 26, pp. 57-63. HEIZER, J. E. (1981) The use of a structured diagnostic interview for routine psychiatric evaluation, Journal of Nervous Mental Disease, 169, pp. 45-49.
HELZER, J. E. & CANINO, G. (1989) The implications of cross-national research for diagnostic validity, in: L. N. ROBINS & J. E. BARRETT (Ed.) The Validity of Psychiatric Diagnosis, pp. 247-261 (New York, Raven Press).
HELZER, J. E. & CANINO, G. J. (Ed.) (1992) Alcoholism in North America, Europe and Asia (New York, Oxford University Press). HELZER, J. E. & ROBINS, L. N. (1988) The diagnostic interview
schedule: its development, evolution, and use, Social Psychiatry and Psychiatric Epidemiology, 23, pp. 6-16.
HWU, G. H., YEH, E. K. & CHANG, L. Y. (1986a) Chinese diagnostic interview schedule I. Agreement with psychiatrist's diagnosis, Acta Psychiatrica Scandi-navica, 73, pp. 225-233.
HWU, G. H., YEH, E. K., CHANG, L. Y. & YEH, Y. L. (1986b) Chinese diagnostic interview schedule, II. A validity study on estimation of lifetime prevalence, Acta Psychiatrica Scandinavica, 73, pp. 348-357. HWU, G. H., YEH, E. K. & CHANG, L. Y. (1989) Prevalence of psychiatric disorders in Taiwan defined by the Chinese diagnostic interview schedule, Acta Psy-chiatrica Scandinavica, 79, pp. 136-174.
HWU, G.H., YEH, E. K., CHANG, L. Y., CHEN, C. T., CHEN, C. C. & CHEN, T. Y. (1984) The Chinese modification of NIMH-diagnostic interview schedule--reliability study on assessment of psychiatric symptoms, Psychological Testing, 31, pp. 15-26.
HWU, G. H., YEH, E. K., CHEN, C. T., CHEN, C. C. & CHEN, T. Y. (1983) An applicability study of the Chinese modification of diagnostic interview schedule, Bulletin of Chinese Society of Neurology and Psychiatry, 9, pp. 30-39.
KARNO, M., BURNAM, A., ESCOBAR, J. I., HOUGH, R. L. & EATON, W. W. (1983) Development of the Spanish language version of the National Institute of Mental Health diagnostic interview schedule, Archives of General Psychiatry, 40, pp. 1183-1188.
KARNO, M., HOUGH, P. L., BURNHAM, M. A., ESCOBAR, J. I., TIMBERS, D. M., SANTANA, F. & BOYD, J. H. (1987) Lifetime prevalence of specified psychiatric disorders among Mexican-Americans and non-His-panic Whites in Los Angeles, Archives of Central Psychiatry, 44, pp. 695-701.
LEE, C. K., KWAK, Y. S., YAMAMOTO, J., RHEE, H., KIM, Y. S., HAN, J. H., CHOI, J. O. & LEE, Y. H. (1990a) Psychiatric epidemiology in Korea. Part I: gender and age differences in Seoul, Journal of Nervous and Mental Disease, 178, pp. 242-246.
LEE, C. K., KWAK, Y. S., YAMAMOTO, J., RHEE, H., KIM, Y. S., HAN, J. H., CHOI, J. O. & LEE, Y. H. (1990b) Psychiatric epidemiology in Korea. Part II: urban and rural differences, Journal of Nervous and Mental Disease, 178, pp. 247-252.
MEZZICH, J. E., FABREGA, H., MEZZICH, A. C. & COFFMAN, G. A. (1985) International experience with DSM-III, Journal of Nervous and Mental Disease, 173, pp. 738-741.
REGIER, D. A., MYERS, J. K., KRAMER, M., ROBINS, L. N., BLAZER, D.G., HOUGH, R. L., EATON, W. W. & LOCKE, B. E. (1984) The NIMH epidemiologic catchment area program, Archives of General
Psychiatry, 41, pp. 934-941.
ROBINS, E. & GUZE, S. B. (1970) Establishment of diagnostic validity in psychiatric illness: Its application to schizophrenia, American Journal of Psychiatry, 126, pp. 107-111.
ROBINS, L. N. & BARRETT, J. E. (Eds) (1989) The Validity of Psychiatric Diagnosis (New York, Raven Press).
ROBINS, L. N. & REGIER, D. A. (Eds) (1991) Psychiatric Disorders in America: The Epidemiologic Catchment Area Study (New York, The Free Press).
ROBINS, L. N., HELZER, J. E.. CROUGHAN, J. & RAT-CLIFF, K. S. (1981) National Institute of Mental Health diagnostic interview schedule: its
history, characteristics, and validity, Archives of General Psychiatry, 38, pp. 381-389.
ROBINS, L. N., HEIZER, J. E., WEISSMAN, M. M., OR-VASCHEL, H., GRUENBERG, E., BURKE, JR. J. D. & REGIER, D. A. (1984) Lifetime prevalence of specific psychiatric disorders in three sites, Archives of General Psychiatry, 41, pp. 949-958.
SARTORIUS, N., JABLENSKY, A., KORTEN, A., ERNBERG, G., ANKER, M., COOPER, J. E. & DAY, R. (1986) Early manifestations and first-contact incidence of schizophrenia in different cultures,
Psychological Medicine, 16, pp. 909-928.
SHAPIRO, R. W. & STROMGREN, E. (1979) The relevance of
epidemiological methods, techniques, and findings for biological psychiatry, in: H. M. VAN PRAAG (Ed.) Handbook for Biological Psychiatry, Part I. (New York, Marcel Dekker, Inc.).
SPITZER, R. L. & ENDICOTT, J. (1975) Schedule for Affective
Disorders and Schizophrenia (SADS), 2nd ed. (New York, Department of Psychiatry, Columbia University College of Physicians and
Surgeons).
SPITZER, R. L., ENDICOTT, J. & ROBINS, E. (1978) Research diagnostic criteria: rationale and reliability, Archives of General Psychiatry, 35, pp. 773-782.
WEISSMAN, M. M., BLAND, R. C., CANINO, G. J., GREENWALD, S., HWU, H. G., LEE, L. K., NEWMAN, S.C., OAKLEY-BROWNE, M. A., RUBIO-STIPEC, M., WICKRAMATATNE, P. J., WITTCHEN, H. U. & YEH, E. K. (1994) The cross-national epidemiology of obsessive compulsive disorder, Journal of Clinical Psychiatry, 55 (Suppl. 3) pp. 5-10.
WELLS, J. E., BUSHNELL, J. A., HORNBLON, A. R., JOYCE, P. R. & OAKLEY-BROWNE, M. A. (1989) Christchurch psychiatric
epidemiology study, Part I: Methodology and lifetime prevalence for specific psychiatric disorders, Australian and New Zealand Journal of Psychiatry, 23, pp. 315-326.
WORLD HEALTH ORGANIZATION (1973) The International Pilot Study of Schizophrenia, Vol. I. (Geneva, World Health Organization).
~~~~~~~~
By HAI-GWO HWU[*] & WILSON M. COMPTON[**]
* Department of Psychiatry, College of Medicine, National Taiwan University, Taipei, Taiwan, ROC & ** Washington University School of Medicine, Department of Psychiatry, St. Louis, MO, USA
Copyright of International Review of Psychiatry is the property of Routledge and its content may not be copied or emailed to multiple sites or posted to a listserv without the copyright holder's express written permission. However, users may print, download, or email articles for individual use.