CONTENT-BASED RATE CONTROL SCHEME
FOR
VERY LOW BIT-RATE VIDEO CODING
Chun-Hung Lin' and Ja-Ling Wu1,2 'Communication and Multimedia Lab.
Department of Computer Science and Information Engineering National Taiwan University, Taipei, 106, Taiwan, R.O.C.
*Department of Information Engineering National Chi Nan University
Puli, 545, Taiwan, R.O.C.
ABSTRACT -
In t h e applications of very low bit-rate video cod- ing, t h e quality of t h e encoded pictures always suf- fers from serious degradation d u e t o limited band- width. T h e quantization levels, in typical video cod- ing systems, a r e adjusted depending only on t h e full- ness of t h e o u t p u t buffer while t h e content of t h e video is not taken into account. T h i s explains why t h e picture quality varies saliently in very low bit- r a t e applications.
In t h i s p a p e r , a content-based bit-rate control scheme is proposed. I n t h i s approach, t h e content of t h e coded picture is first analyzed t o find t h e main a t t r i b u t e s of each macroblock. T h e a t t r i b u t e s of t h e macroblocks a r e t h e n consulted while adjusting t h e quantization levels. In o t h e r words, t h e quantiza- tion levels a r e adjusted not only depending on t h e fullness of t h e o u t p u t buffer b u t also on t h e content of t h e coded material. Simulation results show t h a t t h e perceptual quality of t h e coded pictures, by us- ing t h e proposed m e t h o d , is b e t t e r while comparing with t h e traditional non-content-based approach.
1
INTRODUCTION
Many int,erna.tional video coding standards have been a.pplied to different kinds of video coding applications, such as ITU-I H.261 for audiovisual services a t p x 64 kbits [l], I S 0 MPEG-1 for digital storage media at 1.5 Mbit/s
[a],
andI S 0
MPEG-2 for a wide range of ap- plications at 2-15 Mbit/s [3]. The most recent video coding standardization focuses especially on the very low bit-rate coding techniques, such as H.263 [4] and MPEG-4 [5].T h e basic structure of an H.263 coder still comes from
the traditional MC/DCT hybrid coding approaches. Al-
though it has been shown t h a t a.n H.263 coder can meet tjhe very low bit-rate constraint, but, it, is widely aware of that, the picture quality and resolution of the coded video degraded. However, since the other subtle meth- ods have not been set a.nd the complexity of t,he H.263 codec is not, high, it is &ill the best, choice nowadays for very low bit-rat*e video coding applications.
When the hybrid coding met,hod is applied, both the temporal frequency and tjhe quant,izat,ion levels ca.n be adjusted depending on the stjill available bit,-rat,es. T h e
movement of objects in the video sequence will not, be smooth if the temporal frequency is not, st,at,ic.. Sii-rri- larly, the picture quality will not be stable if the quaii- tization level varies frequent,ly. I n a. t,ypical video coding system, the quant,iza.tion levels are adjusted according to the fullness of the output buffer. Beca.use tJhe a.d.just,- ment does not, take the cont,ent, of t-he coded pict.iirrs
into account, the picture qualit,y will not be stable es- pecially when the given bit-rate is insufficient.. In the proposed method, the temporal frequency is fixed be- cause the audiences are more sensible to the unsteady movement of objects, a.nd the unstable picture qua.1- ity will be improved by a content-based bit-rat,e control scheme.
The coding rnaterial in very low bit-rate applications is often composed of the head-and-shoulder images. It can be found t,hat the pictaure quality of the critical ar- eas, such as eyes, mouth, a.nd the face area., is more important and noticeable. One interesting and unique fact for very low bit-rate video applications is tha.t: the lightly moving regions are not so sensible as their
124 IEEE Transactions on Consumer Electronics, Vol. 43, No. 2, MAY 1997
heavy moving count,erparts. This is because the whole temporal fra.me rate is relative low as compared with the medium- or high- rate video applications. i n other words, t,he hea.vy moving regions are more critical t h a n t,he lightly moving regions in t,he very low bit-rate video a.pplicat>ions.
i n [,he proposed conLent-based bit-rate control scherne, t,he content of t8he coded material is taken into consideratmion while adjusting t h e quantization levels. The picture quality of the lightly moving regions are sacrificed t,o enha.nce t,hat of the heavy moving regions. Beca.iise most people will concentrate more on the criti- ca.1 a.reas a.nd t,he corresponding perceptual picture qual- it,y should be better.
‘lliis paper is organized as follows. In Section 2 , an overview about, the system structure of the proposed bit,-rat,e control scheme is depicted. In Section 3, the rrietliod of separat,irig the active regions f r o m the back- ground region a.nd tjhe met,hod of ext,ract,ing the face region are ela.bora.t,ed. A genetic search method is in- t,roduced in Sec,tion 4 to find t8he feature points among t,he fa.ce region. The experimeiita.1 results are shown in Sec-tion
5
a.nd the conclusion is given in Section 6 .quality of the sequence, different kinds of bit-rate coii- trol schemes have t o be invest,igated. Since different regions of the video frames will receive different, levels
of concentration, the bit-rates can therefore be assigned depending not only on the fullness of t h e buffer but also on t h e importance of t h e coded regions. This kind of control scheme is called the content,-based bit,-rale COII- trol scheme
(CBCS).
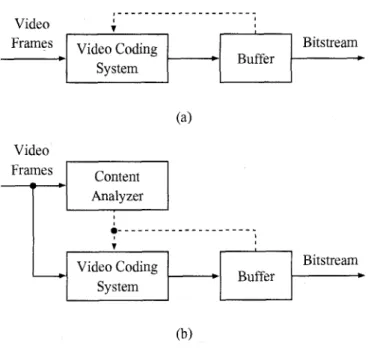
T h e block diagram of t h eCBCS
is depicted in Fig. l ( b ) .A
video fra.me is first analyzed bya content analyzer t o ext,ract active regions (e.g., fear tures, head and shoulder regions). Each region of the frame is then encoded based on t h e importa.nce of t,hat, region and on the fullness of the output, buffer.
Facial features, including eyes and mouth. havP the highest, priority t o be assigned more bitjs. so t,he qua.nt,i- zation levels in these regions should be finest, among all. The face region has the second finer qua.nt,iza,t,ion level, and the other act,ive regions (such as slioulder and head silhouette) have t h e coarsest, quantizat>ion level. T h e static background regions can be directly skipped for saving both b i b r a t e and encoding time.
The content analyzer is composed of four compo- nents, as shown in Fig. 2. T h e function of ea.ch compo- nent i s summarized a s follows
2
OVERVIEW OF THE SYSTEM
STRUCTURE
1) E x t r a c t i o n o f A c t i v e , Regions: T h e act,ive re-Fig. 1 ( a ) shows a traditional video coding system [6]. In order tjo meet, tjhe constant bit-rate constraint, t h e quantiza.tion levels in t>he coding system are adjusted a.ccording t o the fullness of the output buffer. T h a t is, t,he yiia.nt,ization level o f t h e current, encoded unit (a. macroblock in most of the cases) depends OII how many bit,-rates a.re consumed by the previous encoded unit,s. In medium or high bit-rate video coding systems, this kind of bit,-rate cont~rol scheme works successfully. T h e variat,ion of video quality caused by the changing of qua.ntization levels is not so prominent because the qualitmy of the whole video fra.mes is much higher than the perceptible level. Whereas, some of the video frames will suffer from serious qua.lity degradation due t80 the unst,eady changing of quantization levels in very low bit- rate video applications. i n order t o improve the whole
gions are separated from t h e background regions in the first component. T h e distinctions of differ- ent regions are decided based on the error image generated from the current encoding picture and its preceding one.
2) Thresholding of A c t i v e Regions: T h e intensity values of the active regions are converted t,o bi- nary values. T h e active regions are then divided
into two kinds of subregions. T h e subregion with higher intensity value will be expected t,o contain the face region because lighting always focuses on t h a t region
3) Extraction of Face Region: A starting point, is first determined and t h e region growing scheme [7]
from the starting point,. A rectangle region is se- lected from the candidate region as the face region.
4) Genetic Search of Facial Features: The critical facia.1 fea.t,ure points are searched among the face region based on an evaluation funct,ion. In or- der to reduce t,he comput,ational complexity, a. fast search scheme developed from the genetic algo- rithms (GAS) [8] is a.pplied.
3
EXTRACTION OF ACTIVE AND
FACE REGIONS
The active regions that contain the moving object,s, i.e., the protagonist in the video scene, are extracted from the coding frame. The other regions are then considered
a.s the ba.ckground regions. In typical video coding sys- tems, each macroblock has to be motion compensated, encoded, and decoded to determine its coding type. In the proposed system, t,he att,ribute of the coded mac- roblock has been known at the initial stage, so the re- dundant, computations can be saved. Because most of the scenes, in a head-and-shoulder image, are covered by background regions, the computations saved in this part will compensate most of the computations spent on t,he cont,ent analyzer.
In order to determine the active regions, an error im- age E is generated as,
where (z. y) represents tjhe coordinate of the processed pixel. I and I’ respectively represent the current, and the previous pictures, and T is a predetermined inten- sit,y t,hreshold (T = 3 in our imp1ementat)ion). Each macroblock B has a difference-value D ( B ) which is de- fined as,
( X , Y ) E B
The macroblocks with D ( B ) larger than a predeter- mined threshold
H
(which is set to be 5 in our imple- mentation) a.re selected as the active macroblocks. Amacroblock is also assigned to be an active macroblock
if both its horizontal neighboring rrmroblocks or ver- tical neighboring macroblocks are active macroblocks. Therefore, the active macroblocks can be defined a.s
i.1 I
The threshold value
Ii’
is calculated from the intensity of the overall active macroblocks t o minimize thr iriifhingroup uarianre U;, [SI, thar is
and i = t + l t i H ( i ) / q 1 ( t ) . i = O 255 t (7) i = t + l
where
H
is the histogram statistics of the active regions, that ISH ( i ) =
#{(x,
Y ) l A ( B [ z / i 6 ] , [ y / 1 6 ] ) = 1 and I z , y i } . (12)The thresholded image C is first processed by the closing operation and then the opening operation [9]. A starting pixel has t o be found for growing the face region. The macroblock with the maximum error energy is selected from the active macroblocks based on the
126
IEEE
Transactions on Consumer Electronics, Vol. 43, No. 2, MAY 1997I
energy function defined a.sBecause tjhe int,eiisity and the density of edges in the fa.ce a.rea are usually higher than the other areas among the video scene, t h e selected macroblock will locate on the face region. T h e starting pixel is set to be t h e cen- tral point, of the selected macroblock. By applying t h e region growing techniques [ 7 ] , a region can be generated from tjhe stmting pixel. A reetjangle is then constructed t o surround the grown area. In order t o exclude the neck region from t h e grown area, the lower boundary of the rectangle is adjusted so t h a t the height of the rectaangle is equal to its widt,h. T h e so-obtained square area is defined as the face region.
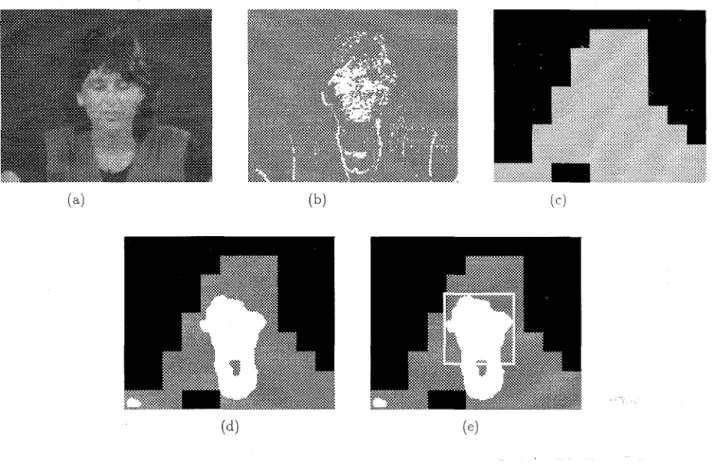
An exa.mple of face region locating is illustrated in Fig. 6. T h e original picture selected from the “Miss America.” sequence is shown in Fig. 6(a). T h e error image genera.t,ed froin the original pictaure and its pre- ceding one is shown in Fig. 6(b). Fig. 6(c) shows the actfive inacroblocks in the error image.
It
can be seen t,lia.t, t,he whole body of the lady is totally covered by the actfive ma.crob1ocks. The thresholded image is shown in Fig. 6 ( d ) . Because t,he ima.ge is processed by closing a.nd opening, the face area is regular. The face regioncan t,herefore bc found from the thresholded image. In Fig. Si.), it- is shown tha.t. trhe face region is surrounded by a rectangle.
the intensity variation within t,he ma.sked a.rea), C, is
a central weighting function (which is used tjo comput,e t h e intensity difference between the cent,ral part and t,he boundary parts of t h e masked area) I K is a. consmit,, I, means the intensity of the point p , and U is a. unit, step function.
T h e mean crossing function is applied t o detect, tlhe intensity variation within t h e square area a.round the evaluating point. Let dt represents t h e length of the square area, ( d t
+
I)
I-D signals can be taken from the square area row-by-row, and another ( d t + l ) 1-D signals column-by-column. T h e corresponding mean crossing values for these I-D signals are ca.lculated. T h e total mean crossing valueC,
is defined t o be t h e s u m of these mean crossing values, t h a t isd t / 2
Cm(z,
Y)
= K ( z , Y+
i)+
Y e ( ,+
i, Y ) l , (15) i = - d 1 / 2where ( z , y ) is t h e coordinate of t h e evaluated point, and V, and V, are the mean crossing values of t h e row signal and the column signal which are respectively de- fined as: d t I 2 Y ( x , Y) = U-s~(z+i,y).s~(“+i-l,y)-l, (16) V C ( X . Y ) = U-S,(r,y+i) S,iz,y+i-1)-1. (17) i = - d t / Z + l z = - d * / % + l where
4
GENETIC SEARCH O F FACIAL
FEATURES
Basically, t,he face region can be divided into three sub- regions. As shown in Fig. 3, the subregion
R,
is ex- pect,ed t o cont,ain t h e right eye feature point, while the left eye fea,ture point is expected t o appear inRb
,and t h e mouth fea.ture point is inR,,.
To extract the critical feature points from the face region, a generic feature cost function is defined as,
F ( P o ) =
C, (PO)
+
U I ~ ~ - I , , ~ - ii.UI,,
-I,, - ii.C,(PO)
(14)where po is the evaluated candidate feature point, C, is a mean crossing function (which is used to accumulate
and
S c ( z , y + i) =
T h e mean value p, is computed for each evaluated 1-
where Km is a constant. The number of p,-crossings of the 1-D signal within the bar area is calculated. If the intensity variation of
the
signal is large, the mean cross- ing value will also be large. Because the crossing value is comput,ed on tJhe bar area, slight intensity variation caused by noise will be eliminated. While comparing with the other non-fea.ture areas, the intensity varia- tions in the feature areas are relatively large, and so are the corresponding mean crossing values. For the sakeof saving computations, we only extjract t,en lines (five for each direction) near the center of the square area to calculate the crossing values.
The central weighting function is included in the cost function because of the fact, tjhat the intensity difference between the central part and the boundary parts of the feature area is large. As shown in Fig. 4, three mean values p c , pu
,
a.nd pl a.re calculat,ed for the three differ- ent, subregions (Bo,B 1 ,
and &) within t,he square a.rea. The central weight,ing function is defined as,where
(23)
and I<, is a constant.
It is obvious that the intensity difference between main feature points and those points below and near the main feature areas are large. Therefore, unit step functions are included in (14) to prevent from selecting the other features, such as eyebrows and nose.
Each possible point in the face region is evaluated based on the cost function given in (14). The points with maximum matching values in different subregions are selected as the feature points. Fig. 5 shows an exam- ple of the extracted feature points. The computational complexity will be very high if each point of the face region is evaluated to find the best matches. Therefore,
a genetic search algorithm was proposed to relieve the computational burdens [lo].
Let S be a solution spa.ce and all the elements in
S
have their associated fitness values. A straightforward way to find the element with the maximum fitness value is to search among all the elements and to compare their fitness values. However, the computational complexity will be very high if the space size is 1a.rge. In order to reduce the computational complexity, an efficient sea.rch algorithm should be applied.If GAS
are applied t80 search for t,he global ma.ximum inS,
a population P is maintained which consists of N elements, where N is the populat,ion size. Ea.ch element, in P is called a chromosome which is composed of a. list, of genes. T h e population P will evolve into a.not,her population P’ by performing some genet,ic operat,ions. The chromosomes with higher fitness values will have more probability to be keptin
tshe popula.t.ion of t>henext, generation and tjo propa.ga.te t>heir offspring. On
the other hand, t,he weak chromosomes whose fit,ness
values are small will bp replaced by anot,lrer stronger chromosomes. Therefore. t,he quality of the chrorrio-
somes in the population will be bet#ter and hett,er. ,4ft,er
a suitable number of generations, the mature popuhtion will be expected t,o contain the element, with the global maximum value.
5
RATE CONTROL SCHEME
To meet the designate bit-rate constraint in the cod- ing system, a suitable bit-rate control scheme is a must. In our system, the adopted bit-rate control scheme is modified from the one given in [13] which, basically, is a frame-based approach and is called frame-based bit,- rate control scheme (FBCS) in this paper. The quan- tizer parameter Q p of each macroblock is identical in t,he
same picture. T h e value of Q p will be modified while
encoding a new picture as
min(31,
Qh
+
Q},Qb
e l s e ,bL
>
b R . 1.15,128 EEE Transactions on Consumer Electronics, Vol. 43, No. 2, MAY 1997
and
Q = m a x { l , O . l ~ Q ~ } ,
(25)
where
QL
is the quantizer parameter of the previous picture, b~ is the number of bits used for the previous picture, and bR is the current average number of bits for each picture, that iswhere h represents the ta.rget bit-rate and f is the frame d e .
Different, quant,izer parameters are set for different macroblock tjypes. The macroblocks which belong to the fea.t,ure axeas require the finest quantization steps. Their quantizer parameters are set to be max{ 1. Q, - d l } . The qua.ntizer pa.rameters of the macroblocks in the face region are set, to be max(1, Q p - d 2 } , and that of
the ot,her a.ctive macroblocks are Q,. Because the max- imum allowable differentiad value of the quantizer pa- ra.meters betjween two neighboring coded macroblocks is 2 in H.263 coders, cll and clz are respectively selected a.s 4 and 2 in our implementation.
6
EXPERIMENTAL RESULTS
T h e proposed CBCS was tested on t,wo QCIF (176 x 144 pixels) video sequences, “Miss America” and “Claire”
,
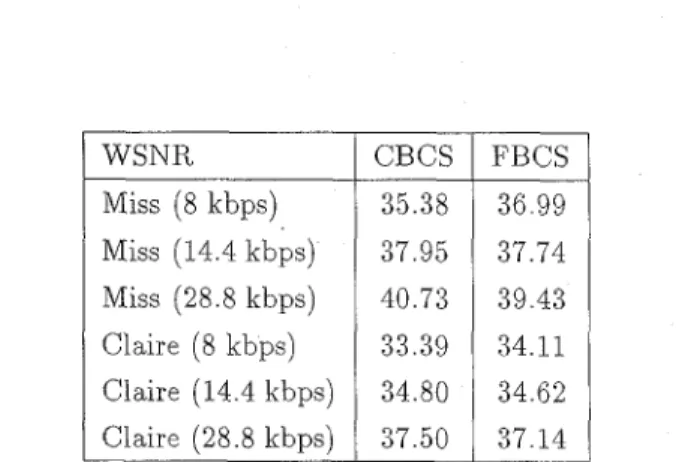
with fixed temporal frequency 12.5 frames per second (fps). Three different ta.rget bit-ra.tes are tested in the simulations: 28.8, 14.4, and 8 kbps. T h e frame-based &.-rat,? cnntsrol scheme (FBCS) presented in [13] was also irnpleinented for comparison.Table I shows the average PSNR values of the coded video sequences by using different, bit-rate con- trol schemes far various target bit-rates. Because the bit-ra.tes are diminished in the lightly moving regions, it follows from Table 1 that the average
PSNR
values using the CBCS are a little less than that of the FBCS. Nevertheless, the PSNR values can not evaluate the pic- ture qua.lit,y exa.ctly in this case because each pixel was assigned with different number of bits but has the same weight in the evaluation.In order to evaluate the picture qualitmy more cor- rectly, another evaluation function considering the im- por‘ance of different image regions has to be used. A weighted SNR (WSNR) evaluation function, which is similar to the one used for evaluating the quality of color images [14], is defined in this work as
2552
WMSE’
W S N R = 10 log
and
where N is the number of pixels belonging to tjhe active regions,
SI
represents the feature regions,5’2
rppresents the face regions,Ss
represents t,he other active regions, I, and 1; respectively represent the original intensity and the reconstructed intensity of the point p , and 71,7 2 , and r3 are the average bit countss per pixel of the re- gions
5’1,
Sa,
and&.
Since theWMSE,
defined in( 28),
has taken the allocated bit counts of each active region into account for picture quality evaluation, a better ob- jective evaluation result (which is expected t,o be closer to the subjective result) can be obtained. T h e averageWSNR values of different schemes are shown in Ta.ble 2.
It follows from Table 2 that the avera.ge WSNR. va.lues
of the CBCS are better t h a n t h a t of the FBCS when the target bit,-rate is greater t h a n 8 kbps.
T h e performance of the CBCS can also be test,ified by the subjective observation of tjhe encoded pictures. Fig. 7 shows the subjective quality of the decoded pic- tures by using different, bit-rate control schemes. T h e figure is a magnified version of one fra.me selected from the simulation results It is clear that, CBCS gives bet,ter perceptual/subjective picture quality t h a n FBCS does (especially on the feature regions) although its WSNR
value is worse than that of the FBMA at, 8 kbps. Fig. 7
shows t h a t the coded picture of t,he CBCS is free from serious blocking effects and the feature areas (e.g., eyes
and mouth) are more clear. Although there is a quality degra.da.t,ion on t,he edge of hair, it is always negligible. of different, types of regions, in the “Miss America.” sequence, are shown in Fig. 8. The MSE ratio of t.he critical area (especially tlhe feat,ure area.) decreases while tjhe CBCS
is applied. And this implies t,ha,t, t,he picture quality around the face region will be well improved. When the target, bit-rate is high, the above improvement, will be more prominent, as shown in Fig. 8(c). However, the improvement will not be so obvious when the target bit- rate is less than 8 kpbs. This is because the flexibility of qmntization parameters adjusting will be reduced due to tjightj limitjatjion of the total bit-rate.
The mean square error (MSE) ratios
Table 3 shows tjhe a.verage bit count ratios
‘
of differ- ent, types of regions. It i s shown in the table tha.t, the bit count, ratio of the critical area increases while theCBCS
is applied. This result shows once again that the pict,ure quality of the crit,ical regions will be enhanced when the proposed bit-rate control scheme is adopted.7
CONCLUSION
A content-based bit-rate control scheme is proposed, in t,his pa.per, t,o improve t,he perceptual quality of the pic-
ture in very low bit-rate video applications. 111 the pro- posed scheme, ea.ch coded pictme is analyzed first, and the critical regions (including feature regions, face re- gions. and the other active regions) are extracted. The macroblocks of each frame are tjhen classified into dif- ferent types according to which regions they belong t,o. T h e quantization level of each macroblock is adjusted depending both on the fullness of the output buffer and the types of tha.t, macroblock. Because finer quantizers are used in the critical regions. the overall perceptual qualit,y of t,he proposed control scheme will be better than that, of the traditional non-content-based bit-rate control schemes.
‘The mean square error ratio is defined as the individual mean square error normalized by the mean square error of the whole picture.
2The average bit count ratio is defined as the individual aver- age bit count normalized by the average bit count of the whole picture.
The proposed approach has been implemenkd and embedded in an H.263 coder. T h e simulat,ion result,s show taliat the proposed method promottes the percep- tual pictjure qua.lity of t,he coded pict,ures in trhe very low
bit,-rate applica.t,ions. The comput,a.t,ional complexity of
the proposed scheme is not high. T h e execiit,ion t,ime
of the H.263 coder using t h e proposed scheme is only about 6% higher t,han that of t,he original one. There- fore, it, is our belief tjhat the proposed scheme is fea.sible and very suit.able for very low bit,-rate video coding ap- plications.
References
ITU-T SGXV Recommendat,ion H.261 Video
codec f o r audio v i m a l services ut p x 6 4 Iibits/s. July 1990.
ISO/IEC
MPEG,
Coding of moving p i c f u i e a a i dassociated audio. Committee Draft of Standard IS011172, Dec. 1991.
ITU-T Recommendat,ion H.262, ISO/IEC 13818-2,
Generic coding of ,mowing pictnres and associated a U dio information . Dr a.ft, In t,erna t i on a.1 S t, and a.rd, Mar. 1995.
Draft ITU-T Recommendation H.263. V / r l ~ o rodiizy
f o r
low
bitrat? rommunicntion .July 1995ISO/IEC JTC/SC29/WG11 N937. MPEG-4-
Proposal Package Description (PPD)-R~vzszon 2. Mar. 1995.
“Description o f reference model 8 (RM8) ,” CCITT
SGXV WG4, Specialist,s Group on Coding for Vi- sual Telephony, Doc. 525, June 1989.
R.
C. Gonzalez and P. Wint,z, Digital Image Pro- cessing. 2nd edition, Addison-Wesley PublishingCompany, Inc., 1987.
D. E. Goldberg, Genetic Algorithms in Search, Optimization & Machine Learning. Reading:
130 IEEE Transactions on Consumer Electronics, Vol. 43, No. 2, MAY 1997 WSNR Miss (8 kbps) Miss (14.4 kbps) Miss (28.8 kbps) Claire (8 kbps) Claire (14.4 kbps) Claire (28.8 kbps)
[9]
R.
M. Haralick a.nd L. G . Shapiro, Computer and Robot Vision, Volume 1. Addison-Wesley Publish- ing Compa.ny, Inc., 1992.[ l o ] Chun-Hung Lin and Ja-Ling Wu, “Genetic block ma.tching adgorithm for video coding,” i n Proc.
IEEE
Int. Conf. on Multimedia Computing and Systems, Hiroshima J a p a n , pp. 544-548, June1996.
[ll]
R. L . Graham,D.
E. Knuth, and0.
Patash- nil<, Concrete Math e m ata cs 2n d edit ion. Addison-Wesley Publishing Company, Inc., 1994.
[12]
6 .
Syswerda, “Uniform crossover in genetic al- gorithms,” in Proc. 3rd Int. C‘onf. Genetic Algo-rith’m,s a n d Applications, CA, 1989, pp. 2-9.
[13] I<.
0.
Lillevold, “H.263 anchors for MPEG-4 t,ests,” in, Int. 0,rgan.izutzon f o r Standardization%Da.lla.s, Nov. 1995, ISO/IEC JTCl/SC29/WG11 MPEG95/0322.
[14]
J. W .
Woods, Subband Im,aye Coding. Boston:Kluwer Aca.demic Publishers, 1991.
CBCS FBCS 35.38 36.99 37.95 37.74 40.73 39.43 33.39 34.11 34.80 34.62 37.50 37.14 PSNR. Miss (8 kbps) Miss (14.4 kbps) Miss (28.8 kbps) Claire (8 kbps) Claire (14.4 kbps) Claire (28.8 kbps) Miss (8 kbps) Miss (14.4 kbps) Miss (28.8 kbps) Claire (8 kbps) Claire (14.4 kbps) Claire (28.8 kbps) cbcs-ft
1
cbcs-fa. 0.58 0.22 0.201
0 0.53 ~0.23
0.24I
0
0.62 0.21 0.49 0.23 0.48 0.27 0.25 , cbcs-at,1
cbcs-bg 0.51 0.26 0.23j
o
CBCS Miss (8 kbps) Miss (14.4 kbps) Miss (28.8 kbps) Claire (8 kbps) Claire (28.8 kbps) Claire (14.4 kbps) 34.22 34.65 37.61 32.82 34.41 35.91 f’bcs-ft f’bcs-fa fbcs-at, fbcs-bg 0.49 0.24 0.26 0.01 0.48 0.23 0.26 0.03 0.54 0.20 0.21 0.05 0.45 0.26 0.28 0.01 0.41 0.29 0.26 0.04 0.42 0.30 0.22 0.06 FBCS 34.23 36.29 37.69 32.99 34.95 37.08Ta.ble 1: Com,pa,risons of the average PSNR values using different bit-rate control schemes.
Table 3: Bzt count ratio lists (ft: feature regaon, fa: face region, at: the other active regaons, bg: backgro,und
Macroblock Classifkation 4 ofFace
-
Extraction Region Genetic Search of Facial Features I IL r l
Video Coding-*uifrrI
Bitstream,System
Figure 1: Comparison of dzflerent rate control schemes.
Figure 2: The bask structure of the content analyzer.
Figure 3: Three subregrons are selected from the face regaon to extract the main features rn the feature ea- tractang process.
Figure 4: The evaluation of the rrntral w c i y h f i n y
Figure 5: Feature exhraction res,ults ruhich are de,m,on- strated on, (a) the thresholded i m q e before performing closing and opening and (b) the original image.
132 E E E Transactions on Consumer Electronics, Vol. 43, No. 2, MAY 1997
Figure
6
Intermediate results an different stages of the a c h e regzon findang processes. ( a ) the oraganal pacture,(b) the difference image generated from the current pacture and the prevaous pacture, ( e ) the actave regaons, ( d ) the thresholdcd imagc aftpr performang openang and closang, (e) the face regaon andacated by a rectangle
Figure 7 : Subjective results of Frame 66 of the “Miss America” sequence at 8 kbps, ( a ) using the
FBCS,
(6) ,using theCBCS.
1 11 21 31 41 51 61 71 Frame Number (a) I 11 21 31 31 51 61 1 Frame Number (b) ,.