Excited-State Dynamics of [(1,1
′
-Biphenyl)-4,4-diyldi-2,1-ethenediyl]bis(dimethylsilane)
Kuan-Lin Liu, Sheng-Jui Lee, and I-Chia Chen*Department of Chemistry, National Tsing Hua UniVersity, Hsinchu, Taiwan 30013, Republic of China
Chao-Ping Hsu
Institute of Chemistry, Academia Sinica, Taipei, Taiwan 115, Republic of China
Mei-Yu Yeh and Tien-Yau Luh
Department of Chemistry, National Taiwan UniVersity, Taipei, Taiwan 10617, Republic of China ReceiVed: August 28, 2008
The relaxation dynamics of excited electronic states of [(1,1′-biphenyl)-4,4′ -diyldi-2,1-ethenediyl]bis(dim-ethylsilane) dissolved in various solvents with varied polarity and viscosity have been investigated. Upon excitation at wavelength 266 nm, we measured the fluorescence curves that exhibit a rise time constant∼100 fs, and two decay time constants, 7-65 ps and∼1 ns. We attribute the former decay to upper excited states to the S1state, and the latter decay to geometric relaxation and the lifetime of the S1state. Only the tens of
picosecond decay shows a dependence on the solvent viscosity, indicating that the torsional motion dominates the relaxation. Theoretical calculations were performed to obtain the optimized structures of the free [(1,1′ -biphenyl)-4,4′-diyldi-2,1-ethenediyl]bis(dimethylsilane) molecule in its ground and first excited states with methods B3LYP/6-311G(d) and CIS/6-311G(d), respectively. The results of these calculations show that the dihedral angle between the two phenyl rings is∼34°for trans and∼38°for cis conformers in the ground state and that the first excited state has a planar structure, in agreement with the experimental results that indicate that the torsional motion of two phenyl groups elevates the relaxation of the S1 state. Enhanced
vibrational relaxation of S1 in alcoholic solvents is observed. Rapid relaxation in methanol-OH compared
with that in methanol-OD is explained by the excess energy dissipated efficiently through high-frequency vibrational mode (>500 cm-1).
Introduction
Electronic and geometric structures of organic molecules in excited states have attracted much attention in photophysics and photochemistry.1-4An understanding of structural relaxation in
flexible aromatic molecules in excited states is of particular importance. It is widely accepted that oligophenyls and their polymers have torsional degrees of freedom in their ground-state, whereas they undergo conformational modifications upon photoexcitation, typically from aromatic toward quinoidal geometries.5,6An improved understanding of the conformational
relaxation of these oligophenyls is essential in their use in optoelectronic applications.7,8 The conformational relaxation
essentially reflects the altered electronic structure upon photo-excitation, which results in strengthening of the inter-ring bonds. Hence the steric hindrance imposed by hydrogens at ortho positions can be overcome, and the planarization is facilitated. Concomitant with twisting of a σ bond, the conformational relaxation is generally coupled to many vibrational degrees of freedom. The Raman excitation profile of biphenyl indicates that in S1the major geometric change involves CdC stretching
vibrations.9 Theoretical calculations of poly(p-phenylene
vi-nylene) indicate that olefin CdC (∼1300 cm-1) and phenyl CdC stretching (∼1700 cm-1) modes are coupled to planariza-tion in the first excited state.10,11The effects of a solvent on the
relaxation dynamics in the excited state can thus be complicated.
Time-resolved fluorescence and transient-absorption experiments are commonly performed to monitor the rates of relaxation of an excited state of molecules in various solvents; these rates are then compared with the solvent bulk properties to have an understanding of the photophysics and photochemistry of the excited state.
The minimum of the torsional potential of biphenyl in the ground state is determined to be∼42°, whereas the first excited state is planar.12 Iwata et al. reported measurements of
time-resolved fluorescence of biphenyl in hexane; those authors found two distinct decay processes with time constants within 20 ps and assigned them to internal conversion and vibrational relaxation.13Transient absorption spectra of biphenyl have been
studied by Fiebig et al.; their results indicated two time constants, 400 fs and 12 ps, that they assigned to relaxation of the conformation. This biphasic geometric relaxation implies that multiple nuclear coordinates are involved.14The geometry
of p-terphenyl in the ground and excited states is similar to that of biphenyl. Theoretical calculations have shown that a rigorous Franck-Condon treatment of both high-energy phenyl CdC stretching vibrations and low-energy ring librations is sufficient to reconstruct the steady-state spectra.15Gustafson et al. used
time-resolved Raman spectroscopy to study trans-4,4′ -diphe-nylstilbene (DPS); their results showed that geometric relaxation and vibrational relaxation are complete within 40 ps in the S1
excited state, for which the geometric relaxation is attributed to the transition from a nonplanar (ground) to a planar (excited state) structure in the biphenyl portions.16 In addition, the
* To whom correspondence should be addressed. Electronic mail: icchen@ mx.nthu.edu.tw.
10.1021/jp807662g CCC: $40.75 2009 American Chemical Society Published on Web 01/21/2009
Downloaded by NATIONAL TAIWAN UNIV on August 31, 2009 | http://pubs.acs.org
transient absorption spectra of DPS indicated that the rates of vibrational relaxation correlate with the thermal diffusivity of the solvent, whereas the geometric relaxation is affected by both the viscosity and the dielectric constant of the solvent.17 The
solvent thus plays a subtle role in determining the paths of relaxation from the excited state.
We measured the femtosecond time-resolved fluorescence of a para-substituted biphenyl, [(1,1′-biphenyl)-4,4′ -diyldi-2,1-ethenediyl]bis(dimethylsilane) (formula in Scheme 1), in sol-vents with varied viscosity, dielectric constant and protic or aprotic nature. This molecule might prospectively serve as an energy donor in light-harvesting copolymers; with a suitable acceptor, the efficiency of energy transfer is over 85%.18 An
enhanced knowledge of the molecular photophysics in the excited state is crucial in unraveling this energy transfer. We performed theoretical calculations to elucidate the structure of this molecule in both ground and first excited states; the results indicate that this molecule is twisted in the ground state but planar in the S1excited state. From the steady state in absorption
and emission spectra, we infer a conformational change upon photoexcitation. To clarify the details of the geometric relaxation process and the role of solvent in the relaxation, a systematic test of solvents is thus pertinent.
Experiment
A. Fluorescence Up-Conversion. The laser system and other apparatus for measurements of fluorescence up-conversion are described as follows. The light source is a femtosecond mode-locked Ti:sapphire laser (Spectra-Physics, Mai Tai) pumped by a Nd:YVO4laser (5 W cw, 532 nm, Spectra-Physics,
Millennia-type). The oscillator generates a pulse train (82 MHz, 800 nm, average power∼450 mW) of which the third-harmonic pulses generated with two nonlinear crystals (BBO, type I) were focused with a lens (50 mm) onto a rotating sample cell (path length 1 mm) for excitation. The residual fundamental pulse served as an optical gate. To detect the fluorescence at the magic angle, in parallel and perpendicular orientations, we rotated the excitation polarization with respect to the gate polarization. The fluorescence was collected and focused onto a crystal (BBO, type I) for sum-frequency generation with 90°off-axis parabolic mirrors (5 and 7 cm, respectively). The gate pulse, after traversing a variable delay stage, was noncollinearly (∼12°) focused with a lens (10 cm) onto the sum-frequency crystal. The sum-frequency signal collected with a lens and separated from other light with an iris and a band-pass filter then entered a double monochromator. The signal ultimately impinged on a photomultiplier tube in combination with a photon counter. Various emission wavelengths were selected upon rotating the SFG crystal and tuning the monochromator. The full width at half-maximum (fwhm) of the cross-correlation trace is 230 fs for excitation at 266 nm.
B. Time-Correlated Single-Photon Counting. Picosecond time-resolved fluorescence was measured with time-correlated single-photon counting (TCSPC). The source of light was the same laser system as used to measure fluorescence up-conversion. A fraction of the generated third harmonic of the 800-nm beam served as the excitation source. A sample was contained in a cuvette (1 mm); the concentrations were the same
as those for the fluorescence up-conversion experiments. The fluorescence was filtered with a bandpass filter and detected with a multichannel plate photomultiplier. The instrument response function was 30 ps at fwhm.
C. Theoretical Calculation. Quantum-chemical calculations were performed with the Q-Chem program package.19 The
optimized geometries of the ground-state were obtained at level B3LYP/6-311G(d). Vertical excitation energies were calculated with time-dependent density functional theory (TDDFT) at level B3LYP/6-311G(d). The geometries of the first excited state were obtained at level CIS/6-311G(d). To obtain the potential-energy surface, we varied two torsional angles: the dihedral angle for phenyl-phenyl groups (φ1), and the one between the phenyl
and the neighboring vinylsilane groups (φ2). At each point, φ1
and φ2were held fixed while other degrees of freedoms were
optimized. The geometries and the vibrational frequencies of the ground state were obtained with the B3LYP, or Hartree-Fock (HF) methods with a 6-311G(d) basis set. The energy surface for the first excited-state was obtained with CIS/6-311G(d). The vibrational frequencies served to test the stability of the structures and to estimate the correction for zero-point energy (ZPE).
D. Samples. The preparation of [(1,1′-biphenyl)-4,4′ -diyldi-2,1-ethenediyl]bis(dimethylsilane) is described elsewhere.18All
solvents;chloroform, hexane, p-dioxane, i-octane, methanol (MeOH), methanol-OD (MeOD), ethanol, acetonitrile, 1-butanol (all from Aldrich), and hexadecane (Fluka);were spectrosco-pic grade and used as received. The steady-state absorption and fluorescence spectra were recorded with a spectrometer (Hitachi U3300) and a fluorimeter (Perkin-Elmer F4500), respectively. Measurements of the fluorescence quantum yield were made with dilute solutions (net absorbance < 0.1). The values were calculated according to the following equation:20
Φs) Φstd(Is⁄ Istd)(Astd⁄ As)(ns⁄ nstd) 2
(1) in which appear quantum yieldsΦsandΦstd, integrated emission
intensities Isand Istd, and absorbances Asand Astdof the sample
and standard, respectively, at excitation wavelength 315 nm, and refractive indices nsand nstdof solvents used to prepare the
sample and standard, respectively.
For time-resolved measurements, the excitation power was less than 2 mW, and absorption spectra were recorded before and after measurements to ensure no sample degradation. The absorbance of the solution for fluorescence up-conversion measurements was less than 0.4 at the excitation wavelength.
Results
A. Steady-State Spectra. The absorption and fluorescence spectra of [(1,1′-biphenyl)-4,4′ -diyldi-2,1-ethenediyl]bis(dim-ethylsilane) in p-dioxane are presented in Figure 1. For all solvents, including protic and aprotic, the absorption spectra are structureless, whereas the fluorescence spectra exhibit a vibronic progression (∼1300 cm-1). This feature is typical of a molecule exhibiting torsional disorder in the ground state but a planar excited state. We inferred from the steady-state spectra that geometric relaxation might occur in the excited state. The fluorescence quantum yields measured are 0.91-0.97 for the solvents used; the large yield implies a rigid structure of the excited state. The features of steady-state spectral measure-ments and the fluorescence quantum yields in various solvents are summarized in Table 1. Relative to biphenyl, there is a red shift∼45 nm in absorption and fluorescence peak positions due to vinyl substituents at the para positions that effectively extend the length of conjugation. The absorption and fluorescence SCHEME 1: Structure of [(1,1′-Biphenyl)-4,4′
-diyldi-2,1-ethenediyl]bis(dimethylsilane)
Downloaded by NATIONAL TAIWAN UNIV on August 31, 2009 | http://pubs.acs.org
maxima are similar in these solvents, irrespective of the polarity, and the effect of hydrogen bonding on the spectrum is slight. B. Theoretical Calculation. The results for vertical excita-tion energy and oscillator strength from TDDFT for the trans-and cis- isomers are listed in Table 2. The oscillator strength f of the S0fS1transition is∼1.4. These results also show that
this molecule populates mainly the S4 excited-state upon
excitation at 266 nm.
In the ground state, the molecule has a trans or cis conformation through rotation of the bond angle between the two phenyl rings or between a phenyl and the attached vinylsilane group (see Figure 2). The trans isomer is more stable; there is a small energy difference (0.6 kJ/mol at B3LYP/6-311G(d) with ZPE correction) between the two isomers. In the optimized ground-state structure, the bond length is about 1.48 Å between the two phenyl rings and 1.47 Å between the phenyl-vinylsilane groups. The dihedral angle between the phenyl rings is 34.3°and 38.1°for the trans and cis isomers, respectively, similar to biphenyl in the ground state; this result implies a minor effect of substituents at the para position on molecular structure. The dihedral angle between the phenyl ring and the vinylsilane group is 12.7°and 4.8°, respectively for trans and cis isomers.
Similar to the ground state, the geometry in the first excited-state has a cis and a trans conformation with a tiny energy difference (0.77 kJ/mol at CIS/6-311G* with ZPE correlation). In contrast with the ground state, the molecule has a planar structure of point groups C2hfor trans and C2Vfor cis. Because
the S1state arises from theππ* transition of the two phenyl
rings, the two phenyl groups favor a planar structure. The C-C bond distance between the two phenyl rings is 1.42 Å, and is 1.44 Å between the phenyl and vinylsilane groups. The shorter bond lengths are consistent with a partial double-bond character due to transition to theπ* orbital in the first excited state.
According to both the B3LYP and HF surfaces for the ground state, the torsional energy barrier for φ1is smaller than that for φ2. The torsional barriers relative to the trans form (B3LYP/
6-311G(d) with ZPE correction) are 10.2 kJ/mol for φ1and 17.6
kJ/mol for φ2. In S1, however, the torsional energy for φ1 is
larger than that for φ2because of the partial double C-C bond
between the two phenyl rings. The barrier heights relative to the first excited-state energy are 71.4 and 36.8 kJ/mol, respec-tively. The torsional potential-energy surfaces for the ground and first excited states are shown in Figure 3a,b, respectively. C. Fluorescence Decay Curves and Proposed Kinetic Model. TCSPC measurements were performed at wavelengths 360, 380, and 440 nm after excitation at 266 nm. On this time scale, a monoexponential decay curve is obtained for all solvents. The fitted time constants for ∼1 ns differ within a standard deviation at the wavelengths measured; the averaged fitted time constants with error bars of approximately (5% are listed in Table 3. The average time constants are about 0.97 and 0.87 ns in polar and nonpolar solvents, respectively, and are assigned to the lifetimes of the first excited state. In a polar solvent, the fluorescence lifetime increases slightly from 0.84 ns in hexane to 1.02 ns in acetonitrile. For similar polarity, protic (MeOH) and aprotic (acetonitrile) solvents yield a similar time constant, which again indicates hydrogen bonding to exert only a minor effect.
With excitation at 266 nm we used fluorescence up-conver-sion to measure the decay at the short-time region. We detected the emission at wavelengths 355, 375, and 420 nm, which are in the S1emission region; each decay curve was collected from
-20 ps to 1.4 ns. Figure 4 shows the early part of the fluorescence signal at 375 nm in p-dioxane. A rapid rise component is consistently observed at each detection wavelength
Figure 1. Absorption (solid line) and fluorescence emission (dashed
line) spectra of [(1,1′-biphenyl)-4,4′ -diyldi-2,1-ethenediyl]bis(dimeth-ylsilane) in p-dioxane.
TABLE 1: Dielectric Constantεr, Viscosityη of Solvent,
Peak Position in Steady-state Absorption Amaxand in
Emission Spectra Flmax, and Fluorescence Quantum Yield
ΦFa
solvent εrb η /cPb Amax /nm Flmax/nm ∆ω /cm-1 ΦF
n-hexane 1.90 0.31 311 351, 368, 386 1292 0.92 i-octane 1.94 0.47 311 351, 368, 385 1258 0.95 hexadecane 2.05 3.34 314 353, 371, 388 1277 0.97 p-dioxane 2.21 1.54 315 355, 372, 390 1264 0.91 chloroform 4.80 0.57 314 357, 374, 393 1282 0.96 acetonitrile 38.8 0.38 313 353, 370, 389 1310 0.94 MeOH 32.6 0.6 314 352, 369, 387 1284 0.92 ethanol 24.4 1.08 313 352, 370, 388 1317 0.93 n-butanol 18.2 3.0 313 353, 371, 390 1343 0.96
a∆ω denotes the energy separation in peak positions observed in
the fluorescence spectra.b
Data taken from ref 21.
TABLE 2: Vertical Excitation Wavelength (nm) and Oscillator Strength (in parentheses) for Trans- and
Cis-Isomers Calculated at Level B3LYP/6-311G(d)
excited state trans cis S1 331.2 (1.4566) 330.6 (1.4297)
S2 285.6 (0.0000) 285.0 (0.0000)
S3 276.6 (0.0001) 277.1 (0.0032)
S4 273.9 (0.0038) 273.3 (0.0055)
S5 258.5 (0.0014) 258.5 (0.0065)
Figure 2. Trans (a) and cis (b) structures for [(1,1′-biphenyl)-4,4′ -diyldi-2,1-ethenediyl]bis (dimethylsilane) optimized at level B3LYP/ 6-311G(d).
Downloaded by NATIONAL TAIWAN UNIV on August 31, 2009 | http://pubs.acs.org
in these solvents. The fluorescence decay curves in i-octane at the three detection wavelengths are shown in Figure 5. All fluorescence decay curves in various solvents exhibit biexpo-nential decay with a rapid decay-time constant of 7-65 ps and another component-time constant near that obtained from TCSPC measurements. With these results combined from both techniques, we used this kinetic model to globally fit the experimental decay curves for all detection wavelengths:
S498 τ1 S1*98 τ2 S198 τ3 S0 (2)
in which S1*denotes vibrationally excited S1, andτ denotes the
time constant for each relaxation. The internal conversion to S1*
might be stepwise, but finite temporal resolution requires us to assume simply a single step for the internal conversion.
The experimental data show the rise time constant τ1 )
0.1-0.17 ps. As the time constantτ3for S1fS0is large, we
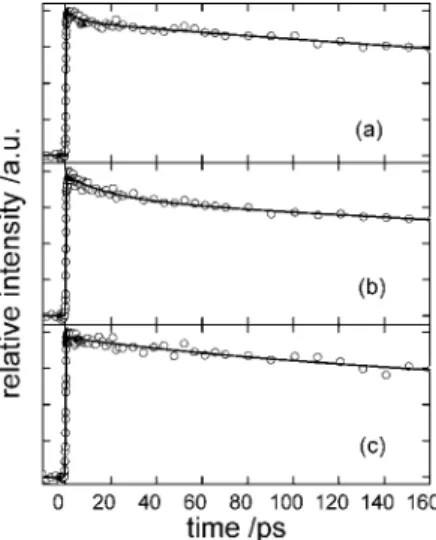
fixed it to the time constant obtained from TCSPC experiments. Table 3 summarizes the results of the fits. Figure 6 shows the fluorescence signals at 420 nm in n-butanol, acetonitrile, and hexadecane.τ2clearly decreased in a less viscous solvent but
is remarkably short in a protic solvent. In an aprotic solvent, the time constantτ2is independent of the wavelength detected
but increases with the viscosity as shown in Figure 7. This relaxation is hence hampered by solvent motion. Time constant τ2 shows no correlation with dielectric constant and thermal
diffusivity of a solvent, indicating that solvation in an aprotic
Figure 3. Potential-energy surfaces for rotation about C-C bonds
between the two phenyl groups φ1and angle between the phenyl and
vinylsilane groups φ2(a) in the first excited-state calculated at level
CIS/6-311G(d) (energy is relative to the lowest HF ground-state energy) and (b) in the ground-state at level B3LYP/6-311G(d).
Figure 4. Early fluorescence emission data (open circles) measured
at 375 nm in p-dioxane and the fitted curve (solid line) with a rise time constant of 0.11 ps convoluted with an instrument response function fwhm ) 230 fs (dotted line).
Figure 5. Fluorescence decay curves in i-octane at (a) 355 nm, (b)
375 nm, and (c) 420 nm. The experimental data points are in open circles; the solid lines denote the results of the least-squares fits with fitted time constantsτ2) 16 ps and τ3) 0.88 ns, respectively for all
detection wavelengths, but the fitted amplitudes varied with wavelength. The kinetic model is described in the text.
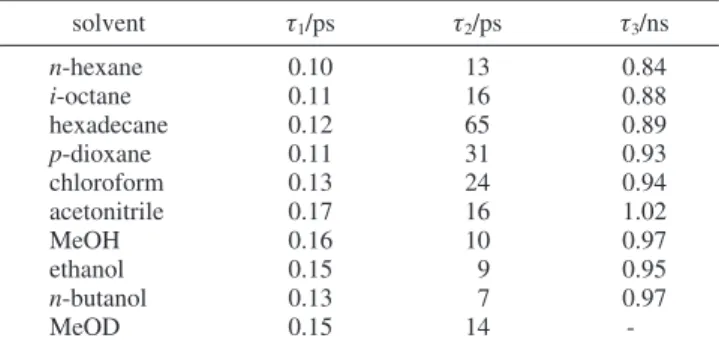
TABLE 3: Time Constants for Relaxation Obtained from Measurements of TCSPC and Fluorescence Up-Conversion
solvent τ1/ps τ2/ps τ3/ns n-hexane 0.10 13 0.84 i-octane 0.11 16 0.88 hexadecane 0.12 65 0.89 p-dioxane 0.11 31 0.93 chloroform 0.13 24 0.94 acetonitrile 0.17 16 1.02 MeOH 0.16 10 0.97 ethanol 0.15 9 0.95 n-butanol 0.13 7 0.97 MeOD 0.15 14
-Downloaded by NATIONAL TAIWAN UNIV on August 31, 2009 | http://pubs.acs.org
solvent is insignificant in these cases. In a protic solvent, the relaxation of S1*is much more rapid and shows no relation to
viscosity. The amplitude ofτ2is small at 355 nm but becomes
larger at larger emission wavelengths in these solvents, as shown in Figure 5, in contrast with the conventional concept that the long component has larger amplitudes at long wavelengths. Hence, our experimental data show that the relaxed S1state emits
at shorter wavelengths than the unrelaxed S1*.
Discussion
Upon excitation with 266 nm, [(1,1′-biphenyl)-4,4′ -diyldi-2,1-ethenediyl]bis(dimethylsilane) initially populates excited state S4. In the short-time region, the fluorescence signal
comprises an ultrarapid rise (τ1) and decay (7-65 ps)
compo-nents (τ2); we thus assignτ1to internal conversion to S1andτ2
to geometric relaxation of S1*. Nonradiative internal conversion
in aromatic hydrocarbon molecules is usually explained in terms of the well-established energy gap law;22,23this rate is related
to the energy gap∆E between states and is expressed as kIC∝
exp(-R∆E); R denotes the proportionality factor. The rise component τ1as listed in Table 3 increases slightly with the
dielectric constant of the solvent, which indicates that the energy gap is somewhat larger in a polar solvent if no intermediate state (S3 or S2) is involved. This trend is in contrast to that
observed in all-trans-β-carotene, for which the rate of S2-S1
internal conversion increases with the dielectric constant of the
solvent and the polarizability.24,25In contrast, the fluorescence
wavelength and shape are nearly invariant in each solvent, showing that the energy of the S1 state is similar in these
solvents. From absorption spectra the relative energy of the more highly excited states is difficult to estimate because of the featureless structure caused by the torsional broadening.26We are
thus unable to determine∆E and consequently its relation to τ1. Further investigation on varying the excitation wavelength
will clarify this issue.
For aπ-π* transition, the excited state tends to move toward a planar geometry as expected for biphenyl molecules. This geometric relaxation is indicated from both the steady-state measurements and the theoretical calculations. For aprotic solvent,τ2shows a linear dependence on solvent viscosity, as
shown in Figure 7. Combining these experimental data and the results of calculation, we infer that, in an aprotic solvent, the torsional motion promotes the relaxation path in the first excited state.τ2is significantly decreased for a protic solvent, but, for
MeOD,τ2lies near the value expected for an aprotic solvent of
similar viscosity. The decay rate in 1-butanol clearly deviates from the linear trend observed for an aprotic solvent, even though the viscosity of 1-butanol (2.9 cP) is much greater. We observed a time constant of 16 ps in acetonitrile, which is greater than the results in 1-butanol. As acetonitrile has an even greater dielectric constant but a smaller viscosity (0.37 cP) than 1-butanol, we exclude the possibility of effects onτ2induced
by a polarity difference. For protic and aprotic solvents, the shapes and positions of features in steady-state spectra are all similar; the fluorescence quantum yields are also about the same. In protic solvents, this molecule thus has a planar geometry in the S1excited state.
Excess vibrational energy is transferable either to the bath modes of high density or directly to solvent vibrations with the same vibrational frequencies.27,28 For polyatomic
mol-ecules, an increased rate of vibrational relaxation in protic solvents has been reported by several groups. Vibrational relaxation of betaine 30 in the ground-state is increased in a protic solvent and a linear correlation between the rates and the molar number of OH group per cubic centimeter was found.29 For azulene, the rate of vibrational relaxation is
found also to be increased in protic solvents.30-32 Most
measurements of solvent dependence on the rate of vibra-tional cooling are in the ground state, but, for azulene, the enhanced rate of vibrational cooling is reported for both S2
and S0 states. In these systems, the increased rate of
vibrational relaxation in protic solvents is attributed to hydrogen bonding between solute and solvent. Because τ2
in MeOD is near the value expected for a nonprotic solvent of similar viscosity and our data show that τ2 in various
alcoholic solvents is independent of the number of OH groups per solute molecule, hydrogen bonding alone cannot account for the increased rate of relaxation for other protic solvents. Middleton et al. reported the rate of vibrational cooling of 9-methyladenine (9MA) to be enhanced in solvents with hydrogen bonds: the rate for H2O is∼1.8 times that in D2O.
Given the friction spectra of H2O and D2O, they concluded
that this increase is due to the friction spectra at wavenumber >700 cm-1in H
2O with higher intensity.33In our case,τ2in
MeOH and MeOD are 10 and 14 ps, respectively. This fact is explicable in that vibrational energy is transferred to the bath modes of MeOH more efficiently beyond certain frequency. Since the low-frequency vibrational modes in friction spectra mainly arise from hindered translations, which are not varied significantly because of slight isotope effects
Figure 6. Fluorescence decay curves at 420 nm in (a) n-butanol, (b)
acetonitrile, and (c) hexadecane. The fittedτ2 are 7, 16, and 65 ps,
respectively.
Figure 7. Relaxation time constantτ2(see text) in aprotic (circle) and
protic (square) solvents vs viscosity, showing a linear correlation betweenτ2and viscosity in an aprotic solvent.
Downloaded by NATIONAL TAIWAN UNIV on August 31, 2009 | http://pubs.acs.org
on molecular masses and intermolecular interactions. How-ever, the librational motion, which is responsible for the high-frequency region (500-1000 cm-1) of friction spectra and is absent in aprotic solvents, changes its frequency from 655 (MeOH) to 475 cm-1(MeOD).34-36Note that the librational
frequencies of MeOH/MeOD are close to those of H2O/D2O
and the differences in high-frequency friction spectra should be qualitatively similar.37As the solvent friction (bath modes)
spectra of MeOH and MeOD in other systems are unavailable for qualitative comparison, we assume that the vibrational friction spectra of MeOH/MeOD follow a trend similar to those of H2O/D2O. That τ2 is somewhat larger for MeOH
(10 ps) than for n-butanol (7 ps) indicates that some additional vibrational degrees of freedom available in n-butanol might serve as accepting modes for excess vibrational energy of the solute. The specific role of a solvent as a bath or as a direct acceptor of vibrational energy in other systems has been discussed by several groups, but the specific role varies from case to case.38,39According to current data, it is difficult
to discuss the detailed vibrational relaxation between solute and solvent; vibrational mode-specific experiments and simulations of molecular dynamics are required for further interpretation.
From the results of their calculation, Heimel et al. reported that, for p-terphenyl, the phenyl CdC stretching motion is involved in the conformational relaxation.15Picosecond
time-resolved Raman experiments on p-terphenyl indicate that an in-plane ring vibration at 750 cm-1exhibits a peak position and a narrowing within 40 ps, implying coupling to the conformational change of S1p-terphenyl.40Lack of spectral
resolution precludes our elucidation of the role of these vibrational motions in accelerating the relaxation of S1*, but
according to Figure 5 the amplitudes of τ2 components
increase with the detection wavelength. On this time scale, the spectral change depends strongly on the potential-energy surfaces of the ground and excited states. The fact that vibrationally excited states emit at greater wavelengths indicates that the potential-energy surface of the ground state is steeper than that of the excited state.41According to the
calculated potential energy along torsional angle φ1, the
equilibrium positions of S1and S0differ significantly. From
the calculated slopes of the surfaces, we expect the relaxed S1to emit in the red. Another vibrational motion with a deep
potential surface in S1must hence couple with the
confor-mational relaxation in addition to torsion. Combining with the isotope effects on the vibrational relaxation rate, the high-frequency phenyl CdC stretching mode (∼1300 cm-1) could be a possible candidate.
The other two time constants,τ1andτ3, are independent
of solvent viscosity. For the p-substituted biphenyl derivative in our experiments, three torsional motions exist: between two phenyl rings, between a phenyl ring and a silylene group, and the SiH(CH3)2moiety; a multistep structural relaxation
might hence be expected, but only one time constant for structural relaxation is obtained. Planarization is the major relaxation motion to attain the equilibrium geometry of S1
from the Franck-Condon region after excitation. We hence tentatively designateτ2as the time constant mainly
contrib-uted from twisting the two-phenyl groups; because of the substituents in this molecule, the obtained time constant is slightly larger than that for biphenyl.
Conclusion
We measured the fluorescence decay of [(1,1′ -biphenyl)-4,4′-diyldi-2,1-thenediyl]bis(dimethylsilane) in protic and
aprotic solvents. In each solvent we derived three time constants: an ultrarapid rise (τ1) representing the internal
conversion, another (τ2) about 7-65 ps strongly dependent
on solvent viscosity, and a third∼1 ns (τ3) assigned to the
lifetime of the first excited state. In an aprotic solvent, the geometric relaxation is confirmed according to a linear correlation between τ2 and solvent viscosity. The rate of
structural relaxation is accelerated in alcoholic solvents. τ2
for MeOD is 1.4 times larger than that for MeOH; this solvent isotope effect implies that enhanced vibrational relaxation occurs more efficiently through transfer of energy to the bath mode of a protic solvent.
Acknowledgment. We thank Academia Sinica, Taipei, the National Science Council, Ministry of Education (MOE program for promoting academic excellence of universities No. 89-FA04-AA) of the Republic of China, and the National Center of High-Performance Computing for support of computing facilities.
References and Notes
(1) Rettig, W.; Maus, M. Conformational Analysis of Molecules in
Excited States; Waluk, J., Ed.; Wiley-VCH: New York, 2000.
(2) Khimich, M. N.; Makarova, N. I.; Knyazhansky, M. I.; Uzhinov, B. M. Int. J. Photoenergy 2004, 6, 69.
(3) Abramavicius, D.; Gulbinas, V.; Valkunas, L.; Shiu, Y.-J.; Liang, K. K.; Hayashi, M.; Lin, S. H. J. Phys. Chem. A 2002, 106, 8864.
(4) Mondal, J. A.; Ghosh, H. N.; Ghanty, T. K.; Mukherjee, T.; Palit, D. K. J. Phys. Chem. A 2006, 110, 3432.
(5) Sluch, M. I.; Godt, A.; Bunz, U. H. F.; Berg, M. A. J. Am. Chem.
Soc. 2001, 123, 6447.
(6) Cailleau, H.; Baudour, J. L.; Meinnel, J.; Dworkin, A.; Moussa, F.; Zeyen, C. M. Faraday Discuss. Chem. Soc. 1980, 69, 7.
(7) Troisi, A.; Ratner, M. A.; Nitzan, A. J. Chem. Phys. 2003, 118, 6072.
(8) Weiss, E. A.; Tauber, M. J.; Kelley, R. F.; Ahrens, M. J.; Ratner, M. A.; Wasielewski, M. R. J. Am. Chem. Soc. 2005, 127, 11842.
(9) Mallick, P. K.; Chattopadhyay, S.; Sett, P. Chem. Phys. Lett. 2000,
331, 215.
(10) Tretiak, S.; Saxena, A.; Martin, R. L.; Bishop, A. R. Phys. ReV.
Lett. 2002, 89, 097402.
(11) Mullen, K.; Bittner, E. R.; Baumgarten, M.; Karabunarliev, S.
J. Chem. Phys. 2000, 113, 11372.
(12) Takei, Y.; Yamaguchi, T.; Osamura, Y.; Fuke, K.; Kaya, K. J. Phys.
Chem. 1988, 92, 577.
(13) Iwata, K.; Takeuchi, S.; Tahara, T. Chem. Phys. Lett. 2001, 347, 331.
(14) Mank, D.; Raytchev, M.; Amthor, S.; Lambert, C.; Fiebig, T. Chem.
Phys. Lett. 2003, 376, 201.
(15) Heimel, G.; Daghofer, M.; Gierschner, J.; List, E. J. W.; Grimsdale, A. C.; Mullen, K.; Beljonne, D.; Bredas, J.-L.; Zojer, E. J. Chem. Phys.
2005, 122, 054501.
(16) Leonard, J. D.; Gustafson, T. L. J. Phys. Chem. A 2001, 105, 1724. (17) Tan, X.; Gustafson, T. L. J. Phys. Chem. A 2002, 106, 3593. (18) Cheng, Y.-J.; Luh, T.-Y. Chem.;Eur. J. 2004, 10, 1.
(19) Shao, Y.; Molnar, L. F.; Jung, Y.; Kussmann, J.; Ochsenfeld, C.; Brown, S. T.; Gilbert, A. T. B.; Slipchenko, L. V.; Levchenko, S. V.; O’Neill, D. P.; DiStasio, R. A., Jr.; Lochan, R. C.; Wang, T.; Beran, G. J. O.; Besley, N. A.; Herbert, J. M.; Lin, C. Y.; Van Voorhis, T.; Chien, S. H.; Sodt, A.; Steele, R. P.; Rassolov, V. A.; Maslen, P. E.; Korambath, P. P.; Adamson, R. D.; Austin, B.; Baker, J.; Byrd, E. F. C.; Dachsel, H.; Doerksen, R. J.; Dreuw, A.; Dunietz, B. D.; Dutoi, A. D.; Furlani, T. R.; Gwaltney, S. R.; Heyden, A.; Hirata, S.; Hsu, C.-P.; Kedziora, G.; Khalliulin, R. Z.; Klunzinger, P.; Lee, A. M.; Lee, M. S.; Liang, W.; Lotan, I.; Nair, N.; Peters, B.; Proynov, E. I.; Pieniazek, P. A.; Rhee, Y. M.; Ritchie, J.; Rosta, E.; Sherrill, C. D.; Simmonett, A. C.; Subotnik, J. E.; Woodcock, H. L., III; Zhang, W.; Bell, A. T.; Chakraborty, A. K. Phys. Chem. Chem.
Phys. 2006, 8, 3172.
(20) Lakowicz, J. R. Principles of Fluorescence Spectroscopy; Kluwer Academic/Plenum: New York, 1999.
(21) Smallwood, I. M. Handbook of Organic SolVent Properties; Halsted Press: New York, 1996.
(22) Siebrand, W. J. J. Chem. Phys. 1966, 44, 4055.
(23) Turro, N. J. Modern Molecular Photochemistry; University Science Books, Sausalito,CA, 1991.
(24) Macpherson, A. N.; Gillbro, T. J. Phys. Chem. A 1998, 102, 5049.
Downloaded by NATIONAL TAIWAN UNIV on August 31, 2009 | http://pubs.acs.org
(25) Ehlers, F.; Wild, D. A.; Lenzer, T.; Oum, K. J. Phys. Chem. A
2007, 111, 2257.
(26) Beenken, W. J.; Lischka, H. J. Chem. Phys. 2005, 123, 144311. (27) Dlott, D. D. Chem. Phys. 2001, 266, 149.
(28) Deng, T.; Stratt, R. M. J. Chem. Phys. 2002, 117, 1735. (29) Terazima, M. Chem. Phys. Lett. 1999, 305, 189.
(30) Schwarzer, D.; Troe, J.; Votsmeier, M.; Zerezke, M. J. Chem. Phys.
1996, 105, 3121.
(31) Yamaguchi, T.; Kimura, Y.; Hirota, N. J. Chem. Phys. 2000, 113, 2772.
(32) Kimura, Y.; Yamamoto, Y.; Terazima, M. J. Chem. Phys. 2005,
123, 054513.
(33) Middleton, C. T.; Cohen, B.; Kohler, B. J. Phys. Chem. A 2007,
111, 10460.
(34) Falk, M; Whalley, E. J. Chem. Phys. 1961, 34, 1554.
(35) Skaf, M. S.; Fonseca, T.; Ladanyi, B. M. J. Chem. Phys. 1993, 98, 8929.
(36) Venables, D. S.; Chiu, A; Schmuttenmaer, C. A. J. Chem. Phys.
2000, 113, 3243.
(37) Rey, R.; Moller, K. B.; Hynes, J. T. Chem. ReV. 2004, 104, 1915. (38) Deng, Y.; Stratt, R. M. J. Chem. Phys. 2002, 117, 1735. (39) Seifert, G.; Graener, H. J. Chem. Phys. 2007, 127, 224505. (40) Iwata, K.; Hamaguchi, H. J. Raman Spectrosc. 1994, 25, 615. (41) Sarkar, N.; Takeuchi, S.; Tahara, T. J. Phys. Chem. A 1999, 103, 4808.
JP807662G
Downloaded by NATIONAL TAIWAN UNIV on August 31, 2009 | http://pubs.acs.org