Disaster Investigation and Failure Analysis of Debris Flow from Morakot Typhoon at Liugui
Town, Kaohsiung, Taiwan on August 8, 2009
D. H. Hsiao*, C. S. Hsieh, J. J. Chang
Department of Civil Engineering, National Kaohsiung University of Applied Sciences, TAIWAN
ABSTRACT
The techniques of in-situ investigation, close-range photogrammetry, laboratory tests, stereographic projection and slope stability analysis were used to investigate debris flow at Hsia-Hsinkai Tribe in Liugui town, Kaohsiung on August 8, 2009. Because test results show that 50-80% of the soil aggrades are larger than 2 mm (#10 size), the study area can be considered as gravel debris according to the Taiwan specification. The internal friction angle of the aggrading soil materials ranges from 33.1° to 40.9° using direct shear tests. The outcrops found on site are analyzed with a stereographic projection method. Finally, an analysis of slope stability on the upslope reveals that the deposited geomaterials and rock slope on both sides of the valley are unstable when they are gradually saturated. The heavy precipitation is the primary factor that triggered the occurrence of the debris flow. Topographical variations before and after the 2009 Morakot Typhoon disaster were provided by a three-dimensional digital topography model created by a close-range photogrammetry technique. The elevation variation after the disaster is calculated using a digital elevation model (DEM) and can validate the relation between the source area and the depositional area. In Taiwan, the principal areas of debris flow can usually be divided into three sub-areas: a source area, a flow area and a depositional area. To investigate deposit length and mass flow volume, some independent zones in the study area are divided to verify zones locations after a disaster. It was found that the length of the depositional area is shorter than expected. Hence, the excess pore water pressure between the debris flow and the bedrock could be a significant factor to cause the debris flow. In this paper, we present an explanation of the debris flow based on Newtonian slide theory.
KEY WORDS: In-situ investigation, Close-range photogrammetry, DEM, Laboratory tests, Slope stability analysis, Debris flow, Excess pore water pressure.
PREFACE
In 2009, the Morakot Typhoon caused significant destruction in southern Taiwan and triggered a large number of mountains to collapse around Sinfa village and Liugui town near Kaohsiung City. In Hsia-Hsinkai Tribe, a large amount of landslides caused soil and gravel runoff, part of which flowed into the Laonong River. A total of 38
buildings were buried, 4 people died, and 24 people were missing. The typhoon launched the land near Hualien City, located in the eastern part of Taiwan on August 7, 2009. It had already affected Taiwan Island for 61 hours, and the cumulative rainfall exceeded 2,000 mm. The Morakot Typhoon could be one of most serious disasters Taiwan has experienced in fifty years; more than six hundred people died in Taiwan during the disaster.
The research techniques used for this work included field investigation, laboratory tests, stereographic projection, slope stability analysis and a terrestrial-photogrammetry technique, from which a three-dimensional (3D) digital elevation model (DEM) was created. Comparison of the data from the DEM with the data from before the damage yielded some useful information about the post-debris flow. In addition, material properties and topographic variations were used to investigate the effect of the pore water pressure at the slip surface along the deposited debris length.
Chen et al. (2006) investigated the Tungmen, Chonho and Hoser debris after three typhoons struck Taiwan between 1990 and 2000. They used aerial photos, topographic variation, discontinuity and geotechnical analysis to study the failure mechanisms of the debris. The reason that the debris flows happened may be due to an increase in the pore water pressure causing a reduction of the shear resistance. Gabet and Mudd (2006) studied a shallow landslide and debris flow in South California; they used a triaxial constant shear drain apparatus to explain the occurrence of liquefaction based on a decrease in the effective pressure, even for dense soil. Wang et al. (2003) found that an abrupt rise in the groundwater level resulted in debris flow of saturated soils after heavy rains at Hiroshima, Japan, in 1999. They designed a ring-shear apparatus and sketched a stress path to describe the increase of the pore water pressure and the cause of a decrease in the effective stress, which is similar to the findings of Anderson and Sitar (1995). Phillips (2006) used the micro-morphology method to investigate debris flow in the base to induce basal shearing, further induce liquefaction and rotational deformation during flow. They collected five samples in the field to study the microstructural behavior of gravel debris in Scotland. Capra et al. (2003) studied a volcano ash collapse in Mexico that generated a landslide, most likely due to ground water perched above soils similar as clay that caused an increase in the pore water pressure and finally caused the debris flow. In recent years, Chen et al. (2010) used a balata flume to measure the pore water pressure of
782
Proceedings of the Twenty-first (2011) International Offshore and Polar Engineering Conference
Maui, Hawaii, USA, June 19-24, 2011
Copyright © 2011 by the International Society of Offshore and Polar Engineers (ISOPE)
gravel debris with varying clay content. However, it is difficult to use in situ because the device is easily out of order during debris flow or the pore water pressure is too low to measure the pore water pressure. From this literature review, it is clear that the pore water pressure during debris flows is a very important factor. In this paper, we use the data collected from the debris flows in Taiwan to study how the pore water pressure affects the flow conditions.
SITE DESCRIOTIONS AFTER TYPHOON DAMAGE
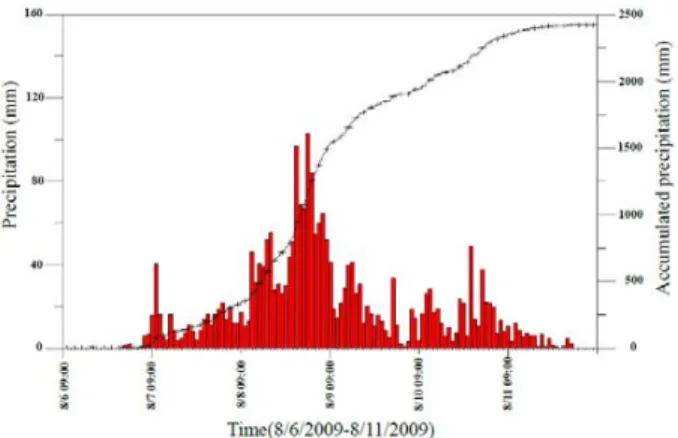
According to the statistical rainfall amounts of the Central Weather Bureau in Taiwan, the cumulative rainfall reached 2,461 mm during the period of the Morakot Typhoon (Aug. 6, 2009-Aug. 10, 2009), which accounts for about 78% of the average annual rainfall of 3,138 mm in the town of Liugui. As shown in the rainfall measurements of Figure 1, obtained from the Sinfa precipitation station, the peak rainfall of 1,190 mm/day occurred on August 8, 2009, with the maximum instantaneous rainfall of 103 mm/hr occurring at 18:00 that day. The rainfall continued for 10 hours, when it was more than 50 mm/hr. Hung (1996) pointed out that the critical rainfall per day is about 300 mm in Taiwan. Due to the high rainfall intensity and very weak geology, serious landslides often occur there; landslides even occur in parts of Taiwan where rainfalls are lower than 300 mm. The high rainfall intensity and duration appear to result in serious disaster.
The study area near Liugui and the Tulungwan Fault lies in Taiwan’s Central mountain range. The stratification is composed of a Chau-chou layer, a Changchikeng layer, terrace deposits and an alluvial layer from bottom to top. The Chau-chou layer belongs to the Miocene stratigraphic, and is primarily composed of slate and argillite, while the Changchikeng layer is filled with deep grey shale and light grey sandstone. Sandstone is very dense and hard and partially contains limestone, saracen stone and carbonaceous debris. The terrace deposits are seen often and were formed during the Late Pleistocene era or the Holocene era. Certainly, young alluviums are composed of gravel, sands, and silts, which are found near the ground surface.
Figure 2 describes the damage situation in the Laonong River Watershed after the Morakot Typhoon. It is seen about landslide, settlement, flood, debris area and serious buried spot. Among them, the zone from Maolin to Baoli is the most serious and much debris and many landslides are seen everywhere. These events were unprecedented in this area.
Figure 1 Distribution of hour and accumulated precipitation from Aug. 6th to Aug. 11th in 2009.
Figure 2 Damage distribution location in Laonong River Watershed in 2009 Morakot Typhoon.
STUDY METHOD Field investigation
Before undertaking the field investigation, both a topographic map and an environmental geological map are collected and deemed to be the baseline. When the field investigation is performed, we carefully record related issues, such as altitude, strike, angle of inclination, lithology, and rock outcrop and soil temperament. Important specimens are carefully extracted and bagged to conduct tests in the laboratory.
Laboratory testing methods
All of the tests in the laboratory are performed according to ASTM specifications. The in situ density test is conducted by the fill sand cone method according to ASTM D1556. Eight locations distributed from the top of the slope to the deposit area were chosen to sample and test. To judge which debris is designated as mud or gravel debris, a sieve analysis has to be conducted according to ASTM D136. As for soil consistency, the Atterberg test is conducted using the methods of ASTM D4318 and D427. Soils are classified according to the Unified Soil Classification System (USCS) of ASTM D2487. The water content and specific weight of the soils were tested by means of ASTM D2216 and ASTM D854. To determine the soil density in the field, either the standard method of ASTM D698 or the modified
method of ASTM D1557 is used. In addition, the maximum γdmax and
minimum γdmin dry densities were determined by ASTM D4253 and
D4254, respectively. The direct shear test is undertaken by ASTM D3080.
Terrestrial-photogrammetry program
After completing the outdoor work, the data are viewed through a stereo projector to establish the 3D point cloud data by terrestrial-photogrammetry software. Photomodeler software is used to establish point cloud data for terrestrial-photogrammetry. The main factor in achieving point cloud data precision is camera calibration and image matching. Hence, conjugate points selected by hand increase the success of the match probability. After the precision for the conjugate points meets the requirement, an image match is conducted and the 3D point cloud data is completed. All of the data were transformed into the TWD97 coordinate system; thus, the correction of scale and space was confirmed again. Finally, the point cloud data may be transformed into a digital elevation model by ArcGIS. With this method, the topographic
slope/aspect and volume calculations can be obtained for before and after the disaster.
RESULTS AND STABILITY ANALYSIS Field investigation results
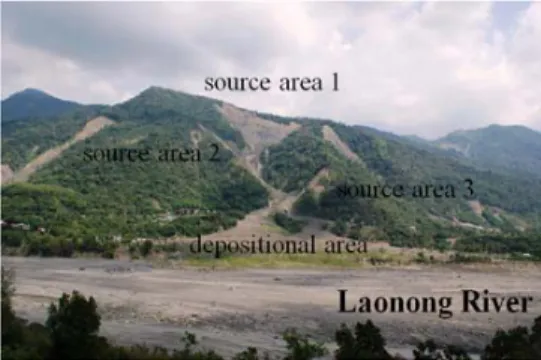
The topography of the area is first surveyed via an aerial photograph before the ground surface geological investigation. After reconnaissance for outcrops, we found three larger landfill areas in the source areas. A photo of the overall site after the disaster at Hsia-Hsinkai Tribe is shown in Figure 3. Based on the influence of the geological structure, a discontinuity on two sides of the valley can easily be seen and investigated. The joint planes are orthotropic with the bedding planes. Figures 4-6 show three locations from the source area. The elevation of the source area lies between 680 m and 830 m, stretching about 312 m. The collapsed volume is approximately 1.30
million m3, and the average slope equals to 33o. The highest location of
the field investigation only reaches an elevation of 675 m; however, the slope is very steep such that it is difficult for the investigator to climb. Both sides of the valley were filled with weathered soil and rock outcrops after the debris flow. The weathered soil could stretch to about 300 m. From both sides of the bedding it is seen that the majority of the outcrop bedding was struck in the range N12°W-N83°W, and the bedding dip ranged from 80° to 81°, declining to the northeastern direction. From Figure 4 especially, we can see simultaneously a rock outcrop, weathered soils and many discontinuities. At source area 2, the elevation is distributed from 610 m to 710 m, extending along a length
of about 130 m. The collapsed volume is about 0.11 million m3, and the
bedding appears to be very clear. The majority of the strikes are in the range S20°W-S74°W, which is inclined toward the southeastern direction, and the dip is about 82o-89o. At source area 3, the elevation is
in the range of 520 m and 440 m, and the stretch length is about 140 m.
The collapsed volume is about 194 m3. A V-shape gully is visible, but
there is no apparent plant coverage there. Three erosion gully trenches were found, and most bedding strikes are in the range N54°W-N84°W. The trenches inclined toward the northeastern direction, and the dip angle is 38o -83o.
The flow area elevation is in the range of 424 m to 680 m, the
stretch length is 407 m, and the average slope is 32o. The channel width
is the same; however, the maximum width is about 108 m, and the minimum width is about 28 m. Both sides of the zone have more than 10 m thick weathered surface stratification. The deposit area elevation is in the range of 424 m to 320 m, the stretch length is 630 m, and the
average slope is 10.3o. The width changes depending on the topography:
the maximum width is about 770 m, the minimum width is about 80 m,
and the collapsed volume is about 1.40 million m3。
Figure 3 Overall photo of the site at Hsia-Hsinkai Tribe. (Direction looking eastward)
Figure 4 At source area 1, the collapsed earthwork volume is about 1.3 million m3.
Figure 5 At source area 2, the collapsed earthwork volume is about 0.11 million m3.
Figure 6 At source area 3, the collapsed earthwork volume is about 194 m3.
Figure 7 The shape of depositional area is fan-shaped and its thickness ranged 2-7m.
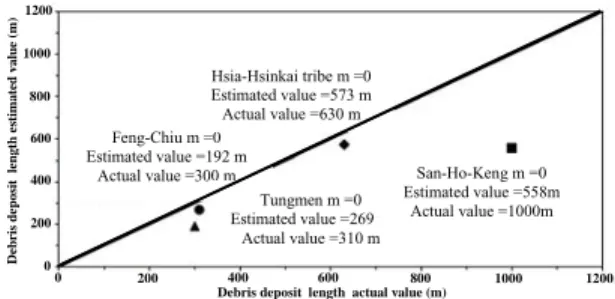
Figure 17 Comparison between the predicted and calculated without considering corrector m value.
Figure 18 Comparison between the predicted and calculated with considering corrector m value.
CONCLUSIONS
The main reason for the Morakot Typhoon disaster is high intensity and long duration rainfalls. A weak geological structure may also be a factor. The stratification is mainly composed of a Chau-chou layer, which often includes shale and slate. The topographic measurements describe three sub-zones in the source area where the
total collapsed volume is approximately 1.4 million m3. Whether for
rock or soil materials, the slopes in Hsia-Hsinkai Tribe are very unstable based upon the calculated safety factor or the field investigation. The sliding debris model developed by Chen and Ou (2006) is used to evaluate the failure mechanism, but it reveals that the predicted deposit length is not in agreement with the actual value. We obtain better results by including a corrector to modify the theory. The excess pore water pressure is modified by m=Ue/U=excess pore water pressure/pore water pressure. When m is considered, the predictions
will better approximate the measurements.
REFERENCES
Anderson, SA, Sitar, N (1995). "Analysis of Rainfall-induced Debris Flow, " Journal of Geotechnical Engineering, ASCE, Vol. 121, No. 7, pp. 544-552.
Booth, B (2000). Using ArcGIS™ 3D Analyst™, GIS by ESRI ™ . Chen, H (2006). "Controlling Factors of Hazardous Debris Flow in
Taiwan," Quaternary International, 147, pp. 3-15.
Capra, L, Lugo-Hubp, J, Borselli, L (2003). "Mass Movements in Tropical Volcanic Terrains: the Case of Teziutla´n (Me´xico),"
Engineering Geology, 69, pp. 359-379.
Chen, NSh, Zhou, W, Yang, ChL, Hu, GSh, Gao, YCh, Han, D (2010). "The Processes and Mechanism of Failure and Debris Flow Initiation for Gravel Soil with Different Clay Content," Geomorphology, 121, pp. 222-230.
Chen, RH, Ou, TL (2006). "Initiation Mechanism of Zonal Debris Flows, " Sino-Geotechnics, No. 110, pp. 25-34 (in Chinese).
Das, BM (2010). Principles of Geotechnical Engineering, Sixth Ed.,
Cengage Learning Co.
Gabet, EJ, Mudd, SM (2006). "The Mobilization of Debris Flows from Shallow Landslides," Geomorphology, 74, pp. 207-218.
Hoek, E, and Bray, J (1981). Rock Slope Engineering, Institution of Mining and Metallurgy, London.
Hortta, N, and Ohta, T (2000). "Pore-Water Pressure of Debris Flows,"
Phys. Chem. Earth (B), Vol. 25, No. 4, pp. 381-385.
Hsiao, DH, Hsieh, CS, Chang, JJ, Tseng PY (2010). "Investigate Debris Flow Induced by Morakot Typhoon in the Field at Hsia-Hsinkai Tribe, " Taiwan Rock Engineering Symposium 2010, pp.1009-1018 (in Chinese).
Hung, JJ (1996). "Typhoon Herb, the New-Central-Cross-Island-Highway and Slope-land Failures in Central Taiwan,"
Sino-Geotechnics, No. 57, pp.25-30 (in Chinese).
Phillips, E (2006). "Micromorphology of a Debris Flow Deposit: Evidence of Basal Shearing, Hydrofracturing, Liquefaction and Rotational Deformation during Emplacement," Quaternary Science
Reviews, 25, pp. 720-738.
Wang, G, Sassa, K, Fukuoka, H (2003). "Downslope Volume Enlargement of a Debris Slide–debris Flow in the 1999 Hiroshima, Japan, Rainstorm," Engineering Geology, 69, pp. 309-330.
Tungmen m =0.0212 Estimated value =310.01 m Actual value =310 m Feng-Chiu m =0.0298 Estimated value =300.1 m Actual value =300 m San-Ho-Keng m =0.0931 Estimated value =1000.3 m Actual value =1000m Hsia-Hsinkai tribe m =0.0287 Estimated value =630 m Actual value =630 m D ebri s de p o si t le ng th e sti m a ted v a lue ( m ) 1200 1000 600 800 400 200 0
Debris deposit length actual value (m)
1200 1000 800 600 400 200 0 Feng-Chiu m =0 Estimated value =192 m Actual value =300 m Tungmen m =0 Estimated value =269 m Actual value =310 m San-Ho-Keng m =0 Estimated value =558m Actual value =1000m Hsia-Hsinkai tribe m =0 Estimated value =573 m Actual value =630 m D ebri s de po si t le n g th e sti m a ted v a lu e (m) 1200 1000 600 800 400 200 0
Debris deposit length actual value (m)
1200 1000 800 600 400 200 0 788