行政院國家科學委員會專題研究計畫 成果報告
巢鼠的族群生物學研究(3/3)
研究成果報告(完整版)
計 畫 類 別 : 個別型 計 畫 編 號 : NSC 96-2621-B-002-004- 執 行 期 間 : 96 年 08 月 01 日至 97 年 07 月 31 日 執 行 單 位 : 國立臺灣大學生命科學系 計 畫 主 持 人 : 林雨德 計畫參與人員: 助理教授-主持人(含共同主持人):林雨德 碩士-兼任助理人員:姜壽嶽 碩士-兼任助理人員:林婷婷 碩士-兼任助理人員:李育欣 碩士-兼任助理人員:鄭宇廷 處 理 方 式 : 本計畫可公開查詢中 華 民 國 97 年 05 月 30 日
行政院國家科學委員會補助專題研究計畫 □ 成 果 報 告 □期中進度報告
巢鼠的族群生物學研究 (3/3)
Population biology of the Harvest Mouse, Micromys minutus (3/3)
計畫類別:□ 個別型計畫 □ 整合型計畫 計畫編號:NSC-96-2621-B-002-004 執行期間:96 年 8 月 1 日至 97 年 7 月 31 日 計畫主持人:林雨德 共同主持人: 計畫參與人員:姜壽嶽(碩士生),林婷婷(碩士生),李育欣(碩士生),鄭宇廷(碩士生) 成果報告類型(依經費核定清單規定繳交):□精簡報告 □完整報告 本成果報告包括以下應繳交之附件: □赴國外出差或研習心得報告一份 □赴大陸地區出差或研習心得報告一份 □出席國際學術會議心得報告及發表之論文各一份 □國際合作研究計畫國外研究報告書一份 處理方式:除產學合作研究計畫、提升產業技術及人才培育研究計畫、列管計畫及下列情 形者外,得立即公開查詢 □涉及專利或其他智慧財產權,□一年□二年後可公開查詢 執行單位:國立台灣大學 生命科學系 中 華 民 國 97 年 5 月 30 日 附件一
Abstract
The Guandu salt marsh in the Guandu Nature Park (Taipei, Taiwan) offered habitat patches of different qualities for the harvest mouse (Micromys minutus). The current research aimed to find out (1) if succession could influence the genetic structure of the harvest mouse and (2) how population dynamics affected the genetic structure of the harvest mouse. Study site were categorized into dense, sparse, and mix patches. Dense patches were preferred by Micromys
minutus. However, the overall area of dense patches decreased greatly during the succession
occurred between 2000 and 2005. The decrease of dense patches not only reduced but also fragmented the habitats suitable for the harvest mouse. The harvest mouse population was fragmented along with dense patches, yet the population did not become structured genetically with significance. I detected bottleneck effect with M-ratio(M<0.68) but not mode-shift and heterozygosity excess in both year, which indicated that bottleneck probably occurred in the past distant enough that the signature of bottleneck detectable by mode-shift and heterozygosity excess has been erased. Within each year, population size became very low in summer, and the genetic differentiation was significant between spring and autumn population in 2005. Overall, the results suggest that salt marsh succession can influence the genetic structure of the harvest mouse in Guandu salt marsh spatially and temporal in a short period of time.
Key words : bottleneck, habitat heterogeneity, harvest mice, Micromys minutus,
microsatellite, population dynamics, population genetics, succession, temporal differentiation
Introduction
Population dynamics -- Animal populations fluctuate over time. Although various factors
influence the dynamics of populations, they could be categorized into endogenous and exogenous factors (Pickens, 2007; Lima et al., 1999; Stenseth et al., 2003). Endogenous factors include the unique life-history traits of different species (e.g., age of 1st reproduction, litter size, and
longevity), and the degree of tolerance among population members. They set up a baseline upon which population size fluctuates (Boonstra, 1994; Tkadlec et al., 1998).
On the other hand, exogenous factors such as weather, food availability, predators, and habitat succession would add to and/or interact with the endogenous factors to modify the
dynamic patterns of populations further (Stenseth et al., 2003; Boonstra et al., 2006; Yarnell et al., 2007). Some exogenous factors of anthropogenic origins such as overexploitation, habitat loss and degradation, spread of competitive or predatory alien species are well known causes of population decline, or even local extinction (Jackson et al., 2008; Trites et al., 2007; Johnson et al., 1999; Hall-Martin, 1992). The change in population sizes by those forces is usually dramatic. Unlike anthropogenic effects, natural succession of habitats would affect population fluctuations over a longer period of time. Both the strengths of endogenous and exogenous factors and their interactions could change with time. Thus, few animal populations fluctuate with easily identifiable patterns. The most famous case is probably the multi-annual (10-year) cycles of the snowshoe hare and their predator, lynx (Stenseth et al., 1998; Royama, 1992).
The strengths of endogenous and exogenous factors and their interactions change with space as well. For a given species, suitable habitats often intersperse in a sea of unsuitable habitats. Thus, members of a population usually do not distribute uniformly over space, and frequently form subpopulations. The suitability of habitats (determined by the endogenous and exogenous factors mentioned earlier) affects the birth, death, dispersal rates, and consequently population
sizes.
Population genetics -- As anthropogenic effects and/or natural succession alter the suitability of
habitats, the genetic structures for animal populations change too. Generally, population genetic studies have focused on the effects of anthropogenic activities. Although many studies have investigated how climate change over an evolutionary time scale influence the evolution of species, few population genetic studies pay attention to how natural succession, an ecological time scale phenomena, changes genetic structure for animal populations. Natural succession changes the amount of suitable habitat, thus indirectly the sizes and genetic structure of
populations. Furthermore, natural succession often changes the dispersion of suitable habitat patches. Thus, the heterogeneity of the habitat changes, and the formation of subpopulation changes.
Harvest mice – The harvest mouse (Micromys minutus) is widely distributed in Eurasia. With a
reddish/brownish coat color, the species is one of the smallest (6-8 grams) rodents in the world. The species inhabits grasslands or bushes (Churchfield, 1997), and makes ball-shaped nests among vegetation with shredded leave blades. Their prehensile tails and toe pads allow them to move through vegetation easily.
Trout (1976) suggested that populations of the harvest mouse fluctuate dramatically both within and between years. Population sizes could increase or decline in magnitude of orders within a very short period of time. Such a dynamic pattern seemed to exhibit periodicity in some areas. The species inhabits grasslands or bushes (Churchfield, 1997), habitats that are in early successional stage. The vegetative community changes in a fast pace in such ecosystems, and offer a unique system to study the effects of habitat succession on population dynamics and population genetics.
A harvest mouse population inhabits the salt marsh in the Guandu Nature Park at suburb Taipei, an important stopover for migratory waterfowls. Consistent with the description by
Trout (1976), Lee (2001) found that the harvest mouse population in Guandu exhibited a dramatic fluctuation within year. Population size dropped to near zero during summer. Lee (2001) also demonstrated that the species preferred dense and avoided sparse vegetation, consistent with an early study (Bence, 2003). From the observation of aerial photos from 2000-2004, I found that the Guandu salt marsh underwent rapid succession. The composition and spatial structure of vegetative community has noticeable changes over 4 years. Particularly, suitable habitats (dense vegetation) seemed to have declined, and become fragmented. Such changes would affect not only the population sizes, but also genetic structure of the local harvest mouse population.
Research question – The current study attempted to investigate the effects of habitat succession
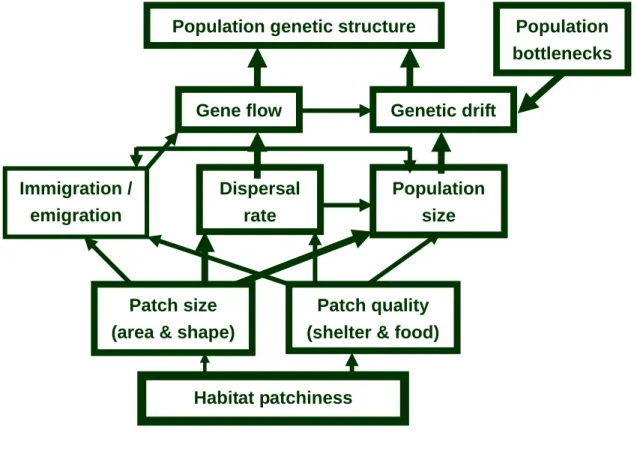
on the population fluctuation and population genetics of the harvest mouse. I tested several hypotheses: (1) habitat succession reduced suitable habitats, and consequently reduced population sizes; (2) habitat succession fragmented suitable habitats, and consequently altered population genetic structure (see conceptual map, Fig. 1).
Materials & methods
Study site
The study site was a salt marsh in the Guandu Nature Reserve (25。
07’N, 121。
28’E) located in northern Taiwan at the confluence of Danshui and Jilong Rivers (Fig. 2). The landscape consists of a mosaic of freshwater and brackish ponds, mudflats, marshes, rice paddies, and woodlands, in which a rich variety of organisms inhabits. The reserve has been designated as an Important Bird Area by the Birdlife International, and the Guandu Nature Park within the reserve has undergone intensive waterfowl habitat management since early 1990s. Seven small mammal species has been recorded in the Guandu Nature Park, including harvest mouse (Miromys
minutus), Rattus losea, Apodemus agrarius, Mus caroli, Crocidura shantungnensis and common
shrew, weasel. Major vegetation included Alternanthera philoxeroides (Moq.) Griseb., Ipomoea
cairica (L.) Sweet, Commelina diffusa Burm. f., Brachiaria mutica (Forsk.) Stapf, Panicum repens L., Paspalum distichum L., Phragmites communis (L.) Trin., Typha angustifolia L..
Trapping:
A 210 X 65m (13650m2) rectangular grid with 14 trap lines, containing 301 stations in 5 m spacing was established in the Guandu Nature Park in March 2005 (Fig. 3). I conducted the study from March 2005 to March 2006. Trapping was conducted monthly, with the odd- (152 stations) and even-number (149 stations) lines serviced every other month. I placed one Ugglan live trap (Uggland special #2, LxWxH = 25 x 8 x 6.5 cm, Grahnab, Hillerstorp, Sweden) at each station during each trapping session. Traps were placed at station on the ground and locked open for 4 consecutive days for pre-baiting purpose. Traps were set on the 5th evening, baited with roll oats mixed in peanut butter, and checked the following morning for 3 consecutive days. I placed traps on vegetation during wet seasons to avoid flooding. Small mammals were marked by a unique toe-clipping upon first capture. Upon each capture of animals, I recorded trap station, individual identification, gender, reproductive condition, body weight, and body
condition such as amount of parasite and wounding. All animals were subsequently released at the point of capture. Clipped toes were preserved in 80% alcohol in the field and later stored in -20℃ in the laboratory for subsequent molecular analyses.
Habitat patch types
According to the spatial distribution of dominant plant species, I categorized the habitat into three patch types: dense patch, sparse patch, and mix patch (Hallet et al.,1983; Lee, 2001). The trapping grid was divided into 5-m x 5-m cells. Each cell was assigned to a patch type. In dense patches, the dominant species (> 70% cover) were para grass (Brachiaria mutica),
Torpedograss (Panicum repens) and Climbing dayflower (Commelina diffusa). In spare patches, the dominant species was reed (Phragmites communis). In mix patches, none of the
above-mentioned species had cover > 70 %. The measurement of vegetative cover was
performed in March and August (to represent dry and wet season, respectively) during 2000 and 2005. Data from the two months were averaged, and mean values were used to assign each cell to a patch type.
The harvest mouse DNA was extracted from an adult harvest mouse captured in central Taiwan according to the standard phenol-chlorophorm extraction procedures described in Sambrook et al. (1989). Genomic DNA was digested with Sau3AI and fractioned on a 1% agarose gel. DNA of size range 300-1200bp was eluted, purified with GFXTM Band Purification Kit (Amersham) and ligated into plasmids PUC118/BamHI/BAP (TaKaRa) according to
manufacturer’s protocols. Ligated plasmids were transformed into the competent ECOS 101 cells (Yeastern Biotech). Recombinant clones containing inserts were transferred to Hybond-N+ nylon membranes (Amersham), which were hybridized to a set of oligonucleotide probes, including (AC)15, (AT)15, (AG)15, (AAT)10, (AAG)10, and (GATA)6. Probes were labeled with
Digoxigenin (DIG) Oligonucleotide 3’-End Labeling Kit (Roche). Hybridization was
performed at 50-53℃ for 16 hours in a standard hybridization buffer, consisting of 5X SSC, 0.1% Sodium N-lauroylsarcosine, 0.02% SDS, and 1% Blocking Reagent (Roche). The membranes were washed twice, each for 5 min at 45℃ with a solution of 2X SSC, 0.1% SDS, and then twice, each for 15 min at 65℃ with a solution of 0.1X SSC, 0.1% SDS. Chemiluminescent detection was performed with DIG Luminescent Detection Kit (Roche). A total of 64 positive clones were sequenced using a MegaBACE 500 automated sequencer. Twenty-five clones containing repeat motifs with more than 6 repeats and sufficient flanking region were selected to design primers. About 4% of screened clones yielded positives clones, which was higher than the average of 2-3% in many other taxa (Zane et al. 2002).
Primers were designed with the on-line program Primer 3.0 (Rozen and Skaletsky, 2000) and FastPCR 1.2 (Kalendar, 2007), a free software. Polymerase chain reaction (PCR)
conditions were optimized for each primer pair. Each PCR reaction mixture (10µL) contained 50-100 ng template DNA, 0.5 units of Taq DNA polymerase (Bioman, Taipei, Taiwan), 2.0 mM of Mg2+ , 0.2 mM dNTP, 10X buffer (20mM of Tris-HCl (pH8.8), 10mM KCl, 10mM (NH4)2SO4 ,
and 0.1% Triton X-100, Bioman), and 0.25µM primer, with the forward or reverse primer being end-labeled with fluorescent dyes. Amplification was carried out by the thermal profile: 94℃ 5 min, followed by 40 cycles of 94℃ 30 s, optimal annealing temperature for 30 s, 72℃ for 30 s, and a final extension step at 72℃ for 7 min. PCR products were run on linear polyacrylamide
(LPA) gels with a MegaBACE 500 automated sequencer. ET-400 Size Standard (Amersham) was used as a size marker to determine allele sizes. Individual genotypes were determined and individuals with ambiguous genotypes or homozygote were amplified and scored at least twice to determine the allele sizes.
Statistical analyses
Analyses of population genetics
Test software Microsatellite characteristics
Hardy-Weinberg equilibrium CERVUS 3.0
Null allele CERVUS 3.0
Linkage disequilibrium FSTAT 2.9.3 Large allele drop out MICROCHECKER Error due to stutter MICROCHECKER
Calculating genetic diversity Number of alleles FSTAT 2.9.3 Genetic diversity FSTAT 2.9.3 Allelic richness FSTAT 2.9.3
Detecting bottleneck
Mode-shift BOTTLENECK Heterozygote excess BOTTLENECK
M-ratio AGARst 3.3
Results
Population size and sex ratio
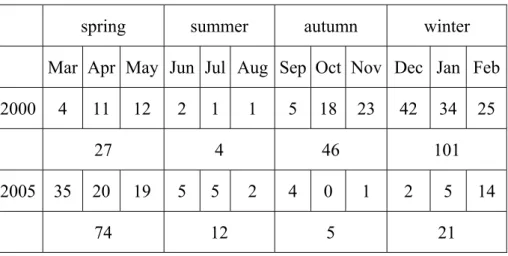
years (Table 1). In 2000, the population size reached low (1-2 individuals / month) during summer. In 2005, the population size remained low from summer to winter (Table 1). The population sizes reached the high points in 2000 winter (December, 42 individuals) and 2005 spring (March, 35 individuals). The distribution of population sizes among seasons was significantly different between years (χ2 = 101.53, d.f. = 3, P < 0.001).
There were ? males and ? females in 2000; ? males and ? females in 2005. Sex ratios were male-biased in both years, however, only the bias in 2000 was significant (G-test, G = 6.08, d.f. = 1, P<0.05). Within each year, there were more males than females in all seasons, however, only the bias of 2000 spring (G= 5.01, d.f. = 1, P < 0.05) and 2005 summer (G = 6.931, d.f. = 1,
P<0.01) were significant.
There were more males than females in each patch type except sparse patch probably because there were too few individuals lived in sparse patches. Male/female sex ratios ranged from 1.54 to 1.87 each patch. However, only the dense patch population in 2000 deviated from 1:1
significantly (G-test, G = 4.818, d.f. = 1, p<0.05).
Recruitment and Disappearance
There was no recruitment in summer both years. In other seasons, more recruits appeared in 2000 than 2005 (Table). The distribution of recruits among seasons was not significantly different between years (χ2 = 6.15, d.f. = 3, P>0.05), though the amount of recruits were significantly larger in 2000 than 2005 (Wilcoxon signed rank test, W+ = 36, W- = 0, N=8, p<0.01). There were few emigrants in summer both years. However the emigrants made up 25 % and 33.33 % of summer population in 2000 and 2005, respectively. The distribution of emigrants among seasons between years was significantly different (χ2 =54.78, d.f. = 3, P<0.001), but the amount of emigrants were not different between two years (Wilcoxon signed rank test, W+ = 36.50, W- = 18.50, N = 10, p > 0.05).
= 2.715, P>0.05). The recruits among patches distributed randomly in 2000 (χ2 =4.3471, P>0.05), but the distribution was not random (χ2 =8.2251, P<0.05) in 2005. The distribution of emigrants among patches was not significantly different between years (χ2 = 3.521127, P>0.05). The emigrants distributed randomly among patches in 2000 (χ2 = 3.857303, P>0.05), but the distribution was not random in 2005 (χ2 = 14.25556, P<0.05).
Habitat succession and harvest mice distribution
Habitat succession occurred in Guandu salt marsh (Fig. 4). From 2000 to 2005, the dense patch decreased from 83.47 % to 53.49 %, mix patch increased from 14.05 % to 38.21 % and sparse patch increase from 2.48 % to 8.31 % (Table 2). The change in the percentage of each patch type was significant (G-test, Gadj = 17.699, d.f. = 2, P < 0.0001).
Furthermore, not only did the area but also the continuity of dense patch decrease from 2000 to 2005 (Fig. 4). The spatial distribution of harvest mice in the study site matched that of dense patches (Fig. 5). The preference of the dense patch type by the harvest mouse was significant in 2005 (χ2 = 15.10, d.f. = 2, P < 0.01), but not in 2000 (χ2 = 5.80, d.f. = 2, P > 0.05). The density of the harvest mouse was highest in dense patch and lowest in sparse patch in both years (Fig. 6).
Reproductive success
According to the weight distribution of the harvest mouse population, I defined individuals with body weights lower than 6g juveniles (Fig. 7). The reproductive success of harvest mice within each patch type in 2000 and 2005 were shown in Fig.8. There was not any juvenile caught in sparse patch during both years. No significant difference in reproductive success between mice inhabited dense and mix patches was observed in 2000 (Fisher’s exact test, P > 0.05). In 2005, reproductive success of mice inhabited mix patch tended to be higher than those in dense patches, though the difference was not statistically significant (Fisher’s exact test, P > 0.05).
Genetic structure of the harvest mouse population Variation of microsatellite
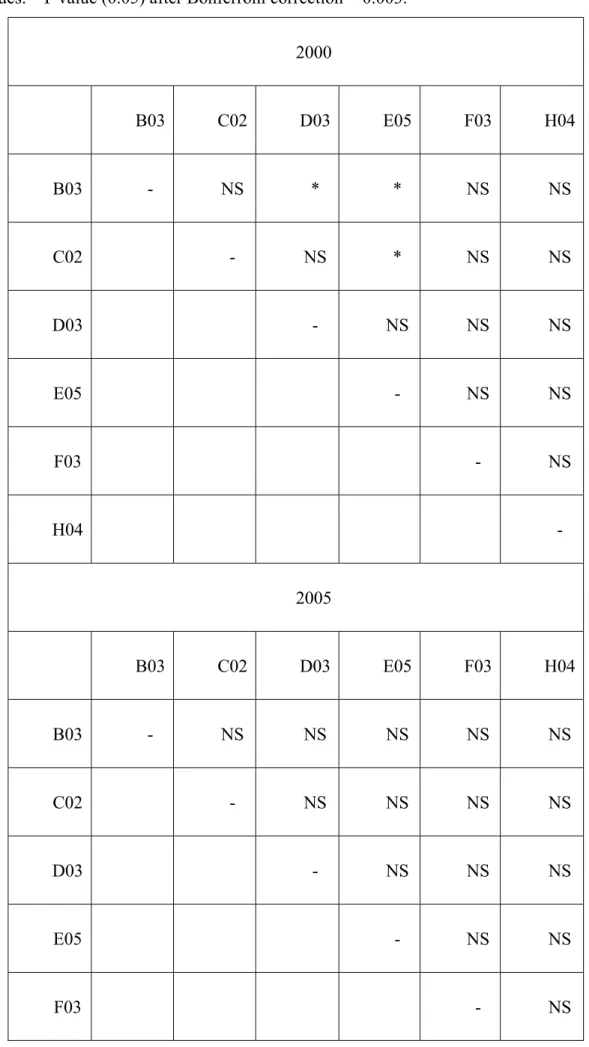
All six microsatellite loci are polymorphic in the harvest mouse populations from 2000 and 2005. The number of alleles per loci ranged 6-10 and 5-10 in 2000 and 2005, respectively. The observed heterozygote ranged 0.706-0.843, and 0.637-0.854 in 2000 and 2005, respectively (Table 3). Comparing the genetic diversity between 2000 and 2005, the number of alleles per locus, allelic richness and Ho are not significantly different (Wilcoxon signed rank test). No loci showed departure from the Hardy-Weinberg equilibrium. I detected linkage disequilibrium in 3 pairs of loci in the population of 2000 (Table 4). The disequilibrium in 2000 population may be caused by genetic drift rather than physical linkage of these loci (Tomoko, 1982). No evidence indicated null alleles, large allele drop out, or error due to stutter.
Bottleneck between years
The analyses by either mode shift or heterozygote excess didn’t detect bottleneck effect in 2000 and 2005 populations. However, M-ratios were 0.669 in 2000 and 0.618 in 2005, both showed values indicated bottleneck (Garza and Williamson 2001). The M-ratio is a more powerful method than the other two (REF). The results revealed that both 2000 and 2005 populations have gone through bottlenecks, thus the reduction of population size that cause the bottleneck effect occurred before year 2000.
Bottleneck between seasons (temporal differentiation)
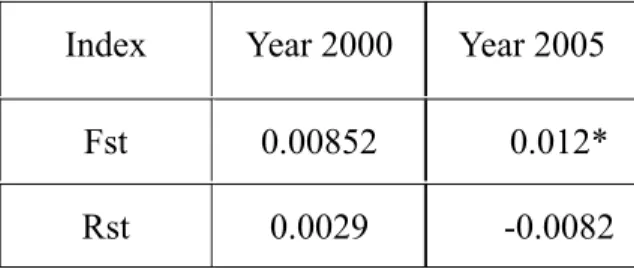
The harvest mice population sizes in the Guandu salt marsh went through a very low point during summerinboth2000and2005 (Table 1). Few individuals lived from spring to autumn. Only one out of 119 individuals in 2000, and 2 out of 62 individuals in 2005 lived from spring through summer to autumn. I analyzed the temporal differentiation between spring and autumn (winter) populations. Clustering analyses using the software STRUCTURE showed that only the population was not temporally structured (K=1). On the other hand, although Fst and Rst values indicated that populations did not differentiate between season in 2000, the Fst value did support that the population was not temporally structured in 2005 (Table 3, Fst = 0.012, p<0.05).
Harvest mice distributed mostly in dense patches. In 2000, dense patches were more or less contiguous, yet were separated by sparse patches in 2005 (Fig. 4 and 5). Thus, the population tended to aggregate on the east and west sides of the study site (Fig. 5). The gene flow between the two sides was low in both years. The Capture-Mark-Recapture (CMR) data did not detect any dispersal event between the two sides in 2005, and only one dispersal occurred in 2000.
Two clustering methods were applied to detect spatial genetic structure of harvest mice. I divided both populations by spring and winter (autumn) groups in order to eliminate the temporal effect on population genetic structure. Both software TESS 1.1 and STRUCTURE 2.1 detected only one population in the study site in both years. The divergence between east and west subpopulations of harvest mice was not significant in 2005 ( Fst = -0.0047, P>0.05) and 2000 (Fst = 0.007, P>0.05).
Discussion
Many studies have shown that geographical subdivision can affect population structure. Most focused on how artificial or natural geographical boundaries shaped the population structure of focal species (Johnson et al., 2003; Keller et al., 2004; Proctor et al., 2005). The relationship between succession and animal populations have been studied a lot (Yarnell et al., 2007; Zhang et al., 2007; Briani et al., 2004), however, few studies evaluate the effects of succession on the structure of animal populations (but see Tallmon et al., 2002). The current study found that the vegetative cover of the Guandu salt marsh has changed temporally (Fig. 1), and offered a great opportunity to study the effects of succession on population structure of small mammals.
Succession and population size
Micromys minutus preferred to live in dense patches which might be because of the
suitability for nesting (Bence et al., 2003). A previous study in the same site also supported this point (Lee, 2001). The highest densities occurred in dense patches in both years (Fig.5), and the
preference was statistically significant in 2005 and marginally in 2000 (P=0.0553). Furthermore, the reproductive success was highest in dense patches in 2005(Fig.8). The succession in
Guandu salt marsh not only changed the distribution of different patches (Fig.4), but also the proportions among them (Table 2). The area of dense patches favored by Micromys minutus decreased nearly 30% from 2000 to 2005. In the same time, the population size of harvest mice also decreased from 119 to 62 individuals.
Nevertheless, several other variables such as climate, food availability, predation, and
interspecies competition could change along with succession. They may have changed due to or independent of succession. It was not clear which of those factors contribute more than others to the changes observed in the harvest mouse population.
In 2000, the averaged reproductive success was not different between dense and mix patch. This pattern could be explained by the ideal free distribution. The higher population density in 2000 might reduce the suitability of the favored dense patches, and force some individuals to use less-preferred patches. Thus, the succession of the salt marsh affected the population size of harvest mice, and would change the habitat utilization pattern.
Succession and spatial distribution
Habitat succession changed not only the spatial distribution of dense patches, but also the connectivity between patches (or subpopulations of harvest mice). Comparing the population distribution of harvest mice in 2000 and 2005, I found that the connectivity of population was lower in 2005. The 2005 population tended to be separated into two subpopulations (Fig.5). However, I did not detect genetic differentiation between the two subpopulations. The
individuals dispersed between the two subpopulations have been limited probably relied on the corridor lied in the north side of the study site. Due to the expansion of sparse patch over the course of succession, if the succession continues, dispersal would be further reduced by the sparse patches. I believe succession have the potential to structure the genetic of harvest mouse further in Guandu salt marsh.
I detected bottleneck effect in both 2000 and 2005 with M-ratio (Garza and Williamson, 2001) but not mode-shift and heterozygosity excess (Cornuet & Luikart, 1996; Luikart & Cornuet, 1998). M-ratio allows for the detection of ancient bottlenecks that may be difficult to be observed using heterozygosity excess or mode shift approaches (Zenger et al., 2003; Abdelkrim et al., 2005; Spear et al., 2006). The M-ratio test can also detect very recent bottlenecks; as with the heterozygosity excess and mode-shift tests, the power to detect a bottleneck should be
strongest in the recovery period immediately following the population crash before rare alleles return via migration and/or mutation. Since only M-ratio detected bottleneck effect in the harvest mice population of 2000 and 2005, it implied the population reduction may happen long before 2000, and the bottleneck signature could be detected by mode-shift and heterozygosity excess may have become weak. The observed pattern of bottleneck could be associated with the dynamic patterns of harvest mouse populoation. Harvest mice populations undergo major fluctuations year to year (Sleptsov, 1947; Piechocki, 1958; Kaikusalo, 1972; Migula et al., 1970; Trout, 1976). Previous studies indicated the maximum population size between consecutive years could decrease 8-folds. This suggested harvest mice frequently suffered from bottleneck effects due to annual major fluctuation.
Seasonal dynamics of harvest mice and its effects on genetic structure
Both the field data in 2000 (Lee, 2001) and 2005 indicated that Micromys minutus
population size fluctuated seasonally. In spring or winter, the population size reached the high point of the year (Table 1). The population sizes in the summers were very low. This pattern was similar to the reduction in summer recorded in England and Russia (Sleptov, 1947; Trout, 1976). Although Harris (1979) argued that Micromys minutus was not active on the ground level during summer, which might make them less likely to be trapped by traps placed on the ground, study on Barn owl pellets collected during the same study (Trout, 1976) from the same farms at 6-week intervals produced a curve of “apparent absence” of harvest mice remains (Trout, 1976). A similar “summer low” situation was found in Norfolk as well (Buckley, 1977). This suggested that harvest mouse population size did reduce in summers. Nevertheless, shift in habitat utilization between seasons might be a possibility that resulted in summer low. The
sparse patches composed of common reed (Phragmites communis) could grow to 2-3 m in height. If harvest mice utilized common reed and were active on the vegetation instead of ground level during summer, it would be difficult to trap them. This is unlikely, however. Kuroe (2007) found harvest mice avoid utilizing common reed for nesting, because the density of Phragmites
communis leaf area is too low to building nests.
Probably due to the prolonged population reduction in summer, the Fst value indicated populations between 2005 spring and autumn have been differentiated. Although Rst detected no differentiation both years, it had been suggested that Fst had better performance in detecting population differentiation when the divergence among samples is expected to be low (Balloux and Goudet, 2002). Nevertheless, I did not detect temporal differentiation in 2000. It could be explained by several intra- and inter-population factors. First, the population size was smaller in 2005 than 2000. Smaller population size would render the 2005 population susceptible to genetic drift than in 2000. Secondly, the intensity of drift would be stronger in 2005 than in 2000, because the former had a longer reduction of population size than the latter. Furthermore, the landscaped surrounding the focal population had changed between 2000 and 2005, and could contribute to the temporal differentiation in 2005. First, individuals immigrated from the unsampled harvest mice population outside the study site could alleviate the effects of summer low. Especially at the east side of study site there was suitable habitat for harvest mice. Between year 2000 and 2005, several artificial ponds have been established for wetland management in the Guandu Nature Park. The construction greatly reduced the harvest mice habitat, and could reduce immigration from the unsampled area into study site. Thus,
inter-populationally, gene flow between focal and unsampled population was higher in 2000 than 2005; intra-populationally, genetic drift was more intensive in 2005 than 2000 due to the
extended summer low. Together they may enhance the population differentiation in 2005.
The differentiation between seasons implied the reduction in summer every year had the ability to affect the genetic structure of the harvest mouse. Thus, the impact on population genetic structure could happen in a relatively fine temporal scale compared to other temporal
differentiation studies (Sinsch, 1992).
References cited
AARS, J., ET AL. 2006. Widespread gene flow and high genetic variability in populations of water voles Arvicola terrestris in patchy habitats, Molecular Ecology 15:1455-1466. ABDELKRIM, J., M. PASCAL, AND S. SAMADI. 2005. Island colonization and founder
effects: the invasion of the Guadeloupe islands by ship rats (Rattus rattus), Molecular Ecology 14:2923-2931.
BALLOUX, F., AND J. GOUDET. 2002. Statistical properties of population differentiation estimators under stepwise mutation in a finite island model, Molecular Ecology 11:771-783.
BERTHIER, K., N. CHARBONNEL, M. GALAN, Y. CHAVAL, AND J. F. COSSON. 2006. Migration and recovery of the genetic diversity during the increasing density phase in cyclic vole populations, Molecular Ecology 15:2665-2676.
BOWEN, B. S. 1982. Temporal Dynamics of Microgeographic Structure of Genetic-Variation in Microtus-Californicus, Journal of Mammalogy 63:625-638.
BRIANI, D. C., A. R. T. PALMA, E. M. VIEIRA, AND R. P. B. HENRIQUES. 2004. Post-fire succession of small mammals in the Cerrado of central Brazil, Biodiversity and
Conservation 13:1023-1037.
BUCKLEY, J. 1977. Barn Owl Predation on Harvest Mouse, Mammal Review 7:117-121. CHEN, C., E. DURAND, F. FORBES, AND O. FRANCOIS. 2007. Bayesian clustering
algorithms ascertaining spatial population structure: a new computer program and a comparison study, Molecular Ecology Notes 7:747-756.
CORNUET, J. M., AND G. LUIKART. 1996. Description and power analysis of two tests for detecting recent population bottlenecks from allele frequency data, Genetics
144:2001-2014.
FALUSH, D., M. STEPHENS, AND J. K. PRITCHARD. 2003. Inference of population structure using multilocus genotype data: Linked loci and correlated allele frequencies, Genetics 164:1567-1587.
FRANCOIS, O., S. ANCELET, AND G. GUILLOT. 2006. Bayesian clustering using hidden Markov random fields in spatial population genetics, Genetics 174:805-816.
GARZA, J. C., AND E. G. WILLIAMSON. 2001. Detection of reduction in population size using data from microsatellite loci, Molecular Ecology 10:305-318.
ISHIWAKA, R., AND T. MORI. 1998. Regurgitation feeding of young in harvest mice, Micromys minutus (Rodentia : Muridae), Journal of Mammalogy 79:1191-1197. JOHNSON, J. A., J. E. TOEPFER, AND P. O. DUNN. 2003. Contrasting patterns of
mitochondrial and microsatellite population structure in fragmented populations of greater prairie-chickens, Molecular Ecology 12:3335-3347.
KELLER, I., W. NENTWIG, AND C. R. LARGIADER. 2004. Recent habitat fragmentation due to roads can lead to significant genetic differentiation in an abundant flightless ground beetle, Molecular Ecology 13:2983-2994.
KELLER, L. F., ET AL. 2001. Immigration and the ephemerality of a natural population bottleneck: evidence from molecular markers, Proceedings of the Royal Society of London Series B-Biological Sciences 268:1387-1394.
KUROE, M., S. OHORI, S. TAKATSUKI, AND T. MIYASHITA. 2007. Nest-site selection by the harvest mouse Micromys minutus in seasonally changing environments, Acta
Theriologica 52:355-360.
LUIKART, G., AND J. M. CORNUET. 1998. Empirical evaluation of a test for identifying recently bottlenecked populations from allele frequency data, Conservation Biology 12:228-237.
OHTA, T. 1982. Linkage Disequilibrium Due to Random Genetic Drift in Finite Subdivided Populations, Proceedings of the National Academy of Sciences of the United States of America-Biological Sciences 79:1940-1944.
PRITCHARD, J. K., M. STEPHENS, AND P. DONNELLY. 2000. Inference of population structure using multilocus genotype data, Genetics 155:945-959.
PROCTOR, M. F., B. N. MCLELLAN, C. STROBECK, AND R. M. R. BARCLAY. 2005. Genetic analysis reveals demographic fragmentation of grizzly bears yielding vulnerably small populations, Proceedings of the Royal Society B-Biological Sciences
272:2409-2416.
SCHWEIZER, M., L. EXCOFFIER, AND G. HECKEL. 2007. Fine-scale genetic structure and dispersal in the common vole (Microtus arvalis), Molecular Ecology 16:2463-2473.
SINSCH, U. 1992. Structure and Dynamic of a Natterjack Toad Metapopulation (Bufo-Calamita), Oecologia 90:489-499.
SPEAR, S. F., C. R. PETERSON, M. D. MATOCQ, AND A. STORFER. 2006. Molecular evidence for historical and recent population size reductions of tiger salamanders
(Ambystoma tigrinum) in Yellowstone National Park, Conservation Genetics 7:605-611. STEWART, W. A., J. F. DALLAS, S. B. PIERTNEY, F. MARSHALL, X. LAMBIN, AND S.
TELFER. 1999. Metapopulation genetic structure in the water vole, Arvicola terrestris, in NE Scotland, Biological Journal of the Linnean Society 68:159-171.
TALLMON, D. A., H. M. DRAHEIM, L. S. MILLS, AND F. W. ALLENDORF. 2002. Insights into recently fragmented vole populations from combined genetic and demographic data, Molecular Ecology 11:699-709.
WASER, P. M., AND L. F. ELLIOTT. 1991. Dispersal and Genetic-Structure in Kangaroo Rats, Evolution 45:935-943.
WHITLOCK, M. C. 1992. Temporal Fluctuations in Demographic Parameters and the Genetic Variance among Populations, Evolution 46:608-615.
YARNELL, R. W., D. M. SCOTT, C. T. CHIMIMBA, AND D. J. METCALFE. 2007. Untangling the roles of fire, grazing and rainfall on small mammal communities in grassland ecosystems, Oecologia 154:387-402.
ZENGER, K. R., B. J. RICHARDSON, AND A. M. VACHOT-GRIFFIN. 2003. A rapid population expansion retains genetic diversity within European rabbits in Australia, Molecular Ecology 12:789-794.
ZHANG, M., K. WANG, Y. WANG, C. GUO, B. LI, AND H. HUANG. 2007. Recovery of a rodent community in an agro-ecosystem after flooding, Journal of Zoology 272:138-147.
Table 1. Population sizes of the harvest mouse by season and month in 2000 and 2005. spring summer autumn winter
Mar Apr May Jun Jul Aug Sep Oct Nov Dec Jan Feb
2000 4 11 12 2 1 1 5 18 23 42 34 25
27 4 46 101
2005 35 20 19 5 5 2 4 0 1 2 5 14
Table 2. The percentage of each patch type in dry and wet seasons of 2000 and 2005.
2000-1 wet 2000-1 dry 2005-6 wet 2005-6 dry 2000-1(average) 2005-6(average)
Dense 85.12% 80.99% 54.49% 47.51% 101(83.47%) 161(53.49%)
Mix 13.22% 15.70% 34.55% 45.85% 17(14.05%) 115(38.21%)
Sparse 1.65% 3.31% 10.96% 6.64% 3(2.48%) 25(8.31%)
Total
Table 3. The number of alleles (A), allelic richness, number of samples (N), observed heterozygosities (Ho) and expected heterozygosities (He) in the harvest mouse population in 2000 and 2005. Locus A Allelic richness N Ho He Hardy-Weinberg equilibrium 2000 B03 8 8 127 0.843 0.843 Yes C02 7 6.934 128 0.750 0.747 Yes D03 10 10 120 0.800 0.793 Yes E05 8 8 128 0.742 0.763 Yes F03 6 5.952 126 0.730 0.706 Yes H04 8 7.875 128 0.711 0.708 Yes 2005 B03 10 10 74 0.757 0.854 Yes C02 6 5.972 72 0.736 0.761 Yes D03 7 7 70 0.814 0.748 Yes E05 6 6 74 0.608 0.637 Yes F03 6 6 73 0.726 0.732 Yes
H04 5 5 73 0.740 0.709 Yes
Table 4. The occurrence of linkage disequilibrium in 2000 and 2005. *: indicates significant values. P value (0.05) after Bonferroni correction = 0.003.
2000 B03 C02 D03 E05 F03 H04 B03 - NS * * NS NS C02 - NS * NS NS D03 - NS NS NS E05 - NS NS F03 - NS H04 - 2005 B03 C02 D03 E05 F03 H04 B03 - NS NS NS NS NS C02 - NS NS NS NS D03 - NS NS NS E05 - NS NS F03 - NS
Table 5. The temporal differentiation of spring and autumn populations. Index Year 2000 Year 2005
Fst 0.00852 0.012* Rst 0.0029 -0.0082
Figure 1. The conceptual map of the current research.
Patch size (area & shape)
Dispersal rate
Population size
Gene flow Genetic drift
Patch quality (shelter & food)
Population bottlenecks Population genetic structure
Habitat patchiness Immigration /
Figure 2. An aerial view of the Guandu Nature Reserve in northern Taiwan. The rectangular frame indicates the study site.
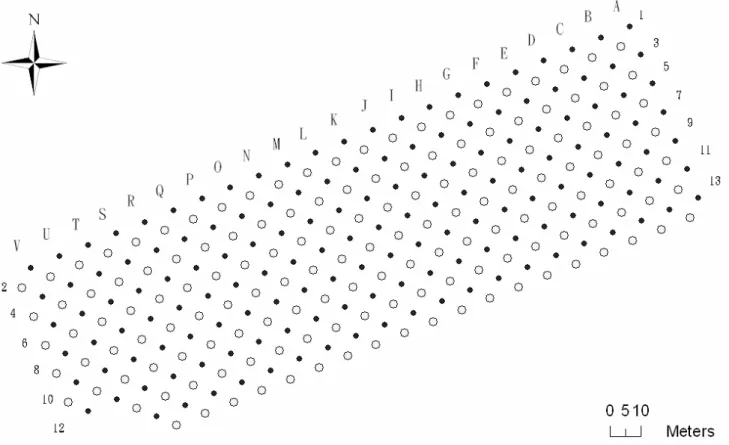
Figure 3. The trapping grid at the study site. Solid and empty dots represent odd- and
even-numbered transect lines, respectively. A total of 301 stations covered an area of 65 x 215 m2.
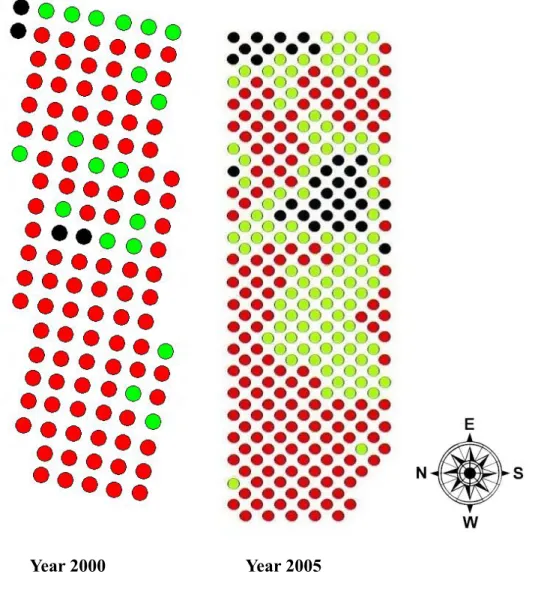
Year 2000 Year 2005
Figure 4. Patch type distribution in 2000 and 2005, red dots: dense patch; green dots: mix patch; black dots: sparse patch.
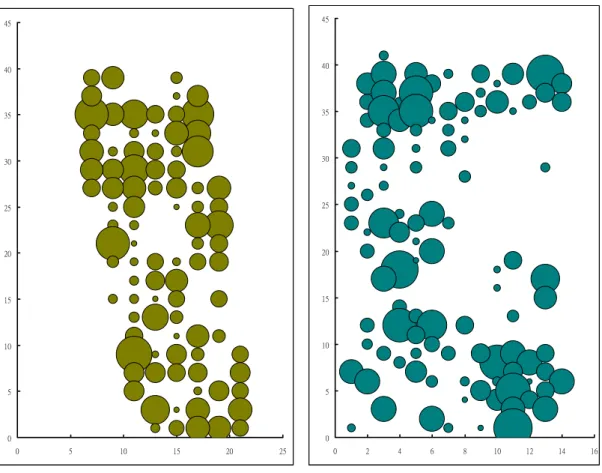
0 5 10 15 20 25 30 35 40 45 0 5 10 15 20 25 0 5 10 15 20 25 30 35 40 45 0 2 4 6 8 10 12 14 16 Year 2000 Year 2005
Figure 5. Spatial distribution of the harvest mouse at the study site. The area of each circle was proportional to the number of harvest mice at each station.
population density of harvest mice in each patch type 0 20 40 60 80 100 120
dense mix sparse patch type th e ap p ea ra nc e inde x of h ar ve st m ic e 2000-1 2005-6
Figure 6. Population density (number per station) of harvest mice in each patch type in 2000 and 2005.
distribution of the weight of mature harvest mice (2000) 0 5 10 15 20 25 4-4.9 5-5.9 6-6.9 7-7.9 8-8.9 9-9.9 10-10.9 weight category numbe r of h ar ve st m ic e
distribution of the weight of mature harvest mice (2005)
0 2 4 6 8 10 12 14 4-4.9 5-5.9 6-6.9 7-7.9 8-8.9 9-9.9 10-10.9 weight category num be r of h ar ve st m ic e
reproductive success in each patchtype 0 0.2 0.4 0.6 0.8 1 1.2 1.4
dense mix sparse
patch type re p ro duc ti ve s u cc es s (j uve ni le / a dul t fe m al e) 2000 2005
Figure 8. The reproductive success, numbers of recuits per adult female, of the harvest mouse population in each patch type.
出席國際學術會議發表之論文摘要
以下論文將在美國哺乳動物學會年會(Ecological Society of America)發表。將在美國
Milwaukee 市(Wisconsin,USA,August 3-8,2008)舉行。由於尚未成行,故未附會議心得 報告。
A comparison of visual vs. odorous cues of predators on the life-history of the Latouchi’s frog tadpoles
Yu-Teh Lin, Wei-Shin Peng and Shu-Hui Kuan
Institution of Ecology and Evolutionary Biology, National Taiwan University
An assumption on the study of amphibian life-history states that environmental risk is greater for larval than adult stage. Other things being equal, individuals with shorter larval stages should expect greater fitness. The threat of predation is a major environmental risk for tadpoles develop in the ponds. We presented the Latouchi’s frog (Rana latouchii) tadpoles with predator cues (from water scorpions) to investigate their effects on the growth and development of tadpoles, and the jumping ability of froglets. Four types of cues were presented: visual, odor of predators, odor of predators consuming tadpole, & none. We tested the hypothesis that different cues had differential effects on the fitness of the Latouchi’s frog. The results showed that visual cues elicited the greatest declined in fitness compared to the control (no predator cue). The mortality was high, and the body growth rate and developmental rates were both low for the visual cue group. The 2 groups that encountered odorous cues had similar fitness. Yet both had lower body growth rate and developmental rates than the control group. None of the effects on tadpoles was reflected on the jumping ability of froglets. The results indicated that visual cues had greater effects on the Latouchi’s frog tadpoles. However, tadpoles facing environmental risks did not responded with accelerated developmental rates.