Molecular Cloning, Developmental Expression, and
Hormonal Regulation of Zebrafish (Danio rerio)
 Crystallin B1, a Member of the Superfamily
of
 Crystallin Proteins
Jyh-Yih Chen,* Bei-En Chang,† Yi-Hsuan Chen,‡ Cliff Ji-Fan Lin,*
Jen-Leih Wu,*
,‡
,1and Ching-Ming Kuo§
,2*Institute of Zoology, Academia Sinica, Nankang, Taipei, Taiwan, Republic of China; †Graduate Institute of Oral Biology, College of Medicine, and ‡Institute of Fisheries Science, National Taiwan University, Taipei, Taiwan, Republic of China; and §Department of Aquaculture, National Ping-Tung Technology University, Taiwan, Republic of China
Received May 24, 2001
The cDNA sequence of  crystallin B1 was deter-mined from zebrafish (Danio rerio) and compared to the corresponding genes of bovine, rat, chicken, hu-man, and Xenopus. Multispecies comparison of super-family diversity demonstrated crystallin B1 homol-ogy between zebrafish, bovine, chicken, and rat, but large distances to  crystallin B2 and B3. Zebrafish cDNA has a size of 943 nucleotides and encodes a polypeptide of 233 amino acids. Zebrafish crystallin B1 shares 71.30, 75.86, and 71.00% similarities with bovine, chicken, and rat crystallin B1, respectively. Northern blot analysis revealed a single 0.9-kb crys-tallin B1 transcript which was expressed and progres-sively increased in the first 20 h of zebrafish embryo-genesis. Whole-mount in situ hybridization revealed that the crystallin B1 transcript was only specifically expressed in the lens region of the eye. A starvation experiment revealed no variation in mRNA levels after 14 and 21 days. An experiment in which hormone was injected showed that the  crystallin B1 transcript first increased 24 h after the injection of insulin-like growth factor I, insulin-like growth factor II, or growth hormone, then decreased 48 h after injection. The crystallin B1 transcript continuously increased after insulin was injected. Taken together, our results identify the early specific expression of crystallin B1 within the lens. Despite small differences, these re-sults indicate that both the structure of the crystal-lin B1 protein and its involvement with regulation by
growth factors appear to have been remarkably conserved. © 2001 Academic Press
Key Words: zebrafish;  crystallin B1; insulin-like
growth factor; insulin; growth hormone; starvation; in
situ hybridization.
The developing lens of zebrafish is an excellent
model system for the study of many fundamental
mor-phogenetic processes occurring during embryonic
de-velopment (1). The structure of the lens contains
famil-iar cytoskeletal and other proteins; the major part of
the macromolecular constituents are soluble proteins
of crystallins. The crystallins comprise an
␣ crystallin
family and the
/␥ crystallin superfamily. A Crystallin,
 crystallin, and ␥ crystallin are specialized lens
pro-teins, each the product of genes that may have formed
from duplication and divergent evolution from the
same ancestors with different functions (2). The
present report concerns the
 crystallin B1 gene of the
zebrafish. Since most of a fish’s lens in the water is in
direct contact with environmental factors (e.g., toxins,
nutritional factors, aquatic bacteria, and viruses),
cat-aracts may form easily. One of hopothesis for the
prev-alence of cataracts with age is that the chaperone
ca-pacity of
␣ crystallin becomes exhausted with time (3).
However,
 crystallins are expressed in both
mitoti-cally active and anterior epithelial cells in the chicken
(4).
 crystallin B1 first appear in elongating equatorial
cells of the lens and accumulates in nondividing,
pos-terior fiber cells (5). Little is known about how insulin,
IGF-I, IGF-II, and GH affect the protein composition of
the lens fiber cells with possible consequences of
cata-racts. To address this question at the molecular level,
major lens structural proteins such as crystallins are
1To whom correspondence and reprint requests may be addressed
at Laboratory of Marine Molecular Biology and Biotechnology, Insti-tute of Zoology, Academia Sinica, Nankang, Taipei, Taiwan 115, Republic of China. Fax: 886-227824595. E-mail: [email protected]. edu.tw.
2To whom correspondence and reprint requests may be addressed.
Fax: 886-87740344. E-mail: [email protected].
Biochemical and Biophysical Research Communications 285, 105–110 (2001) doi:10.1006/bbrc.2001.5099, available online at http://www.idealibrary.com on
105 0006-291X/01 $35.00
Copyright © 2001 by Academic Press All rights of reproduction in any form reserved.
being studied. They are not only abundantly
synthe-sized during various steps of embryogenesis but also
are expressed in a region-specific manner in the lens.
The
- and ␥-crystallins are found only in fiber cells;
their mRNAs appear and accumulate sequentially
dur-ing the course of in vitro and in vivo differentiation
(6 – 8). It is useful in in vitro fiber cell differentiation
studies to use
 and ␥ crystallins as markers. The fiber
differentiation response can induce and specifically
re-spond to FGF, but it also modulates a differentiation
response in other growth factors. In vitro
differentia-tion of rat lens explants with the addidifferentia-tion of both
insulin and FGF-2 resulted in a six-fold increase in the
ratio of
␥ crystallin to  crystallin over that found when
only FGF-2 was added (9). In the presence of FGF-2,
IGF-I or insulin will synergistically enhance both the
differentiation and proliferation responses; but only
proliferation occurs in the absence of FGF-2 (10, 11).
These effects appear to be mediated through the IGF-I
receptor. Under the background described above, we
attempted to identity zebrafish
 crystallin B1 cDNA,
as well as its specific expression in developmental
stages, and hormonal regulation of
 crystallin B1.
mRNA hybridization data imply an identical primary
transcript at 20 hpf. Whole-mount in situ hybridization
data show
 crystallin B1-specific expression in the
lens region. To prove whether growth factor regulation
is involved in
 crystallin B1 gene expression, we used
real-time quantitative PCR to address the question. It
appears from our results that growth factor-dependent
expression will affect
 crystallin B1 expression.
MATERIALS AND METHODS
Isolation of zebrafish crystallin B1 cDNA clones and sequence analysis. PCR primers for cloning crystallin B1 cDNA are located on conserved coding regions. PCR primers (Quality Systems, Taiwan and Mdbio, Taiwan) were designed based upon the comparison re-sults of crystallin B1. CRQ1 primer, 5⬘-GATGGAGGTCCAGAAT-GAGT; CRQ2 primer, 5⬘-GGAATGGACAGAGTCCGCAG; CRP1 primer, 5⬘-CGGGGTGGGAGTGCGACGGG; CRP2 primer, 5⬘-ACT-CTGTCGCAGAAACCGTG; CRP3 primer, 5 ⬘-CGCCCACAGGGTT-GGCACAT. Real-time quantitative PCR primers, 5 ⬘-ATGTCTCA-GACCGCCAAATCCGC; 5⬘-CCTGGTCAAACAGGAAGATTTTG. A zebrafish heart cDNA library and a zebrafish 24-h embryo cDNA library were used as a template to amplify internal fragments as a screening cDNA library probe. The PCR reaction was carried out in a final volume of 100L. The reaction consisted of the cDNA library liquids, 10L of 10⫻ PCR buffer (HT Biotechnology, U.S.A.), 200 M of each dNTP, 1g of the IGFBP and HDLBP forward and reverse primers, and 2.5 units of Taq DNA polymerase. The reaction and process followed those we published before (12–15). The PCR product was purified by electroelution and used as a probe for isolating 1 million clones from a zebrafish heart cDNA library and a zebrafish 24-h embryo cDNA library by the plaque hybridization method, as we published previously (12–15). crystallin B1 cDNA was analyzed with an automated Applied Biosystem 373A Genetic Analysis Sys-tem. Nucleotides and the resulting translation sequences were aligned and compared using the PILEUP and GAP programs (Ge-netics Computer Group), respectively.
RNA isolation and quantification of mRNA using real-time reverse transcription polymerase reaction assays. Starvation and hormonal treatment of gene regulation affected variations in mRNA levels. Each 0.4-g zebrafish was injected intraperitoneally with 1g IGF-I or 1g IGF-II or 1 g GH or 1000 g insulin. After the injection, we extracted total RNA at different times. Total RNA was isolated from the starvation-treated and hormone-regulated zebrafish following the manufacturer’s protocols (ULTRASPECTM-II RNA isolation sys-tem; Biotecx Laboratories, U.S.A.). Each group was replicated three times. Total RNA at 5g was transcribed as first-strand cDNA by a random primer for the hormone regulation and starvation experi-ments. Real-time quantitative PCR produced values which represent an arbitrary unit defined as real-time quantitative PCR analysis of crystallin B1 and-actin transcripts from different fish. Five micro-grams of total RNA was isolated from each tissue and transcribed to 50L of first strand cDNA; 1 L of first strand cDNA and 1 g of each primer were used to run real-time quantitative PCR. An 18-l volume was loaded into the glass microcapillary reaction vessels. The cDNA was denatured by heating to 96°C for 1 min. The template was amplified by 50 cycles of denaturation for 30 s at 95°C, annealing of primers at 60 – 65°C for 30 s and extension at 72°C for 10 –20 s. Fluorescence data was acquired during annealing or extension for reactions containing SYBR Green I. Thereafter, PCR products were identified by generating a melting curve. Since the melting curve of a product is sequence specific, it can be used to observe the loss of fluorescence at the denaturation temperature. The melting protocol consisted of heating the samples to 96°C followed by cooling to 50°C and slow heating at 0.2°C/s to 97°C while monitoring fluorescence. The curve was then redrawn as the negative derivative of fluores-cence with respect to temperature to generate a melting peak. Test cDNA values were compared with standard cDNA and counted. Primers were used at a concentration of 1g in each reaction. The RT-PCR parameters followed the protocols of the LightCycler-DNA Master SYBR Green I instrument (Roche). Relative quantities of mRNA were calculated with a known quantity of PCR fragments of  crystallin B1 and -actin using the comparative threshold cycle number of each sample fitted to a five-point standard curve.
Northern blot analysis and whole-mount in situ hybridization. Total RNA was isolated from zebrafish at different developmental stages using the guanidinium–phenol– chloroform extraction method (31). Fractions of 10 g of RNA were separated on 1.4% formaldehyde/MOPS agarose gel, transferred to Hybond N⫹ nylon membranes (Amersham), and fixed using UV irradiation cross-linking (Stratagene). crystallin B1 PCR fragments (bp 193–bp 597) were radioactively labeled with [32P]dCTP (random primer kit,
Strat-agene) and used as a hybridization probe. Hybridization was carried out overnight at 60°C. To study the expression of crystalline genes during embryogenic lens development, embryos were fixed and pro-cessed for whole-mount in situ hybridization (32). The isolated crys-tallin cDNAs were used to synthesize sense and antisense RNA probes by using a DIG RNA labeling kit (Boehringer Mannheim). After hybridization at 62°C, specimens were washed at the same temperature with 0.2⫻ SSC, and positive signals were detected using a DIG nucleic acid detection kit (Boehringer Mannheim).
RESULTS AND DISCUSSION
To isolate a full-length cDNA fragment coding the
zebrafish
 crystallin B1 (EMBL Accession No.
AJ317957) protein, RT-PCR amplification of total RNA
of eyes was applied using oligonucleotide primers as
described under Materials and Methods. A PCR
prod-uct of approximately 405 bp encoding a truncated
cDNA product was cloned into the TOPO vector.
Se-quencing of the PCR fragments verified that the cloned
PCR products encoded the
 crystallin B1 protein of
zebrafish. Then, using the internal fragment as a
probe, we screened about 1 million recombinant
bacte-riophages from a 48-h zebrafish cDNA library, and
finally obtained four positive colonies. The
recombi-nant plasmids of each of these clones were in vivo
excised, extracted, and sized by 1% agarose gel
electro-phoresis. One of the four clones was chosen for further
studies. The size of the cDNA appeared to be about 1 kb
and was identified as zebrafish
 crystallin B1 by
se-quencing. The nucleotide sequences were originally
cloned into the EcoRI site of the phage ZAP vector.
Recombinant DNA was used for sequence analysis of
zebrafish
 crystallin B1 as described in Fig. 1. The
zebrafish
 crystallin B1 cDNA gene contains 81 bp in
5
⬘UTR and 209 bp in 3⬘UTR, and the coding region has
a length of 699 bp. The ATG to TGA domains of the

crystallin B1 mature peptide translated into a
233-amino-acid residue. A common feature of mRNAs in
higher vertebrates is the presence of the sequence
AATAAA in the region from 11 to 30 nucleotides
up-stream of the site of poly(A) addition. A putative
poly-adenylation signal sequence of AATAAA was found in
the 3
⬘UTR (929–934) of zebrafish
 crystallin B1.
These two sites are separated from the above by 10
nucleotides. This indicates that zebrafish possibly uses
only one polyadenylation mechanism. Comparison of

crystallin B1 amino acids from different animals is
shown in Fig. 2. Zebrafish
 crystallin B1 domains
compared to bovine
 crystallin B1, chicken 
crystal-lin B1, rat
 crystallin B1, bullfrog  crystallin B2, and
human
 crystallin B2 domains possess similarities of
71.3, 75.9, 71.0, 66.3 and 63.9%, and identities of 66.5,
65.9, 65.8, 56.59, and 53.7%, respectively. With
pre-dicted amino acid sequence comparison between
ani-mal species, we inferred that the ancestral
 crystallin
B1 domains have been highly conserved. Comparison
of the aa sequences shows that zebrafish
 crystallin
B1 is evolutionarily close to that of the chicken.
How-ever, the common feature of
 crystallin B1 in all
animals reported is a proline–alanine (PAPA) sequence
in the N-terminus, which is thought to play a role in
interaction with cytoskeletal proteins and/or plasma
membranes (16). In zebrafish
 crystallin B1 we have
found a proline- and alanine-rich sequence in its
N-FIG. 2. Amino acid sequence comparison between bovine, rat, chicken, and zebrafish crystalline B1 homologs. The deduced se-quence of the zebrafish crystallin B1 protein contains 222 aa.
FIG. 1. Nucleotide sequence of  crystallin B1 cDNA and de-duced aa sequence of the zebrafish crystallin B1 protein (EMBL Accession No. AJ317957). Uppercase letters in the nucleotide se-quence represent the coding region of 699 bp; lowercase letters represent the noncoding region. The coding sequence and start and stop codons have been identified by aligning the nucleotide sequence of zebrafish with the known  crystallin B1 sequence of chicken, mouse, and human. Numbering of the nucleotide sequence is shown on the left. The start and stop codons are shown in boldface.
Vol. 285, No. 1, 2001 BIOCHEMICAL AND BIOPHYSICAL RESEARCH COMMUNICATIONS
of crystallin B1 transcripts from embryogenesis stages. Ten micrograms of total RNA isolated from 50 embryos was probed with radioactively labeled PCR-amplified (405 bp) crystallin B1 fragments of zebrafish. 28S and 18S rRNA were used as a loading control. (B) In situ hybridization of crystallin B1 gene expression in the eye region of a zebrafish embryo. On the left is a dorsal view; on the right is the ventral.
terminus; it does not have the typical PAPA sequence
observed in other published animal sequences (17).
Northern blot analysis of total RNA from various
embryo
stages
revealed
cross-hybridization
with
405-bp (PCR)
32P-labeled
 crystallin B1 fragments,
indicating a single
 crystallin B1 transcript in the
embryo stages examined (Fig. 3A). Transcripts were
detectable early in embryogenesis at 20 hpf and of the
size of
⬃1 kb in length. At Xenopus stages 26 to 27,
the
␣A-crystallin signal was first detected, although
faintly, in the central region of the lens placode, while
the
 crystallin B1 signal was first detected in a broad
area of the lens placode at stages 26 to 27 (18). Using
Northern blot and dot blot analysis of rat after birth,
the concentration of
 crystallin B1 transcripts
de-creased sharply. The transcripts of
 crystallin B1
genes were found until the third month after birth. The
results suggest that concentrations of the different
crystallin mRNAs are thus differentially regulated
(19). The time and place of the accumulation of

crys-tallin B1 RNA in the developing zebrafish lens were
studied by in situ hybridization (Fig. 3B). In the rat,

crystallin B1 RNA could be seen only after elongation
of the primary fiber cells.
 crystallin B1 RNA was
confined to fiber cells of fetal lenses, and
 crystallin B1
RNA was relatively poorly detectable by in situ
hybrid-ization in both fetal and newborn rat lenses. Our
re-sults in zebrafish show that
 crystallin B1 RNA begins
to accumulate as soon as in 20 phf with specific
expres-sion only in the lens region.
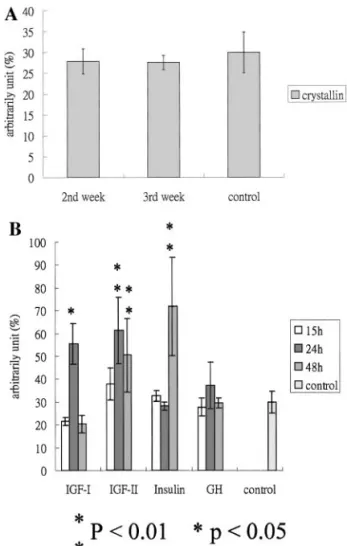
To determine the effect of starvation, insulin, IGF-I,
IGF-II, and GH on zebrafish
 crystallin B1 RNA
ex-pression levels, various concentrations of these growth
factors were injected, and tissue was harvested and
assayed for the expression of
 crystallin B1. Data are
shown in Fig. 4. There were no significant differences
in expression of
 crystallin B1 mRNA by stage of
starvation in zebrafish (Fig. 4A). This proves that the
expression of zebrafish
 crystallin B1 mRNA does not
play a role in impaired growth during nutritional
re-striction in starvation. Our data are demonstrable by
the injected effect as shown in Fig. 4B. After injection
with IGF-I, IGF-II, or GH, we found that in the first
15 h,
 crystallin B1 mRNA had decreased in
compar-ison to the control groups injected with IGF-I or GH,
while in fish injected with IGF-II or insulin, it had
increased. At 24 h after injection with IGF-I, IGF-II, or
GH, the
 crystallin B1 mRNA level had specifically
incrased. However, it had decreased by 48 h. With
injected insulin,
 crystallin B1 mRNA levels increased
after 48 h. This proves that the expressed zebrafish

crystallin B1 mRNA is regulated by insulin families.
However, central explants from postnatal rats were
cultured with concentrations of FGF-2 known to
stim-ulate fiber differentiation or cell proliferation, with and
without IGF-I or IGF-II at concentrations ranging from
0 to 1000 ng/ml (20). IGF-I has been proposed as a
regulator of lens development. This suggestion arose
with the isolation of lentropin, a chick fiber cell
differ-entiation factor identical to IGF-I (21). It has been
shown that excess IGF-I does not stimulate premature
differentiation of epithelial cells in lens (22, 23). In
another report using chick epithelial explants, IGF-I
was involved in the activity of stimulating fiber cell
differentiation (24), while a different study found albeit
modest but similar activity in the rat (10). These data
possibly suggest that epithelial differentiation will
oc-cur in
␣A-IGF-I transgenics (25). It is possible that the
apparent discrepancy between mammalian, avian, and
fish species might be explained by evolutionary
diver-gence of the different signal transduction pathways for
IGF. To determine whether the primary effects of
in-FIG. 4. Real-time quantitative PCR analysis of starvation-treated and hormone-regulated gene expression of crystallin B1. (A) Analysis of crystallin B1 gene expression for different lengths of starvation containing 5g total RNA from adult zebrafish ana-lyzed by real-time rapid cycle fluorescence PCR as described under Materials and Methods. Measured values represent an arbitrary unit ( crystallin B1 PCR value ⫻ (-actin quantitative PCR value)⫺3⫻ 100%) as defined in Materials and Methods. (B) Analysis of  crystallin B1 gene expression after injection of pure IGF-I, IGF-II, GH, and insulin or saline with sacrifice of the animals 15, 24, or 48 h after the injection. Values are the mean ⫾ SE of three animals. *p⬍ 0.05 compared with the control.
Vol. 285, No. 1, 2001 BIOCHEMICAL AND BIOPHYSICAL RESEARCH COMMUNICATIONS
sulin occur at the level of
 crystallin B1 mRNA
vari-ation, our present findings show that the expression of
 crystallin B1 mRNA was found to increase sharply 24
or 48 h after injection, depending on the different
growth factors injected, reaching a steady state level
48 h later for injected IGF-I (Fig. 4B). The effects of
injected insulin reaching a peak level 48 h later agrees
with previous results (26, 27). The levels of
 crystallin
B2 increase the concentration of mRNA in the presence
of insulin and FGF-2. Given the fact that in a previous
study, crystallin mRNAs were shown to be stable, our
data suggest that insulin acts to increase the rate or
transcription. However, insulin receptors have not yet
been reported in rat lens or fish but have been shown to
be present in other mammalian (primate lenses) lens
cells (28). To integrate all that mentioned above, our
results infer that insulin and IGFs may play an
impor-tant physiological role in the fish lens.
ACKNOWLEDGMENTS
We thank Dr. Thomas T. Chen for his comments about these experiments and our manuscript. This work was supported by the National Science Council of the Republic of China.
REFERENCES
1. Fricke, C., Lee, J. S., Geiger-Rudolph, S., Bonhoeffer, F., and Chien, C. B. (2001) Science 292, 507–510.
2. Wistoe, G. J., and Piatigorsky, J. (1988) Annu. Rev. Biochem. 57, 479 –504.
3. Velasco, P. T., Lukas, T. J., Murthy, S. N., Duglas-Tabor, Y., Garland, D. L., and Lorand, L. (1997) Exp. Eye Res. 65, 497–505. 4. Sawada, K., Agata, K., and Eguchi, G. (1992) Exp. Eye Res. 55,
879 – 887.
5. Nagineni, C. N., and Bhat, S. P. (1992) Exp. Eye Res. 54, 193– 200.
6. McAvoy, J. W. (1978) J. Embryol. Exp. Morphol. 44, 149 –165. 7. Van Leen, R. W., Breuer, M. L., Lubsen, N. H., and
Schoenmak-ers, J. G. (1987) Dev. Biol. 123, 338 –345.
8. Stolen, C. M., and Griep, A. E. (2000) Dev. Biol. 217, 205–220. 9. McAvoy, J. W., Chamberlain, C. G., de Iongh, R. U., Richardson,
N. A., and Lovicu, F. J. (1991) Ann. NY Acad. Sci. 638, 256 –274. 10. Richardson, N. A., Chamberlain, C. G., and McAvoy, J. W. (1993)
Invest. Ophthalmol. Vis. Sci. 34, 3303–3312.
11. Liu, J., Chamberlain, C. G., and McAvoy, J. W. (1993) Exp. Eye Res. 63, 621– 629.
12. Chen, J. Y., Chang, C. Y., Chen, J. C., Shen, S. C., and Wu, J. L. (1997) DNA Cell Biol. 16, 883– 892.
13. Chen, J. Y., Tsai, H. L., Chang, C. Y., Wang, J. I., Shen, S. C., and Wu, J. L. (1998) DNA Cell Biol. 17, 359 –376.
14. Chen, J. Y., and Wu, J. L. (1998) J. Fish. Soc. Taiwan 25, 251–263.
15. Chen, J. Y., Chen, J. C., Chang, C. Y., Shen, S. C., Chen, M. S., and Wu, J. L. (2000) Aquaculture 181, 347–360.
16. Hejtmancik, J. F., Thompson, M. A., Wistow, G., and Piatigor-sky, J. (1986) J. Biol. Chem. 261, 982–987.
17. Berbers, G. A., Hoekman, W. A., Bloemendal, H., de Jong, W. W., Kleinschmidt, T., and Braunitzer, G. (1983) FEBS Lett. 161, 225–229.
18. Mizuno, N., Mochii, M., Takahashi, T. C., Eguchi, G., and Okada, T. S. (1999) Differentiation 64, 143–149.
19. Van Leen, R. W., Breuer, M. L., Lubsen, N. H., and Schoenmak-ers, J. G. (1987) Dev. Biol. 120, 457– 464.
20. Civil, A., van Genesen, S. T., Klok, E. J., and Lubsen, N. H. (2000) Exp. Eye Res. 70, 785–794.
21. Beebe, D. C., Silver, M. H., Belcher, K. S., van Wyk, J. J., Svoboda, M. E., and Zelenka, P. S. (1987) Proc. Natl. Acad. Sci. USA 84, 2327–2330.
22. Lovicu, F. J., and Overbeek, P. A. (1998) Development 125, 3365–3377.
23. Robinson, I. C., Gabrielsson, B., Klaus, G., Mauras, N., Holm-berg, C., and Mehls, O. (1995) Acta Paediatr. Suppl. 411, 81– 86. 24. Caldes, T., Alemany, J., Robcis, H. L., and de Pablo, F. (1991)
J. Biol. Chem. 266, 20786 –20790.
25. Shirke, S., Faber, S. C., Hallem, E., Makarenkova, H. P., Rob-inson, M. L., Overbeek, P. A., and Lang, R. A. (2001) Mech. Dev.
101, 167–174.
26. Peek, R., McAvoy, J. W., Lubsen, N. H., and Schoenmakers, J. G. G. (1992) Dev. Biol. 152, 152–160.
27. Civil, A., van Genesen, S. T., Klok, E. J., and Lubsen, N. H. (2000) Exp. Eye Res. 70, 785–794.
28. Sinha, A. C., Stuart, C. A., and Srivastava, S. K. (1990) Lens Eye Toxic. Res. 7, 133–141.
29. Schmittgen, T. D., Zakrajsek, B. A., Mills, A. G., Gorn, V., Singer, M. J., and Reed, M. W. (2000) Anal. Biochem. 285, 194 –204.
30. Winer, J., Jung, C. K., Shackel, I., and Williams, P. M. (1999) Anal. Biochem. 270, 41– 49.
31. Chomczynski, P., and Sacchi, N. (1987) Anal. Biochem. 162, 156 –159.
32. Hemmati-Brivanlou, A., Frank, D., Bolce, M. E., Brown, B. D., Sive, H. L., and Harland, R. M. (1990) Development 110, 325– 330.