Web-Based Peer Assessment: Does Attitude Influence Achievement ?
「網路合作設計科學活動之環境、學習、與評估(總計劃)(2/3)」之 子計劃三:網路合作設計環境及社群設計科學活動的知識建構之評估(2/3)
編號 89-2520-S-009-001-S. J . Sunny Lin 林珊如 Abstr act
In this research, we focus predominantly on attitudes of computer science students toward Web-based peer assessment using NetPeas as the interactive channel and management center. NetPeas is a Web-based peer assessment system implemented for two-way anonymous peer assessment. In an evaluation held in 1999 spring, this study recruited a sample of fifty-eight computer science undergraduate students enrolled in an operating systems class in a research university of Taiwan. Attitudes toward Web-based peer assessment were measured by a posttest questionnaire, including several affective components, for example, “satisfied” or “unsatisfied” about the Web-based peer assessment. The result demonstrated that 1) significantly more students favored this new learning strategy and 2) students with positive attitude outperformed those with negative attitude. Thus, students’ affective components significantly influence their achievement. The specific features of the Web-based peer assessment are to utilize Internet resources to facilitate contacts between individuals and information, to assist in brainstorming among individuals, and to generate more meaningful learning at the higher education level. In the past two years, we have conducted several experiments on Web-based peer assessment and have proved that Web-based peer assessment could improve the performance of computer science students. The first stage of our experiments of Web-based peer assessment demonstrated that project score and feedback quality of students would predict their final examination score in the operating systems course. Then, we have found different thinking style students and different feedback criteria would influence their achievement significantly. However in the past research, we have not yet studied the affective components of computer science students in the Web-based peer assessment process. So the results of this research might give some useful information to researchers and educators interested in computer science education.
1. Introduction
The main concept behind the Networked Peer Assessment System (hereafter abbreviated as NetPeas) (Chiu, Wang, & Yuan, 1998; Liu, Chiu, Lin, & Yuan, 1999) is that teachers ask students to undertake and submit project work over the Internet. This is then discussed and graded by classmates, who then offer suggestions for improving said project work. The student is then asked to make follow up revisions to the original project work in line with this process and the proposals thereby generated. After several rounds of this interaction, the teacher offers a summative grade for pieces of project work, based on his or her professional knowledge. In this set-up, the teacher plays a role that is more akin to that of the general editor of a journal, whilst the participating students are like either an author (in the event that it is their project work), or reviewers. At present, the provision of the NetPeas also has attached to it two important study elements that attitude do influence achievement or not. Web-based peer assessment is achieved in seven steps. Web-Web-based peer assessment is achieved in seven easy steps:
1. The teacher poses questions on a main theme or gives set project work. 2. Within standard parameters, the student designs a homepage, proposes
survey topics and explains the reasoning behind the selection of those survey topics.
3. Students finish the survey paper, and hand in the project work to be assessed by the NetPeas.
4. Students appraise, grade and make proposals concerning the project work presented by six fellow classmates.
5. The system organizes the grading and proposals of the reviewers and informs the student who submitted the project work and the teacher.
6. The student revises the original project work in line with comments made. 7. Steps 4-6 are then repeated.
We provide a brief overview of existing peer assessment in higher education, applied subjects, methods of evaluation, current status of research into peer assessment and Topping's peer assessment typology. Then, we discuss affective components in peer assessment.
The research layout includes the introduction of project work requirements, assessment criteria and peer assessment score, attitude questionnaire score etc. helps to show a clear and complete view of the process followed during our experiment.
propositions, thereby demonstrating the effect of attitudes of computer science students when using NetPeas.
Finally, we summarize our conclusions, propositions and suggestions for reference in the future implementation of Web-based peer assessment.
2. Liter atur e r eview
2.1 Peer Assessment
Topping (1998)provided a general review of about 109 peer assessment articles from 1980 to 1996, located in several different databases, i.e. Social Science Citation Index, the Educational Resources Information Center, and the Dissertation Abstracts International. The keywords used for searching were: peer assessment, peer marking, peer correction, peer rating, peer feedback, peer review, and peer appraisal, together with university, college, and higher education. Forty-two (38%) articles were considered merely descriptive and anecdotal, while Sixty-seven (62%) included outcome data gathered through an orderly research process.
Topping has reported on the use of peer assessment in biological science, second language writing instruction and writing seminar classes in the higher education systems of several countries. Many peer assessment studies only ask students to evaluate and comment on peers’ project work in a summative way, i.e., give a final grade for others’ project work. Such cases are less peer interaction than in the current Web-based peer assessment, and consequently less peer pressure is evoked for further modification.
Overall, the reliability and validity of peer assessment are partially verified by researchers (Catterall, 1995; Rushton, Ramsey, & Rada, 1993; Freeman, 1995; Hughes, 1995; Korman & Stubblefield, 1971), and our own research experiences of Web-based peer assessment is that teachers do not slack on the job and simplify matters. According to past research, peer assessment is should promote students’ deeper intellectual skills and learning attitude.
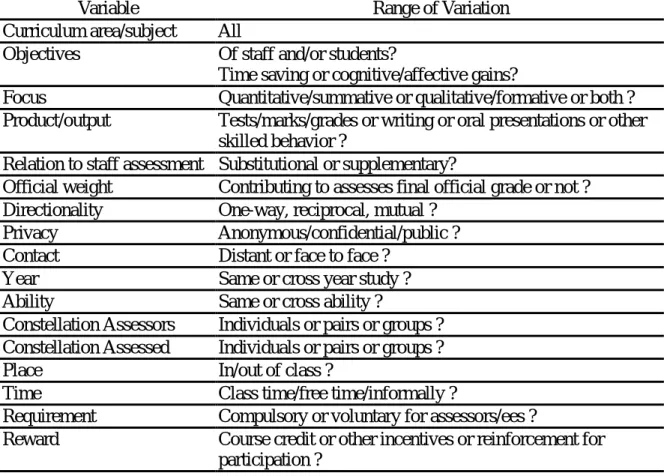
Topping defined peer assessment as an arrangement in which individuals consider the amount, level, value, worth, quality, or success of the products or outcomes of learning of peers of similar status. In order to avoid confusing readers, Topping adopts the following typology (Table 1).
---Insert Table 1 here
---In accordance with Topping's Typology, the typology elements for Web-based peer assessment are listed in Table 2.
---Insert Table 2 here
---In Topping's point of view, available research outcome data remains insufficient. However our research does provide initial outcome data about Web-based peer assessment.
2.2 Affective components in peer assessment
Most peer assessment studies found that students favor such inventive assessment procedure (Topping, 1998), however Lin et al. (1999) also reported that some students have negative feelings.
1. Lin et al. (1999) indicated that some students experience greater peer pressure in the peer assessment. When they found their works have to be reviewed by peers but no teachers, to perform better is to avoid shame and to maintain self-esteem in front of their peers.
2. Some students dislike peer assessment because raters are at the same time competitors. They are afraid of undermarking in which peers give very low score to others or overmarking in which peers give very high score to everyone. In a small pilot test of WebPeas system, Lin et al. (1999) found a detrimental effect. If peer assessment lasts for a certain period and in this period students are legitimate for multiple access to assessment mode, in receiving
unexpectedly low score from peers, students immediately jump to reduce the previous scores they gave to others.
3. Students often hold the belief that only teacher has the ability and knowledge to evaluate and distribute critical feedback (Zhao, 1998). They may suspect peers’ ability, especially those who get lower score perceive peer assessment as inaccurate.
4. Addressing cultural comparisons among Chinese and Latino Americans, Carson and Nelson (1996) found that in peer review interaction, Chinese-speaking students’ preference for group harmony prevented their critiquing peers’ work.
Some researchers have suggested some arrangements to promote effectiveness of peer assessment. Topping (1998) indicated the necessity of announcing and clarifying goals of peer assessment to promote a trusting environment. Zhao (1998) suggested anonymity is to increase critical feedback and to make the participants
feeling more comfortable to criticize (Zhao, 1998).
3. Resear ch design
3.1 Project wor k requirement
We requested students to survey the related topics of operating systems based on their pre-knowledge. Thus when they write the content of the survey paper, they must focus on extracurricular material and topics of cross-chapter. Finally, Students must include title, motivation, introduction, theory, discussion and reference in their survey.
3.2 Assessment cr iter ia and score of peer assessment
1. Is there a high correlation between content and operating system ? (1 to 10 points)
2. Is content completeness achieved ? (1 to 10 points)
3. Are there sufficient references for this assignment ? (1 to 10 point) 4. Are there enough adequate introductions of theory and background
knowledge for this assignment ? (1 to 10 point)
5. Are there enough discussions of operating systems for this assignment ? (1 to 10 point)
6.
Are the conclusions for this assignment sufficiently robust ? (1 to 10 points) 3.3 Scor ingWe measured student achievement by the following criteria: 20% of the score was referred to their performance in giving comments(feedback quality), 40% on peer assessment(project), and 40% on expert assessment(project).
3.4 Attitude questionnaire
The present study developed a questionnaire with 11 questions on a five-point scale. In the first stage, we wanted to find whether positive and negative attitude factors can be measured accurately and whether most students have a positive attitude toward Web-based peer assessment. This questionnaire(please refer the final questionnaire in the appendix) can then be used for future research about Web-based peer assessment.
4. Results
Descriptive data analysis of attitude questionnaire is listed in Table 3.
---Insert Table 3 here
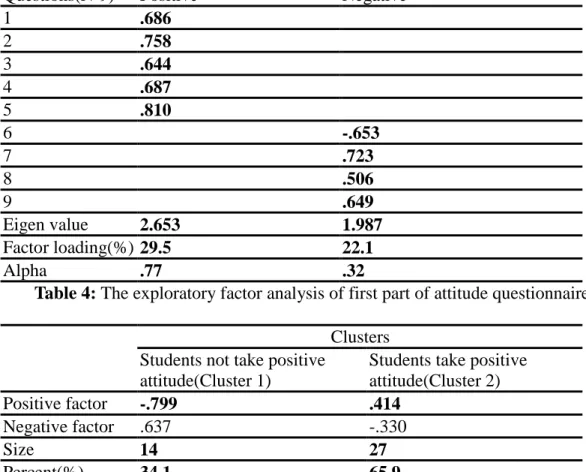
---Using exploratory factor analysis, we found the first part of the attitude questionnaire consisted of two factors. Our purpose is to reduce the unnecessary questions. We therefore deleted two of the eleven questions, according to the magnitude of factor loading. The initial results showed students either take positive or negative attitude toward Web-based peer assessment. The results are listed in Table 4.
---Insert Table 4 here
---Resear ch Question 1: Do the majority of students take a positive attitude toward Web-based peer assessment ?
We conducted a K-Means analysis by using the score of positive and negative factors. The results are shown in Table 5. The cluster analysis grouped 14 students into cluster 1 and 27 students into the cluster 2. According to the maximum value of the factor loading of each cluster, the authors named the cluster 1 as “Students not take positive attitude” and the cluster 2 as “Students take positive attitude”.
---Insert Table 5 here
---A chi square analysis showed that there were more students in the cluster 2(65.9%) who took positive attitude than students who took negative attitude (34.1%, X2
= 4.12, df = 1, p < .05). A t test demonstrated that the first cluster’s total score of positive attitude items is less than second cluster and the first cluster’s total score of negative attitude items is greater than second cluster (Table 6 and 7).
---Insert Table 6 here
---Insert Table 7 here
---The statistical results demonstrated that cluster 2 really contains those students who take positive attitude and cluster 1 really contains those students who take negative attitude.
Resear ch Question 2: Is the achievement of students in cluster 2 better than students in cluster 1 ?
The null hypothesis of this research question is the achievement of students included in cluster 2 worse than students included in cluster 1(Table 8), so we use t test to check this hypothesis. The statistical results(Table 9) rejected the null hypothesis and demonstrated that the achievement of students in cluster 2 is better than those students in cluster 1.
---Insert Table 8 here
---Insert Table 9 here
---The authors further breakdown achievement score into project score and feedback quality. The project score is consisted of scores graded by peers and by experts. The feedback quality graded by experts.
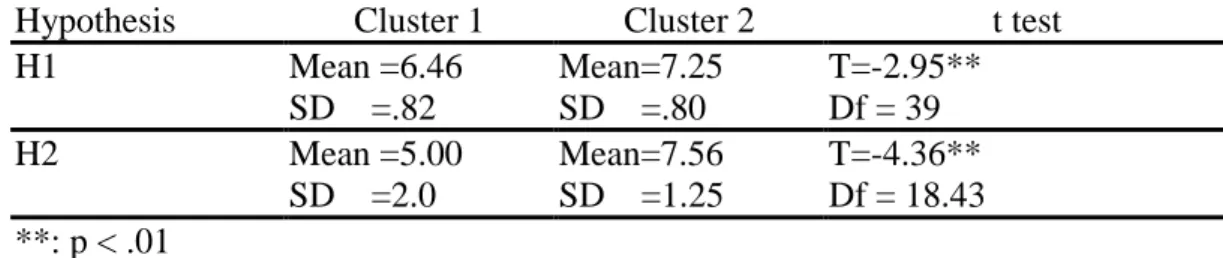
Resear ch Question 3: Is the project score of students included in cluster 2 better than students included in cluster 1 ?
The null hypothesis of this research question is the project score of students included in cluster 2 worse than students included in cluster 1(Table 10), so we use t test to check this hypothesis. The statistical results(Table 11) rejected the null
hypothesis of research question 3 and demonstrated that the project score of students included in cluster 2 is better than those students included in cluster 1.
---Insert Table 10 here
---Insert Table 11 here
---Resear ch Question 4: Is the feedback quality of students included in cluster 2 better than students included in cluster 1 ?
The null hypothesis of this research question is the feedback quality of students included in cluster 2 worse than students included in cluster 1(Table 12), so we use t test to check this hypothesis. The statistical results(Table 13) against the null
hypothesis of research question 4 and demonstrated that the feedback quality of students included in cluster 2 is better than those students included in cluster 1.
---Insert Table 12 here
5. Conclusion, proposition and suggestion
The results showed that most students favored Web-based peer assessment and the affective components would influence the overall performance of students. The students who subjectively like Web-based peer assessment may obtained higher performance than those alike this learning approach, no matter their performance was evaluated by experts or peers, by project achievement or feedback quality. Broadly speaking the results showed wide acceptance of and support for this method of learning.
Finally, we recommend the following measures for individuals interested in implementing Web-based peer assessment:
a) Before designing questions, one should give students the opportunity to discuss related issues. To this end, students should be provided with suitable tools, such as a Web BBS (Liu, Eric Z. F. & Yuan, S. M., 1998) or a Message Board to facilitate discussion. Such discussions may promote student’s positive attitude toward Web-based peer assessment.
b)
Students should be allowed to discuss when grading. We believe that grading is a subjective process. For instance, future studies may adopt a review board in the peer assessment process. Only after full discussion, can a general consensus be reached on how to grade and provide related comments. Thus, grades achieved in this manner will be viewed as fairer and more persuasive.c)
In the future studies, researchers should continue to find out the interactions between students’ performance and attitude.Acknowledgments
The authors would like to thank the National Science Council of the Republic of China under Contract No. NSC89-2520-S-009-004 and NSC89-2520-S-009-001.
References
Bloom, B. S., et al., (Eds.) (1956). Taxonomy of educational objectives: Cognitive domain. New York: David McKay.
Carson, J. G. & Nelson, G. L., (1996). Chinese students’ perceptions of ESL peer response and group interaction. Journal of Second Language Writing, 5, 1-19.
Catterall, M. (1995). Peer learning research in marketing. In S. Griffiths, K. Houston, & A. Lazenblatt (Eds.), Enhancing student learning through peer tutoring in higher education: Section 3-Implementing (Vol. 1, pp. 54-62). Coleraine, Northen Ireland:
University of Ulster.
Chiu, C. H., Wang, W. R., & Yuan, S. M. (1998). Web-based Collaborative Project work Review System. Proceedings of ICCE'98, 2, 474-477.
Dewey, J. (1993). How we think (2nded). Boston: D.C. Heath.
Lazenblatt (Eds.), Enhancing student learning through peer tutoring in higher education: Section 3-Implementing(Vol. 1, pp. 54-62). Coleraine, Northern Ireland:
University of Ulster.
Lin, S. S. J., Liu, E. Z., Chiu, C. H., Yuan, S. M. (1999) Peer review: An effective web-learning strategy with the learner as both adapter and reviewer. (Manuscript submitted for journal review).
Liu, Eric Z. F. & Yuan, S. M. (1998). Collaborative Learning via World Wide Web Bulletin Board System. Proceedings of ICCE’98, 1, 133-140.
Liu, Eric Zhi-Feng, Chiu, Chi-Huang, Lin, Sunny S. J. & Yuan, Shyan-Ming. (1999). Student participation in computer science courses via the Networked Peer Assessment System (NetPeas). Proceedings of the ICCE' 99, vol. 1, pp. 774-777.
Rushton, C., Ramsey, P., & Rada, R. (1993). Peer assessment in a collaborative hypermedia environment: A case-study. Journal of Computer-Based Instruction, 20,
75-80.
Freeman, M. (1995). Peer assessment by groups of group work. Assessment and Evaluation in Higher Education, 20, 289-300.
Hughes, I. E. (1995). Peer assessment. Capability, 1, 39-43.
Korman, M., & Stubblefield, R. L. (1971). Medical school evaluation and internship performance. Journal of Medical Education, 46, 670-673.
Topping, K. (1998). Peer Assessment Between Students in Colleges and Universities.
Review of Educational Research, 68, 249-276.
Vygotsky, L. (1962). Thought and language. Cambridge, MA: MIT Press.
Zhao, Yong. (1998). The Effects of Anonymity on Computer-Mediated Peer Review.
Appendix
Attitude questionnaire
Read each of the following statements, and then rate yourself on a 1-5 scale, where
each rating corresponds to how well a statement describes you: 1 = Not very well; 2 =
Slightly Well; 3 = Somewhat well; 4 = Well; 5 = Very Well.
1. I think Web-based peer assessment could apply to all operating systems project
work.
2. I think Web-based peer assessment is perfectly applied to survey writing.
3. I am more willing to give comments because of the anonymous nature of peer
assessment.
4. Inspecting and learning from the project work of others on the NetPeas, I am
better able to improve my project work.
5. When I comment on the project work of others on the NetPeas, I also think
reflectively and improve my project work.
6. I prefer using criticism as a way of learning.
7. I prefer teacher assessment to peer assessment, because I trust in the teacher's
professional knowledge.(-)
8. I prefer teacher assessment to peer assessment, because I worry about the
standards of peer judgment.(-)
Variable Range of Variation Curriculum area/subject All
Objectives Of staff and/or students?
Time saving or cognitive/affective gains?
Focus Quantitative/summative or qualitative/formative or both ? Product/output Tests/marks/grades or writing or oral presentations or other
skilled behavior ?
Relation to staff assessment Substitutional or supplementary?
Official weight Contributing to assesses final official grade or not ? Directionality One-way, reciprocal, mutual ?
Privacy Anonymous/confidential/public ?
Contact Distant or face to face ?
Year Same or cross year study ?
Ability Same or cross ability ?
Constellation Assessors Individuals or pairs or groups ? Constellation Assessed Individuals or pairs or groups ?
Place In/out of class ?
Time Class time/free time/informally ?
Requirement Compulsory or voluntary for assessors/ees ?
Reward Course credit or other incentives or reinforcement for participation ?
Variable Value Curriculum area/subject Operating Systems
Objectives 1.Compare teacher with student's rating, and we would know the validity of Web-based peer assessment. 2.Promote deeper intellectual skills and attitude.
Focus Quantitative and qualitative.
Product/output Survey of Operating Systems based on current knowledge.
Relation to staff assessment Substitutional.
Official weight Contribute to the assessee's partial grade of Operating Systems Course.
Directionality Mutual.
Privacy Both assessors and assessees are anonymous.
Contact Distance.
Year (sophomore to senior)
Ability Same ability.
Constellation Assessors Groups. Constellation Assessed Groups.
Place Out of class.
Time Informal time.
Requirement Compulsory for assessors/ees
Reward Course credit for participation.
Table 2:A Typology of Web-based Peer Assessment.
VARIABLE VALUE Total 58 Actually Retrieved 41(71%) Missing 17(29%) Male 35(85%) Female 6(15%) Sophomore 12(29%) Junior 25(61%) Senior 4(10%)
Questions(N-9) Positive Negative 1 .686 2 .758 3 .644 4 .687 5 .810 6 -.653 7 .723 8 .506 9 .649 Eigen value 2.653 1.987 Factor loading(%) 29.5 22.1 Alpha .77 .32
Table 4: The exploratory factor analysis of first part of attitude questionnaire. Clusters
Students not take positive attitude(Cluster 1)
Students take positive attitude(Cluster 2)
Positive factor -.799 .414
Negative factor .637 -.330
Size 14 27
Percent(%) 34.1 65.9
Table 5: Results of K-Means cluster analysis H1 H1 = Sum of Positive factorcluster1 < Sum of Positive factorcluster2
H0 = Sum of Positive factorcluster1≥ Sum of Positive factorcluster2.
H2 H1 = Sum of Negative factorcluster2 < Sum of Negative factorcluster1
H0 = Sum of Negative factorcluster2≥ Sum of Negative factorcluster1.
H : the abbreviation of Hypothesis
Table 6: The hypotheses of research question one.
Hypothesis Cluster 1 Cluster 2 t test
H1 Mean =14.71 SD =2.87 Mean=19.04 SD =2.62 T=-4.85** Df = 39 H2 Mean =15.43 SD =1.79 Mean=13.74 SD =1.75 T=2.91** Df = 39 **: p < .01
Table 7: The t test results between cluster 1 and cluster 2 of attitudes. H1 = Student achievementcluster1 < Student achievementcluster2
H0 = Student achievementcluster1≥ Student achievementcluster2
H0: Null Hypothesis
Mean =5.40 SD =.79 Mean=7.13 SD =.83 T=-6.42** Df = 39 **: p < .01
Table 9: The t test results of research question two. H1 H1 = Project Score by Peercluster1 < Project Score by Peercluster2
H0 = Project Score by Peercluster1≥Project Score by Peercluster2.
H2 H1 = Project Score by Expertcluster1 < Project Score by Expertcluster2
H0 = Project Score by Expertcluster1≥Project Score by Expertcluster2
H : the abbreviation of Hypothesis
Table 10: The hypotheses of research question three.
Hypothesis Cluster 1 Cluster 2 t test
H1 Mean =6.46 SD =.82 Mean=7.25 SD =.80 T=-2.95** Df = 39 H2 Mean =5.00 SD =2.0 Mean=7.56 SD =1.25 T=-4.36** Df = 18.43 **: p < .01
Table 11: The t test results of research question three. H1 = Feedback Qualitycluster1 < Feedback Qualitycluster2
H0 = Feedback Qualitycluster1≥Feedback Qualitycluster2
H0: Null Hypothesis
Table 12: The hypotheses of research question four.
Cluster 1 Cluster 2 t test
Mean =3.57 SD =1.65 Mean=5.94 SD =2.46 T=-3.24** Df = 39 **: p < .01