Evaluation of Sediment Management
Strategies for Techi Reservoir in Taiwan
Gregory Morris, Hsiao-Wen Wang, Gong-Chang Yang, Ming-Hsiang Hsu
Abstract
Taiwan has some of the highest sediment yields in the world and correspondingly high reservoir sedimentation rates. Techi reservoir began operating in 1974 in the mountainous central region of Taiwan, regulating flows along the Dajia River for irrigation and municipal use plus a 1000 MW hydropower cascade. However, by 2017 the reservoir’s capacity had been reduced by more than 25% by sedimentation. An effective sediment management plan is needed to achieve sustainable reservoir use. The analysis of sediment management strategies such as sediment bypassing and flushing, require daily information on sediment inflow. However, there are no sediment data for this watershed. This paper describes the method by which a sediment rating relationship for total sediment load was developed for Techi reservoir based on data from reservoir surveys and the time series of daily inflow. It is shown that the rate of reservoir sedimentation is highly sensitive to sediment delivery by intense typhoon events. Application of the rating equation also suggests that a significant change in the relationship between water and sediment discharge has occurred as a consequence of the typhoon.
The results reported here form the basis for subsequent sediment transport modeling for this reservoir, and the methodology is expected to be generally applicable to reservoirs where repeated bathymetric data exist.
Key words: reservoir sedimentation, sediment rating curve, Taiwan.
1 Introduction
Storage reservoirs generate flow regulation benefits in proportion to the usable storage volume, and as this volume is progressively displaced by sedimentation the flow-regulation benefits to irrigation, water supply and hydropower production also diminish. Reservoirs also settle out sediment that would otherwise abrade hydro-mechanical equipment, and once a reservoir becomes sedimented to the point that the delta containing coarse sediment approaches the area of the power intake, it will not even be possible to operate the hydropower plant in a run-of-river mode unless sediment management is undertaken or the project is retrofitted with desilting facilities. These factors make it essential to pro-actively implement sediment management to preserve both water storage capacity and hydropower assets.
The combination of predominately weak sedimentary rock, steep slopes, intense typhoon rainfalls, earthquakes and landslides, make Taiwan’s sediment yield among the highest in the world (Jansson 1988). Erosion and sediment yield in Taiwan is highly concentrated in time, primarily associated with intense storms such as typhoons, discharging 75% of the long-term load on only 1% of the days (Kao and Milliman 2008). Furthermore, with climate change Taiwan is experiencing increasingly intense rainfall events, and when comparing the 1970-1989 period to 1990-2010, sediment yield has increased by >80% (Lee et al. 2015). This indicates that Taiwan’s already-severe problems of reservoir sedimentation can be expected worsen in the future.
Sedimentation as a world-wide problem of increasing importance as reservoirs age, which led Morris and Fan (1998) to predict, “Whereas the twentieth century focused on the
construction of new dams, the twenty-first century will necessarily focus on combating sedimentation to extend the life of existing infrastructure.” This pattern is already being
executed at reservoirs in Taiwan such as Shihmen, Zengwen, and Nanhua, where costly sediment management facilities have already been installed to preserve reservoir capacity. Techi reservoir has lost 25% of its original (1973) capacity to sedimentation, and an effective sediment management plan is needed to extend the life and sustainable use of the reservoir. Both structural and operational modifications will be required at Techi reservoir as well to sustain it in operation in the long run. Because sediment management can be very costly, careful studies of the sedimentation process are required to select management strategies that are optimal in terms of multiple criteria including cost, operational constraints, and environmental impact.
2 Study Area Description
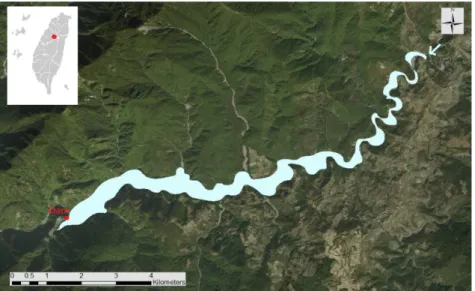
Techi reservoir is located in the upper reaches of Dajia river in central Taiwan. Figure 1 indicates its general location and its elongated geometry. It is owned and operated by Taiwan Power Company, regulating flows for downstream irrigation and municipal water supplies, as well as the 1000+ MW hydropower cascade along the Dajia River comprised of Techi, Chingshan, Guguan, Tienlun, Ma’an, and Shi’gan dams. The catchment area is mountainous with elevations ranging from 1,400 m at the dam up to well over 3,200 m. The rugged topography makes the catchment susceptible to landslides and high sediment yields induced by extreme typhoon rainfalls.
The reservoir had an original volume of 253 Mm3 to regulate an average annual inflow of 893 Mm3 from its 592 km2, producing a Capacity:Inflow ratio of 0.28 for its original volume, and C:I = 0.21 for its 2017 volume of 188 Mm3. The daily inflow time series, computed from daily reservoir operations, is given in Figure 2. Notice that since 2004 large inflows events have been noticeably more frequent.
Figure. 1: Location and configuration of Techi reservoir.
Figure 2: Mean daily inflow into Techi reservoir showing the increased frequency of large inflows (e.g. >750 m3/s) starting in year 2004.
The historical pattern of sedimentation may be seen in Figure 3, showing the advance of the delta into the reservoir. Approximately 60% of the total sediment volume falls in the zone of delta topset and foreset slopes, where coarser material (sand) predominates. The remaining deposits, occupying the bottomset area, consist of silt-size material. Clay is essentially absent in this reservoir.
There are no historical data on the inflowing sediment load. A recently-installed measurement station on the Dajia River upstream of the reservoir does not yet have any data from significant inflow events.
Figure. 3: Longitudinal profile of Techi reservoir grain size distribution at different locations (Sinotech 2018 and this study).
3 Methodology
After reviewing project conditions and the sediment management alternatives available for reservoirs (Morris and Fan 1998), several alternative approaches were identified as potentially useful: (1) sluicing of high-discharge high-load events through the reservoir, (2) sediment bypass, (3) flushing, (4) release of turbidity currents, and (5) dredging. The first four alternatives require data on daily sediment inflow, data which does not exist. Thus, the first part of the analysis focused on constructing a daily time series of sediment inflow.
Techi reservoir has a long record of bathymetric surveys. Also, recent sampling of Sinotech (2018) and this study has documented both the particle size distribution of sediments along the length of the reservoir and dry bulk density. Inflows are available for the entire operating period, computed as a daily water balance based on reservoir operations.
The total sediment inflow for three different periods, as well as the full operational period up to December 2016, was computing volume loss during each period and converting sediment volumes to mass based on the bulk density, and then correcting for trap efficiency using the Brune (1953) method. Three separate periods were used for the sediment volume computations to capture the effect of a 5-year period of high sediment deposition following typhoon Minduelle in July and Aere in August 2004, resulting in the computation of sediment yields for the pre-typhoon, typhoon, and post-typhoon periods.
The sediment discharge during each of these three periods, together with the total sediment discharge for the entire period from 1974 to December 2016, provided four distinct calibration points for developing the rating curve.
A power function rating equation was seeded with initial values, and successive iterations with the “Solver” and “Goal Seek” tools within Micosoft Excel® were used to determine the parameter values for the rating equation that gave the most reasonable representation of sediment inflow over the entire period the reservoir has been operational.
4 Results
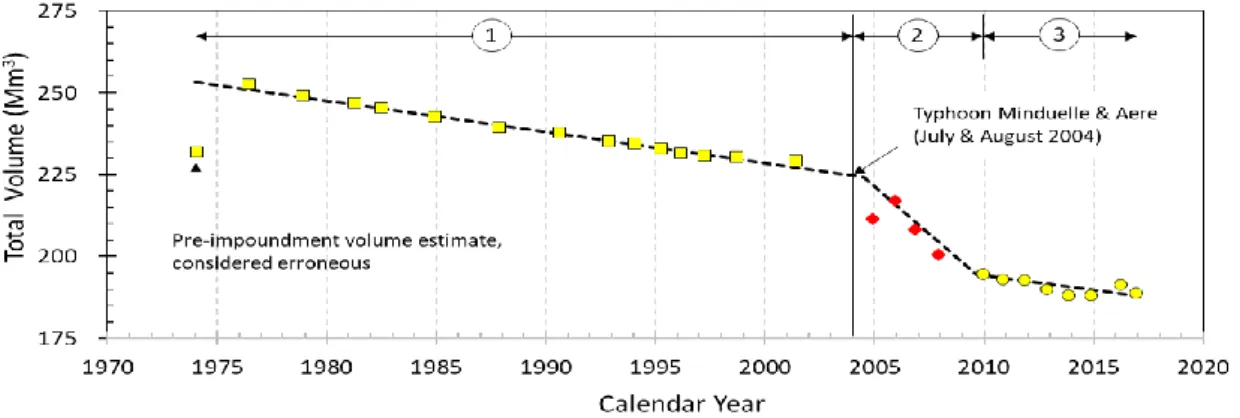
A plot of volume loss vs. time (Figure 4) showed that the rate of sedimentation has not been constant over time. Three distinct periods are numbered in the figure: (1) the initial impounding period of approximately 30 years; (2) a period of about 5 years that begins with the extreme rainfalls and slope failures associated with typhoon Minduelle in July and Aere in August 2004, which produced rapid storage loss; and (3) a return to sediment yields very close to the initial impounding period, continuing to date. Storage loss and annualized rates of sediment yield are summarized for each of these three periods in Table 1. Nearly 5 years post-typhoon were required before the rate of reservoir storage loss and sediment yield to return to pre-typhoon levels. A similar phenomena with 3 years of greatly accelerated sediment yield following an extreme monsoon rainfall was reported at the Kulekhani reservoir near Kathmandu, Nepal, by Sangroula (2005). At that reservoir also the sediment yield again returned to a value very close to the pre-storm sediment yield.
Figure 4: Loss of storage capacity over time in Techi reservoir, indicting three distinct periods of sediment yield.
Based on the daily inflow time series together with the known long term sediment load calculated from the bathymetric data, a sediment rating curve was developed that matched the total sediment yield for the period 1974-2016, calibrating the equation to provide the
best match to the first two periods, as shown in the bottom two rows of Table 1. The resulting rating equation is:
𝐶𝑜𝑛𝑐 = 66.65𝑄0.760 (Eqn.1)
In the rating equation Conc is concentration of total sediment load (mg/l) and Q is discharge (m3/s).
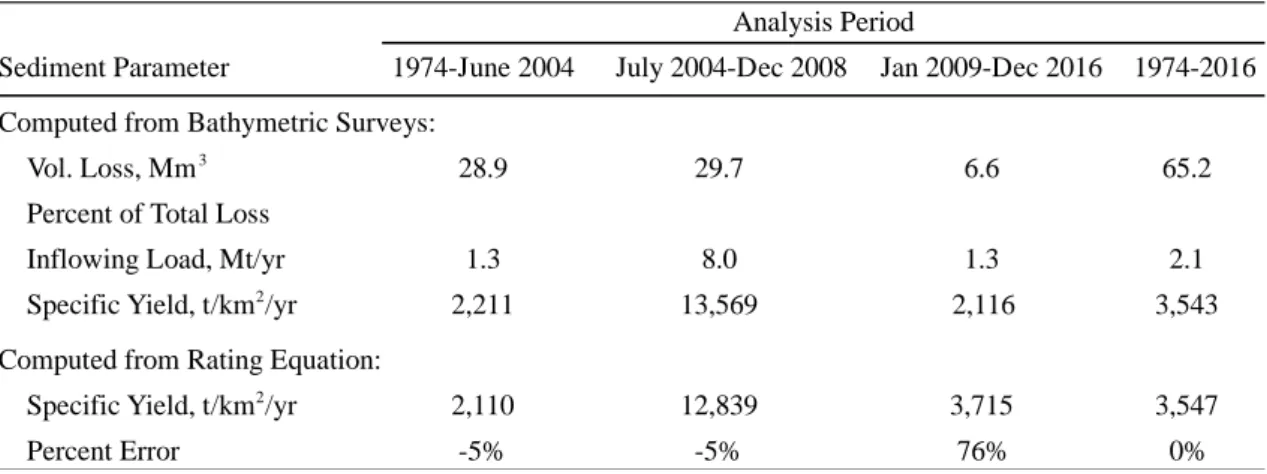
Table 1: Volume Loss and Calculated Sediment Yield During Different Periods at Techi Reservoir.
Equation 1 computes total load, since it is calibrated against the total sediment volume entering the reservoir, as opposed to a suspended sediment equation that is typically developed from suspended sediment data, and which must then be corrected to estimate the unmeasured load.
The error between the average annual specific yield computed from bathymetric data and estimated by the rating equation is given in the bottom row of Table 1. Changing the exponent in Eqn. 1 causes the error for the first two time periods to move in opposite directions. It was decided that the most reasonable compromise was to balance the error in the first two periods (-5% each), while matching exactly the load for the total period of analysis.
That this equation provides a good estimate of the total load for the first periods, while seriously over-estimating the load for the post-2008 period (+76% error), suggests that the sediment discharge characteristics of the watershed have changed. As shown in Table 1, the post-2008 sediment yield is virtually identical to the pre-2008 sediment yield, yet there has been a higher frequency of larger inflow events in the most recent period, as evident from the daily inflow data previously presented in Figure 2. Also, application of this rating equation predicts that 72% of the long term sediment load is discharged in 1% of the days, which is very close to the value of 75% previously cited by Kao and Milliman (2008). At Techi, this 72% of long term sediment was transported by 16% of the total inflow of water.
Sediment Parameter 1974-June 2004 July 2004-Dec 2008 Jan 2009-Dec 2016 1974-2016 Computed from Bathymetric Surveys:
Vol. Loss, Mm3
28.9 29.7 6.6 65.2
Percent of Total Loss
Inflowing Load, Mt/yr 1.3 8.0 1.3 2.1
Specific Yield, t/km2
/yr 2,211 13,569 2,116 3,543
Computed from Rating Equation: Specific Yield, t/km2
/yr 2,110 12,839 3,715 3,547
Percent Error -5% -5% 76% 0%
5 Discussion
This exercise demonstrates a method to construct and verify a sediment rating curve using reservoir bathymetric data, a technique previously applied in Algeria (Tebbi et al. 2012). Sediment yield from the watershed in the pre-typhoon and post-typhoon periods are virtually identical (2211 vs. 2116 t/km2/yr). However, application of the calibrated rating curve shows that post-typhoon sediment-yield conditions in the watershed are, in fact, quite different from the pre-typhoon condition. This may be due to exhaustion of the available sediment supply or some other supply limitation, because the discharge time series indicates that transport capacity has increased.
Should this rating curve be used for future reservoir modeling, or should a separate rating curve be developed covering the post-typhoon period in which sediment yield appears to be supply constrained? We suggest use of the equation developed here for all modeling. Not only is this a more conservative approach, but it also protects against the eventuality that pre-typhoon conditions will eventually return to this watershed.
The loss of reservoir capacity may reduce post-typhoon trap efficiency. Reduced trap efficiency would result in less sediment capture, giving the appearance of reduced sediment inflow. However, this effect is anticipated to be very small, and insufficient to explain the observed discrepancy in the post-typhoon period. This and other aspects of reservoir behavior will be examined by long-term sediment transport modeling using the SRH-1D model (U.S. Bureau of Reclamation 2018), work which is already underway. Dredging is a costly, long-duration sediment management technique that can be executed with very limited information on sediment inflow and depositional processes (Wang et al. 2018). However, sediment bypassing, sluicing, and flushing are all time-focused techniques that require a more detailed understanding of sediment inflow processes to develop cost-effective design and operational criteria. These latter techniques are often preferred to dredging because typically, but not always, they are lower cost. Even in instances where dredging is required, use of these time-focused management techniques can diminish the amount of sediment that needs to be removed by dredging.
Evaluation of multiple management options is currently underway employing the sediment transport model to better document the effectiveness and operating rules associated with time-focused sediment management techniques. The World Bank’s RESCON2 model (Efthymiou et al. 2017; Palmieri et al. 2003) is being used to provide a preliminary screening of the relative merit and time-discounted economic cost of alternative management measures.
The work reported here has developed a calibrated rating curve that can be used to exercise sediment transport models at Techi. It also demonstrates a methodology considered to have widespread applicability at other reservoirs, both in Taiwan and elsewhere.
References
Brune, G. M. (1953). “Trap Efficiency of Reservoirs.” Trans. American Geophysical Union, 34(3), 407– 418.
Efthymiou, N., Palt, S., Annandale, G. W., and Karki, P. (2017). Rapid Assessment Tool for Sustainable Sediment Management (RESCON2): User Manual. World Bank, Washington, D.C.
Jansson, M. B. (1988). “A Global Survey of Sediment Yield.” Geografiska Annaler. Series A, Physical Geography, 70(1/2), 81.
Kao, S. J., and Milliman, J. D. (2008). “Water and Sediment Discharge from Small Mountainous Rivers, Taiwan: The Roles of Lithology, Episodic Events, and Human Activities.” The Journal of Geology, 116(5), 431–448.
Lee, T.-Y., Huang, J.-C., Lee, J.-Y., Jien, S.-H., Zehetner, F., and Kao, S.-J. (2015). “Magnified Sediment Export of Small Mountainous Rivers in Taiwan: Chain Reactions from Increased Rainfall Intensity under Global Warming.” PLOS ONE, (C.-L. Lee, ed.), 10(9), e0138283.
Morris, G. L., and Fan, J. (1998). Reservoir Sedimentation Handbook. McGraw-Hill Book Co., New York. Palmieri, A., Shah, F., Annandale, G., and Dinar, A. (2003). Reservoir Conservation: The RESCON
Approach. World Bank Report, Washington, D.C.
Sangroula, D. P. (2005). Sedimentation and Sustainability of the Kulekhani Reservoir: A Himalayan Case. Norwegian Univ. of Science & Technology, Trondheim, Norway, 283.
Sinotech Eng. Consultants Ltd. (2018). Study on the turbid flow transport and the operation of sedimentation reduction for Techi Reservoir (I).
Tebbi, F. Z., Dridi, H., and Morris, G. L. (2012). “Optimization of cumulative trapped sediment curve for an arid zone reservoir: Foum El Kherza (Biskra, Algeria).” Hydrological Sciences, 57(7), 1368– 1377.
U.S. Bureau of Reclamation. (2018). User’s Manual for SRH-1D V4.0: Sedimentation and River Hydraulics – One Dimension, Version 4.0. Denver Technical Service Center, Denver, CO.
Wang, H. W., Kondolf, G. M., Tullos, D., Kuo, W. C. (2018). “Sediment Management in Taiwan's Reservoirs and Barriers to Implementation.” Water, 10(8), 1034.
Authors
Gregory Morris Hsiao-Wen Wang Ming-Hsiang Hsu Gong-Chang Yang
Department of Hydraulic and Ocean Engineering, National Cheng Kung University (NCKU), Taiwan