Microstructure and surface characteristics of hydroxyapatite coating on titanium and
Ti-30Nb-1Fe-1Hf alloy by anodic oxidation and hydrothermal treatment
Shih-Fu Ou
a, Chao-Sung Lin
b, Yung-Ning Pan
a,⁎
a
Department of Mechanical Engineering, National Taiwan University, Taipei, 106 Taiwan
bDepartment of Materials Science and Engineering, National Taiwan University, Taipei, 106 Taiwan
a b s t r a c t
a r t i c l e i n f o
Article history: Received 30 March 2010
Accepted in revised form 27 October 2010 Available online 3 November 2010 Keywords:
Anodic oxidation Hydrothermal treatment Ti-Nb alloy
Hydroxyapatite
Anodic oxidation together with hydrothermal treatment has been performed to modify the surface morphology and chemistry of commercial pure titanium (c. p. Ti) and Ti-30Nb-1Fe-1Hf (Ti-Nb) alloy for implant applications. After 6 h of hydrothermal treatment at 250 °C,fine columnar hydroxyapatite (HA) crystals formed on the anodic oxidationfilm (AOF) of the Ti-Nb plate, whereas coarse columnar HA crystals were observed on the AOF of the c. p. Ti plate. To understand the mechanism of HA formation, the microstructure of the AOF was investigated by cross-sectional TEM. The AOF consisted of three layers, in which the outmost layer comprised nano-crystalline particles dispersed in amorphous oxide matrix. The intermediate layer contained irregular pores, meanwhile the inner barrier layer contacting the substrate was dotted with micro-pores. The amount of Ca and P and the Ca/P ratio decreased gradually from the outer layer to the inner layer of the AOF regardless of the Ti substrate. Nevertheless, the AOF on Ti-Nb had a worse crystallinity than that on c. p. Ti. And, more importantly, this amorphous structure was found to be beneficial for the nucleation of HA crystals during hydrothermal treatment.
© 2010 Elsevier B.V. All rights reserved.
1. Introduction
β-type titanium alloys, which possess the lowest Young's modulus among the various Ti alloys, have been proposed to be ideal for biomedical applications[1,2]. The low Young's modulus Ti alloys are expected to reduce the unbalanced stresses resulting from stiffness mismatch between human bone and metal implant, namely, stress shielding effect.β-Ti can be stabilized by the addition of niobium, molybdenum, and vanadium. Recently, many studies have focused on the biocompatibility and corrosion resistance of titanium alloys with niobium[3,4]. A new titanium alloy with low Young's modulus, Ti-30Nb-1Fe-1Hf, has also been developed[5].
Surface modification is generally essential to improve the chemical bonding between Ti implant and bone tissues. Up to now, several techniques have been explored to coat a bioactive material, such as hydroxyapatite (HA), on Ti alloys. Among them, plasma spray HA is the most acceptable method and extensively used clinically [6,7]. However, this HA layer has weak adhesion to the implant and plasma spray, a high temperature process, has difficulty in controlling the composition and crystallinity of the HA layer[8]. Recently, another approach has been developed to form a highly crystalline HA coating on Ti by anodic oxidation and hydrothermal method[9,10]. Ishizawa et al. demonstrated that a thin HA layer formed by anodizing and
hydrothermal treatment displayed an osteoconduction comparable to that of the plasma sprayed HA, but showed a different bone response
[11].
Anodic oxidation is usually operated in galvanostatic conditions, i.e. afixed current density through the whole process; accordingly, the voltage increases spontaneously as the oxide film grows with continued anodic oxidation. When the potential arises to a critical voltage, dielectric breakdown occurs and a succession of discharging appears on the oxidefilm. Many studies have shown that the degree of crystallinity of the AOF formed after dielectric breakdown is poor
[12,13]. However, less study discussed as how the crystallinity of the AOF affects HA precipitation during hydrothermal treatment. In addition, the mechanism of HA formation on the AOF during hydrothermal treatment is still not clear. The present study aims at characterizing the microstructure of AOF on Ti-Nb alloy and detailing the formation mechanism of HA during hydrothermal treatment. In addition, the characteristics of AOF and HA formed on Ti-Nb alloy are compared with those on c. p. Ti.
2. Materials and Methods 2.1. Anodic oxidation
Two kinds of Ti alloys were used for this study, including commercial pure titanium (c. p. Ti) and Ti-30Nb-1Fe-1Hf (Ti-Nb) developed in our laboratory. Coupons (10 × 10 × 1 mm) were abraded with silicon carbide paper up to grade 800, cleansed with acetone for Surface & Coatings Technology 205 (2011) 2899–2906
⁎ Corresponding author.
E-mail address:[email protected](Y.-N. Pan).
0257-8972/$– see front matter © 2010 Elsevier B.V. All rights reserved. doi:10.1016/j.surfcoat.2010.10.063
Contents lists available atScienceDirect
Surface & Coatings Technology
5 min, followed by ethanol for 3 min in an ultrasonic bath, andfinally dried at room temperature. The electrolyte for anodization treatment was prepared by mixing 0.2 M calcium acetate (CA) with 0.04 M β-glycerophosphate disodium (β-GP) and stirred using a magnetic stirrer at 25 °C in de-ionized water. The pH of the electrolyte was around 7.8 and precipitation was not observed prior to anodizing. The coupon was galvanostatically anodized at a constant current density of 50 mA/cm2up to a specific voltage using a direct current power
supply (GWinstek GPR-30H10D, Taiwan). Threefinal voltages, 100 V, 200 V and 300 V, had been chosen. After anodizing, the coupon was cleansed with distilled water and dried at room temperature. 2.2. Hydrothermal treatment
The anodized Ti plate was hydrothermally treated at 250 °C for 6 h in an autoclave (volume: 53.6 ml) containing 26.8 ml solution whose pH was adjusted to 13.0 by the addition of NaOH. After hydrothermal treatment, the coupon was cleansed with distilled water and dried in a stream of room temperature air.
2.3. Microstructural characterization
The surface morphology of AOF before and after hydrothermal treatment was observed using a scanning electron microscope (SEM). The crystallinity and phases of AOF were identified via glancing angle X-ray diffraction using a Kαradiation with an incidence angle of 1°
and at a scanning speed of 2°/min. The microstructure of AOF and HA layer was studied by cross-sectional transmission electron microsco-py (TEM) and energy dispersive spectrometry (EDS) equipped in TEM. The composition of AOF was analyzed by an electron probe X-ray microanalyzer (EPMA).
2.4. Adhesion test
The adhesive strength of the AOF anodized to various voltages was carried out according to ASTM-C633-01 standard [14] by using a tensile test machine (CHUN YEN; Model: CY-6040A4) at a constant cross-head speed of 1.2 mm/min with 1.5 kg initial force. Each sample consisted of two plates anodized to a specific voltage, which were bounded using epoxy glue (LIONBOND EA2000N). The overlapped area of the two plates was 20 × 10 mm2. The sample was cured at
150 °C for 45 min. The adhesive strength of the anodized was reported as the average of 5 adhesion test samples.
3. Results
3.1. Anodic oxidation 3.1.1. Potential-time responses
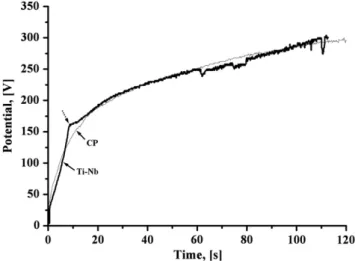
In an anodizing process, the solution was electrolyzed, resulting in oxygen bubbles on the surface of the anode[15]. Under a constant current, the applied potential raised gradually due to the formation of an oxidefilm on the Ti plate, as shown inFig. 1. When the potential increased to a critical voltage, sparking occurred; meanwhile, the slope of the potential vs. time curve decreased gradually. The turning point corresponding to slope change was marked by the dashed arrow inFig. 1. Then, sparks were observed to shift rapidly across the surface of the Ti plate, a characteristic of dielectric breakdown of the oxide film. With continued anodizing, micro-arcing with larger power appeared and was accompanied by slight voltage oscillations. The potential response of Ti-Nb was similar to that of c. p. Ti. However, the slope of Ti-Nb anodizing curve before sparking was slightly larger than that of c. p. Ti anodizing curve. In addition, the voltage oscillation was more obvious for Ti-Nb than that for c. p. Ti. These different characteristics of the potential response are likely to result from the
composition of the oxidefilm, i.e, titanium oxide and niobium oxide on Ti-Nb[16]and titanium oxide on c. p. Ti.
3.1.2. Surface morphology evolution
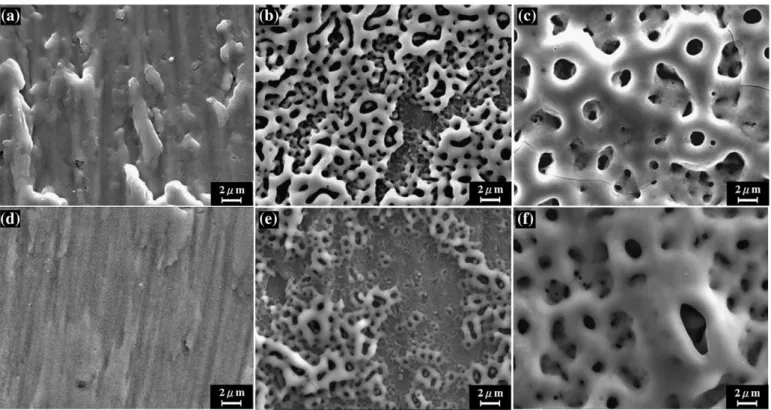
SEM micrographs show that the surface morphology evolution of c. p. Ti and Ti-Nb during anodization was similar, as shown inFig. 2. As the Ti plate (Ti-Nb and c. p. Ti) was anodized to 100 V, scratches formed during mechanical grounding remained on the surface, as shown inFig. 2(a) and (d). In contrast, a striking change in surface morphology was observed as the potential was further increased to 200 V, i.e., several irregular craters resulted from sparking were observed (Fig. 2(b, e)). Furthermore, the areas dotted with craters were markedly larger than those without craters in Ti-Nb, but it was not apparent in c. p. Ti. With continued anodizing to 300 V, the surface was completely covered with craters of 1 ~ 2μm in diameter (Fig. 2(c, f)). Since the potential response of c. p. Ti resembled that of Ti-Nb (Fig. 1), the surface morpho-logy evolution of c. p. Ti was similar to that of Ti-Nb. Nevertheless, the population density of craters on the Ti-Nb anodized to 200 V was larger than that on the c. p. Ti anodized to 200 V. The morphology differences between Ti-Nb and c. p. Ti at 200 V may be explained by the different potential response (before 200 V) under constant current anodization (Fig. 1).
3.1.3. Microstructure and composition of the AOF
XRD shows that Ti-Nb consisted ofα-Ti and β-Ti phases and the AOF was mainly composed of anatase TiO2, as shown inFig. 3(a). The
decrease in the intensity of the peaks from the substrate with continued anodizing indicated that the oxidefilm thickened during anodizing. In particular, the AOF on Ti-Nb transformed to a meta-amorphous structure after 200 V, as shown by the broadened peaks in
Fig. 3(a). In contrast, on c. p. Ti, the intensity of peaks associated with anatase TiO2 increased with increasing voltages (Fig. 3(b)).
Conse-quently, the AOF on the c. p. Ti comprised more crystalline anatase TiO2than that on Ti-Nb.
During anodic oxidation, the AOF was melt down and alloyed with the species in the electrolyte; therefore, it can be expected that the AOF contained various oxides and Ca-P compounds. Based on the EPMA measurement, the change in the content of Ca and P with applied potentials was shown inFig. 4(a). As expected, the content of Ca and P in AOF as well as Ca/P ratio increased with increasing potentials, as shown inFig. 4(b).
When observed cross-sectionally under TEM, the AOF on Ti-Nb anodized to 300 V can be divided into three layers (Fig. 5). From EDS analysis, the content of Ca and P in the areas marked as 1, 2, 3 inFig. 5
was 10.1 at% Ca and 9.0 at% P, 5.3 at% Ca and 4.3 at% P, as well as 1.1 at%
Fig. 1. Potential as a function of the anodizing time during galvanostatic anodizing. 2900 S.-F. Ou et al. / Surface & Coatings Technology 205 (2011) 2899–2906
Ca and 3.5 at% P, respectively. The content of Ca and P decreased gradually from the outer layer to the inner layer of AOF.
Fig. 6(a) shows that the inner layer contacting the substrate contained pores with sizes ranging from 50 nm to 200 nm. This layer formed before dielectric breakdown, i.e., the barrier layer commonly seen in the literature. Habazaki et al. have also observed the oxygen bubbles in the AOF on Ti and Ti alloy[17].Fig. 6(b) shows that the outermost layer was a mixture of amorphous and crystalline phases, in which the crystalline phase was the minor phase and dispersed in the amorphous matrix. Selected-area electron diffraction (SAED)
pattern taken from the region marked as 1 consisted of diffuse halos (Fig. 6(c)), suggesting that this region had an amorphous structure. In contrast, the SAED pattern taken from the region marked as 2 comprised discrete diffraction rings, suggesting that this region was crystalline anatase TiO2, as identified by the interplanar spacing of the
diffraction rings (Fig. 6(d)). More importantly, the amount of Ca and P contained in the amorphous region (11.5 at% Ca, 5.6 at% P) significantly differed from that in the crystalline region (8.6 at% Ca, 6.9 at% P). EDS analyses made on several amorphous and crystalline regions showed that the amorphous region indeed contained more Ca
Fig. 2. Surface morphologies of the AOF: (a), (b) and (c): anodizing Ti-Nb to 100 V, 200 V and 300 V, respectively. (d), (e) and (f): anodizing c. p. Ti to 100 V, 200 V and 300 V, respectively.
Fig. 3. XRD patterns of the AOF on (a)Ti-Nb and (b)c. p. Ti.
2901 S.-F. Ou et al. / Surface & Coatings Technology 205 (2011) 2899–2906
(titania, niobia, and Ca-P compounds), whereas that on c. p. Ti consists of titania and Ca-P compounds. A mixture of oxides can promote the formation of the amorphous oxide film that forms during plasma electrolytic reaction and subsequently rapidly solidifies in the electrolyte. This is commonly seen in glass, which is generally composed of silica as the main component and the glass former such as sodium carbonate, calcium oxide, magnesium oxide and aluminum oxide. A XRD-amorphous s oxide layer was also observed on the AOF of Ti–24Nb–4Zr–7.9Sn [13] and Ti-6Al-4 V alloy [28]
anodized to a relatively high voltages; however, TEM characterization was not seen in these studies. It is concluded that not only the composition of the electrolyte but elements of substrate affected the crystalline of AOF.
4.4. The mechanism of hydrothermal treatment
The HA precipitation is generally governed by nucleation and growth. During hydrothermal treatment, the hydroxyl anions (OH-)
absorb on the AOF of Ti-Nb, suggesting Ti-OH and Nb-OH act as the nucleation sites of the HA. The functional groups (Ti-OH[29,30], Nb-OH[31]) are effective in inducing the heterogeneous nucleation of calcium phosphate. Consequently, the pH of the water solution used in the hydrothermal treatment significantly influences the quantity and shape of HA and the result was reported in our previous study
[16]. Accompanying the growth of HA, the AOF supplies Ca and P continuously. Hence, the content of Ca and P within the intermediate and outer layers of AOF decreases obviously after hydrothermal treatment (Table 1) which is consistent with results made by Ishizawa et al[10]. In contrast, the inner layer contains more Ca and P after hydrothermal treatment. It is because the Ca and P here do not participate the HA precipitation process. Moreover, some Ca and P in the intermediate layer migrate toward the oxide/ substrate interface due to the concentration gradient, resulting in the increase in the contain of Ca and P of the inner layer.
In addition to the formation of HA crystals, the hydrothermal treatment provids a defect-healing effect via crystallization of the AOF (Fig. 10(b)), and may improve the adhesive strength of the AOF. The experimental evidence is shown inFig. 7. However, even the large craters are reduced, vein-like defects form as Ca and P diffused to the surface and the amorphous AOF crystallizes. These defects may be detrimental to the corrosion resistance of the Ti-Nb substrate. 4.5. The effect of AOF structure on HA precipitation
According to previous studies, the amount of HA precipitates is greatly influenced by applying potential. It is because applied the higher potential efficiently induces more Ca and P incorporated in the AOF. In this study, since the AOF of Ti-Nb and c. p. Ti is prepared the same potential (300 V), as shown inFig. 4(a). How-ever, after hydrothermal treatment more HA was precipitated on the AOF of Ti-Nb than on that of c. p. Ti. It can be attributed to the marked difference in the crystallinity of the AOF between these two substrates. The diffusion rate of Ca and P in the AOF greatly affects the nucleation and growth of HA crystals. The amorphous structure of AOF on Ti-Nb provides a fast path for Ca and P diffusion. In contrast, the diffusion of the Ca and P in the AOF on c. p. Ti is slower because the AOF on c. p. Ti contains more crystalline phases than the AOF on Ti-Nb. Consequently, hydrothermal treatment results in fewer and coarser HA crystals on the c. p. Ti anodized to the same voltage as Ti-Nb.
5. Conclusions
The anodizing behavior of Ti-30Nb-1Fe-1Hf alloy in a solution composed of CA andβ-GP was similar to that of c. p. Ti. The AOF on both substrates was identified as a porous oxide film comprising three layers. The outermost layer consisted of amorphous and crystalline phases where the content of Ca in the amorphous region was larger than that in the crystalline region. The inner layer contained several pores. Irregular pores formed as a result of sparking were found to reside in the intermediate layer. Meanwhile, the outmost layer contained open voids, i.e., craters seen from the surface of AOF. As for the composition, the AOF of Ti-Nb and c. p. Ti contained a similar content of Ca and P, and the content of Ca and P was increased with increasing applied potentials. By contrast, the crystallinity of the AOF on Ti-Nb decreased with increasing anodizing potentials after dielectric breakdown, but that on c. p. Ti increased with increasing anodizing potentials. After 250°C hydrothermal treatment for 6 h in pH13 solution, numerous thin columnar HA crystals precipitated on the AOF of Ti-Nb anodized to 300 V. In contrast, the same hydrothermal treatment resulted in fewer and coarser columnar HA crystals on c. p. Ti. Therefore, the amount of Ca and P as well as the amorphous structure of AOF were essential for the formation of HA crystals during hydrothermal treatment. Finally, Nb in Ti-Nb promot-ed the formation of the amorphous phases in AOF, which, in turn, enhances the nucleation of HA crystals during hydrothermal treatment.
References
[1] Mitsuo Niinomi, Sci. Technol. Adv. Mater. 4 (2003) 445.
[2] E.B. Taddei, V.A.R. Henriques, C.R.M. Silva, C.A.A. Cairo, Mater. Sci. Eng. C 24 (2004) 683.
[3] R. Godley, D. Starosvetsky, I. Gotman, J. Mater. Sci. Mater. Med. 17 (2006) 63. [4] D. Velten, E. Eisenbarth, N. Schanne, J. Breme, J. Mater. Sci. Mater. Med. 15 (2004)
457.
[5] Y.H. Hon, J.Y. Wang, Y.N. Pan, Mater. Trans. 45 (2004) 2449.
[6] A.J. Yee, H.K. Kreder, I. Bookman, J.R. Davey, Clin. Orthop. 366 (1999) 120. [7] S.A. McNally, J.A. Shepperd, C.V. Mann, J.P. Walczak, J. Bone. Joint. Surg. Br. 82
(2000) 378.
[8] K.A. Gross, C.C. Berndt, J. Mater. Sci. Mater. Med. 5 (1994) 219. [9] H. Ishizawa, M. Ogino, J. Biomed. Mater. Res. 29 (1995) 65. [10] H. Ishizawa, M. Ogino, J. Biomed. Mater. Res. 29 (1995) 1071. [11] H. Ishizawa, M. Fujino, M. Ogino, J. Biomed. Mater. Res. 29 (1995) 1459. [12] X. Zhu, K.H. Kim, Y. Jeong, Biomaterials 22 (2001) 2199.
[13] X.J. Tao, S.J. Li, C.Y. Zheng, J. Fu, Z. Guo, Y.L. Hao, R. Yang, Z.X. Guo, Sci. Eng. C 29 (2009) 1923.
[14] Standard Test Method for Adhesion or Cohesion Strength of Thermal Spray Coatings, ASTM Standard C 633-01, ASTM, West Conshocken, PA, USA, 2001. [15] I.A. Ammar, I. Kamal, Electrochim. Acta. 16 (1971) 1539.
[16] S.F. Ou, C.S. Lin, Y.N. Pan, Mater. Sci. Eng. C 29 (2009) 2346.
[17] H. Habazaki, M. Uozumi, H. Konno, K. Shimizu, P. Skeldon, G.E. Thompson, Corros. Sci. 45 (2003) 2063.
[18] C.S. Lin, M.T. Chen, J.H. Liu, J. Biomed. Mater. Res. A 85 (2007) 378. [19] V.M. Frauchiger, F. Schlottig, B. Gasser, M. Textor, Biomaterials 25 (2004) 593. [20] H. Ishizawa, M. Ogino, J. Mater. Sci. 34 (1999) 5893.
[21] S. Ikonopisov, Electrochim. Acta 22 (10) (1977) 1077.
[22] J. Monterro, M. Fernandez, J.M. Albella, Electrochim. Acta. 32 (1) (1987) 171. [23] A.L. Yerokhin, X. Nie, A. Leyland, A. Matthews, S.J. Dowey, Surf. Coat. Technol. 122
(1999) 73.
[24] L.H. Li, Y.M. Kong, H.W. Kim, Y.W. Kim, H.E. Kim, S.J. Heo, J.Y. Koak, Biomaterials 25 (2004) 2867.
[25] I.S. Park, T.G. Woo, M.H. Lee, S.G. Ahn, M.S. Park, T.S. Bae, K.W. Seol, Metals and Materials International 12 (6) (2006) 505.
[26] Y. Wang, B. Jiang, T. Lei, L. Guo, Mater. Let. 58 (2004) 1907. [27] Y. Wang, T. Lei, B. Jiang, L. Guo, Appl. Surf. Sci. 233 (2004) 258.
[28] F. Liu, F. Wang, T. Shimizu, K. Igarashi, L. Zhao, Surf. Coat. Technol. 199 (2005) 220. [29] H.M. Kim, F. Miyaji, T. Kokubo, S. Nishiguchi, T. Nakamura, J. Biomed. Mater. Res.
45 (1999) 100.
[30] H.M. Kim, H. Takadama, T. Kokubo, S. Nishiguchi, T. Nakamura, Biomaterials 21 (2000) 353.
[31] T. Kokubo, H.M. Kim, M. Kawashita, T. Nakamura, Z Kardiol 90 (2001) 86. 2906 S.-F. Ou et al. / Surface & Coatings Technology 205 (2011) 2899–2906