ORIGINAL ARTICLE
Function
Normal Systolic and Diastolic Functions
of the Left Ventricle and Left Atrium
by Cine Magnetic Resonance Imaging
Wen-Yih Isaac Tseng,
1Ta-Yu Liao,
2and Jaw-Lin Wang
2,*
1
Department of Medical Imaging, Center for Optoelectronic Biomedicine, and 2Institute of Biomedical Engineering, National Taiwan University Medical College, Taipei, Taiwan
ABSTRACT
Volume and phase characteristics of the left ventricle (LV) and left atrium (LA) were assessed in 31 healthy Asian adults (19 males and 12 females) using cine magnetic resonance imaging (MRI) and an automated boundary detection algorithm. Volume indexes of the LV and LA were smaller than published results obtained mostly from Westerners. Other than LV mass index and percent emptying of the LA, there was no gender difference in all LV/LA indexes. In associating LV/LA functions with the body size and heart rate (HR), we found that LV mass and the minimum LA volume correlated strongly with the body surface area, the maximum LA volume and the reservoir volume correlated strongly with the body weight, and the time to LV peak-filling rate (LVPFRt) and the time to LA peak-emptying rate (LAPERt) correlated strongly with the HR. In associating LV with LA functions, we found that LA conduit volume contributed more than 50% of the LV stroke volume, and correlated with both systolic and diastolic functions of the LV. Moreover, LVPFRt and LAPERt were virtually identical, indicating a mechanical coupling between LV and LA during diastole. In conclusion, using time-resolved, three-dimensional volume data obtained from cine MRI, we have established normative values of LV and LA functions and their functional relationships in healthy Asian adults. The imaging acquisition protocol, data analysis algorithms, and the established normative values provide the basis for the study of left heart function in patients.
443
DOI: 10.1081/JCMR-120016383 1097-6647 (Print); 1532-429X (Online)
Copyright q 2002 by Marcel Dekker, Inc. www.dekker.com
*Corresponding author. Jaw-Ling Wang, Institute of Biomedical Engineering, National Taiwan University Medical College, 1 Jen-Ai Road, Sec. 1, Taipei 10016, Taiwan. Fax: þ 886-2-23940049; E-mail: jlwang@ccms.ntu.edu.tw
JOURNAL OF CARDIOVASCULAR MAGNETIC RESONANCEw
Key Words: Cine MRI; Left ventricle; Left atrium; Cardiac function
INTRODUCTION
Left heart function of a patient with cardiac disease is important for disease stratification and treatment planning.[1,2] Recent advances in magnetic resonance imaging (MRI) provide a noninvasive method to assess functional status of the left ventricle (LV) and left atrium (LA).[3 – 13] In addition to the absence of radiation hazards, three-dimensional volumes of the LV and LA can be acquired directly with MRI, without resorting to any geometric assumption.[14,15]Cine MRI, by using fast gradient echo sequences and cardiac gating techniques, is able to provide movies of cardiac motion showing distinct contrast between the myocardium and the blood, and is considered an ideal tool for assessing cardiac functions. The validity and reproducibility of cine MRI in quantifying cardiac volumes have been established in both ex vivo and in vivo studies.[16 – 29]To date, cine MRI has been used as a gold standard for validating new techniques such as three-dimensional echocardiography, three-dimensional SPECT, or other cine MRI using faster sequences.[30 – 32]
Although cine MRI is potentially useful in assessing left heart function, its routine use in clinical setting has been hampered by long post-processing time. To obtain volume – time curves of the LV and LA and from which to calculate volume and phase parameters, short-axis slices in 15 consecutive levels and at temporal resolution of at least 30 msec are typically required. Approximately 350 – 450 images must be analyzed to determine endocardial contours either manually or with commercially available algorithms. Both methods would take 20 – 30 min per level, amounting to 5 – 7 hr to finish a case.
Recently, we have developed a robust edge detection algorithm capable of analyzing the entire image data in 30 min, greatly facilitating systematic studies on systolic and diastolic functions of the left heart by cine MRI.[33] Therefore, the goal of this paper is to establish normative values of LV and LA functions and their functional relationships in healthy subjects.
MATERIALS AND METHODS Study Population
Thirty-one healthy subjects with no history of cardiac disease were studied (19 males and 12 females). The age
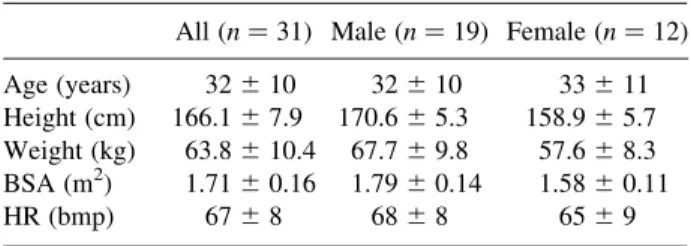
ranged from 21 to 58 years, mean ^ SD ¼ 32 ^ 10 years: Basic information about the study population including age, body height (BH), body weight (BW), body surface area (BSA), and heart rate (HR) was summarized in Table 1. All gave informed consent before MRI examination.
Image Acquisition
The study was performed in a 1.5 T MRI system (Magnetom Vision, Siemens, Nuremberg, Germany). A 4-channel phased array torso coil was used to minimize spatial dependence of the signal intensity.
We determined short-axis view for cine MRI as follows: based on tri-planar scout images, axial images of the LV were acquired with a breath-hold fast gradient echo sequence. From axial images, images in vertical long-axis view with the same breath-hold technique were acquired by paralleling the slice plane with the interventricular septum. A plane perpendicular to vertical long-axis view, and containing LV apex and the center of the mitral valves was defined to produce horizontal long-axis view (Fig. 1a). Short-axis view was then determined with the slice planes perpendicular to horizontal long-axis plane and the LV axis (Fig. 1b).
Cine MRI was acquired with prospective electro-cardiographic (ECG) R-wave trigger. The pulse sequence used a two-dimensional gradient echo tech-nique with TR/TE/flip angles ¼ 30 msec/7 msec/308. Contiguous short-axis slices were prescribed from the LA top to the LV apex with slice thickness of 10 mm. To avoid cross talks between adjacent excitation pulses, two levels separated by a half of the range of coverage were scanned per acquisition. A total of approximately 12 – 14 short-axis slices were obtained depending on the cardiac size. Setting temporal resolution at 30 msec, the total
Table 1 Study Population
All ðn ¼ 31Þ Male ðn ¼ 19Þ Female ðn ¼ 12Þ Age (years) 32 ^ 10 32 ^ 10 33 ^ 11 Height (cm) 166.1 ^ 7.9 170.6 ^ 5.3 158.9 ^ 5.7 Weight (kg) 63.8 ^ 10.4 67.7 ^ 9.8 57.6 ^ 8.3 BSA (m2) 1.71 ^ 0.16 1.79 ^ 0.14 1.58 ^ 0.11
number of cardiac phases was determined as 90% of R – R interval divided by 30 msec. In-plane resolution of 1.2 mm was obtained with field-of-view (FOV) of 30 cm and a matrix size of 128 £ 256 interpolated to 256 £ 256: The total scanning time was about 40 min yielding cine MRI data set of 12 – 14 cardiac levels, and 25 – 30 cardiac phases for each level. Heart rate was recorded at the beginning, middle, and end of the examination.
Image Analysis
Detailed procedures of the edge detection method were described previously.[33]In short, a user-interface graphics program for boundary detection was developed based on a gray-level auto-contouring algorithm provided by MATLAB 5.2 (Mathworks, Inc., Natick, MA, USA). Loose iso-contours were generated at an increment of 10 in signal intensity (Fig. 2a). Two adjacent iso-contours closest to the interface between myocardial wall and chamber cavity were chosen. Between these two contours, dense iso-contours were generated at an increment of one in signal intensity (Fig. 2b). The iso-contour closest to the wall – cavity interface was then chosen as the boundary (Fig. 2c). Boundaries of LA and LV were determined by a trained operator (TYL) and double-checked with a certified radiologist (WYT). The coordinates for the points on the boundaries were determined, and the area enclosed by each boundary was computed. The LV and LA volumes were then determined by Simpson’s rule, namely the sum of the areas of the corresponding levels multiplied by the slice
thickness: LV or LA volume ¼ X n i¼1 Ai ! d ð1Þ
where n is the number of slices covering the LV or LA, Ai
is the area enclosed by the boundary at ith level, and d is the slice thickness.
Approximately 90% of the boundaries determined in this way showed satisfactory results. Manual correction was performed for the remaining 10% that failed to delineate the entire wall – cavity boundary. This occurred at end systole when the blood signal was indistinguish-able from the myocardial signal. In this study, papillary muscles and pulmonary veins were excluded from the LV and LA volumes. At the junction of LV and LA, LV outflow tract and LA appendage were identified and included in the volumetry.
To determine LV mass, epicardial contours of the LV at end diastole were detected with the same algorithm. The auto-contouring algorithm usually cannot give satisfac-tory results in these regions, and should be corrected manually. The whole analysis was done interactively with a home-made graphics-user interface. The time required to process the entire data set was about 30 min.
Parameters of LV and LA Function
To obtain LV functional parameters, end-diastolic volume (LVEDV) and end-systolic volume (LVESV) were read-off directly from the volume – time curves for Figure 1. Determination of short-axis view in cine MRI. (a) From an image in vertical long-axis view, a line connecting LV apex and center of the mitral orifice was determined to define the imaging plane in horizontal long-axis view. (b) From horizontal long-axis view, a plane perpendicular to the imaging plane and orientation of the interventricular septum was determined for short-axis view. Cine MRI in short-axis view at multiple levels encompassing the LV and LA was then performed. Multiple parallel segments shown in (a) and (b) are short-axis planes intersecting with the vertical long-axis plane and horizontal long-axis plane, respectively.
the maximal and minimal values, respectively (Fig. 3a). The LV stroke volume (LVSV), cardiac output (CO), and ejection fraction (EF) were computed subsequently. Left ventricular mass (LVM) was computed as the difference between LV epicardial volume at end diastole and LVEDV, multiplied by the density 1.05.
Similarly, LA volumes were determined from the LA volume – time curves. As shown in Fig. 4a, two peaks (point B at late systole and point D at late diastole) and two valleys (point A at end diastole and point C at mid
diastole) were read-off from the volume – time curves. Six relevant values, i.e., cyclic volume change (CC), mid-diastolic expansion (ME), reservoir volume (RV), LA stroke volume (LASV), LA percent emptying (PE), and conduit volume (CV) were computed according to Ja¨rvinen et al.[11]
To obtain rate of change in volumes, time derivatives were computed from the B-spline curves that were fitted to the volume – time data of LV or LA (Figs. 3b and 4b).[34] The maximum and minimum values were Figure 2. A user-interactive graphics program for determining LV and LA boundaries. (a) Loose iso-contours at an increment of 10 in signal intensity were generated first. Two adjacent contours close to the boundary between myocardial wall and chamber cavity were chosen. (b) Dense iso-contours at an increment of 1 in signal intensity were plotted. (c) Among these contours, an iso-contour (indicated as dark line) that is closest to the wall – cavity interface was chosen as the boundary.
Figure 3. Time course of LV volume index (a) and rate of change in LV volume index (b). From the time curve of LV volume index, the stroke volume (LVSV), cardiac output (CO), and ejection fraction (EF) were determined: LVSV ¼ LVEDV 2 LVESV; CO ¼ LVSV £ HR; EF ¼ ðLVSV=LVEDVÞ £ 100%:
identified from time-derivative curves as the peak-filling rate (PFR) and the peak-emptying rate (PER) of LV or LA. The times to PFR (PFRt) and to PER (PERt) were also determined from the curves, and were normalized to R – R interval of individual subject to minimize HR dependence.
Interobserver, Intraobserver, and Interscan Agreement
We assessed the variability between different observers, between different analyses by the same observer and between different MR measurements. Interobserver agreement was studied by comparing pairs of results in 10 subjects analyzed by two observers. Two observers were blind to the results of the other’s. Intraobserver agreement was studied by comparing pairs of results from the repeated analyses by the same observer. Two analyses were 3 – 6 months apart. Inter-scan agreement was studied on five volunteers by repeating MRI examinations 2 months apart.
Agreement with Manual Tracing and Phantom Study
We investigated the agreement between our edge detection method and manual tracing by comparing pairs of results in five subjects analyzed by the two methods. To evaluate the accuracy of our method, beakers of varying diameters filled with water were scanned using the same MRI pulse sequence and edge detection algorithm. The areas of cross-sections measured by MRI
were compared to the actual areas measured with a high-precision planimeter.
Statistical Analysis
All values were presented as mean ^ SD: Two-tailed Student’s t-test was used to evaluate the gender difference. A p-value of less than 0.05 was considered statistically significant. A statistical software Minitab R13 (Minitab Inc., State College, PA, USA) was used to find the regression of LA and LV parameters with BW, BH, BSA, HR, and gender. The “best subsets” routine was first used to find the primary and secondary factors that best correlated to the LA and LV parameters. LA and LV parameters obtaining high correlation coefficient ðr2. 0:3Þ with single or dual predictors were best fitted and the corresponding coefficients were determined. The association between LA and LV functions was evaluated by the Pearson’s correlation coefficient. The agreement analysis used the Bland – Altman method.[35]
RESULTS Time Course of LV/LA Volume and Rate of Volume Change
The patterns of volume – time curves of the LV and LA and the corresponding time-derivative curves were consistent among all subjects. The volume – time curve of the LV started with a monotonous descent during systole and ended at the nadir (Fig. 3). The diastole started with a mild volume increase possibly corresponding to early Figure 4. Time course of LA volume index (a) and rate of change in LA volume index (b). From the time curve, six relevant values, i.e., CC, ME, RV, LASV, PE, and CV were determined: CC ¼ B 2 A; ME ¼ D 2 C; RV ¼ B 2 C; LASV ¼ D 2 A; PE ¼ 100 £ CC=B; CV ¼ LVSV 2 RV 2 LASV:
relaxation. A steep ascent followed during rapid filling, and a period of constant volume representing diastasis. The diastole sometimes ended with a second ascent due to atrial kick. The time-derivative curve showed one single negative peak at mid-systole and one large positive peak at early diastole. Two smaller positive peaks corresponding to early relaxation and atrial kick were occasionally found.
The volume – time curve of the LA usually presented two peaks and two valleys that mark the transition of different hemodynamic events (Fig. 4). The first peak occurred at end systole. The second peak occurred at late diastole right before the start of atrial kick. The first valley occurred at end diastole right before the beginning of systole, and the second valley occurred at mid diastole close to the end of LV rapid filling. The time-derivative curve showed a moderate positive peak of LA filling. In the emptying phase, there was one distinct negative peak during rapid filling and another less distinct peak during atrial kick.
LV and LA Functions
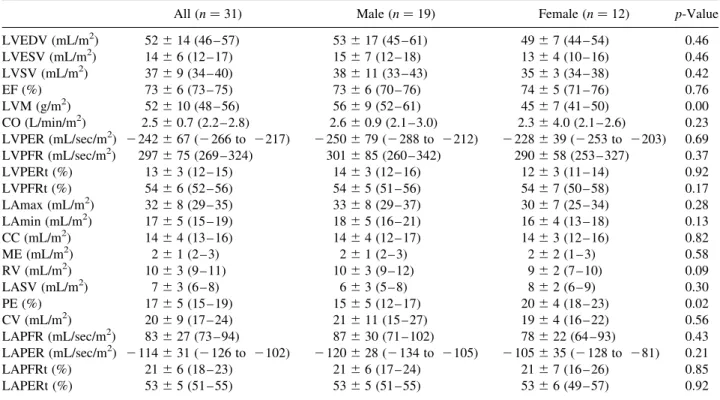
Parameters of LV and LA functions for the entire group of 31 subjects, and for males and females separately, are shown in Table 2. The same parameters that are normalized to BSA are shown in Table 3. In LV function, the end diastolic to end systolic volume ratio was approximately 3.5, yielding approximately 73% EF. The peak-filling rate was larger than the peak-emptying rate by approximately 22%. In LA function, the conduit volume comprised 55% of the LVSV, larger than the reservoir volume of 27%, and LA stroke volume of 19%. In contrast to LV function, the LAPFR was smaller than the LAPER. The time to LVPER was earlier than the time to LAPFR. However, the times to LVPFR and to LAPER were virtually identical.
Significant difference between males and females was found in LVM, LAmin, RV, PE, and LAPER. However, when the parameters were normalized to BSA, significant difference was only found in LVM and PE. Table 2
LV and LA Volume and Time Parameters (Mean ^ SD) and 95% Confidence Intervals in Parentheses
All ðn ¼ 31Þ Male ðn ¼ 19Þ Female ðn ¼ 12Þ p-Value
LVEDV (mL) 88 ^ 27 (78 – 98) 95 ^ 31 (80 – 110) 78 ^ 13 (69 – 86) 0.08 LVESV (mL) 25 ^ 11 (20 – 29) 27 ^ 13 (21 – 33) 21 ^ 8 (16 – 26) 0.17 LVSV (mL) 64 ^ 16 (58 – 70) 68 ^ 19 (59 – 77) 57 ^ 6 (53 – 60) 0.06 EF (%) 73 ^ 6 (73 – 75) 73 ^ 6 (70 – 76) 74 ^ 5 (71 – 76) 0.76 LVM (g) 90 ^ 23 (81 – 98) 101 ^ 20 (91 – 111) 72 ^ 15 (62 – 81) 0.00 CO (L/min) 4.3 ^ 1.4 (3.8 – 4.8) 4.7 ^ 1.6 (3.9 – 5.5) 3.7 ^ 6.2 (3.3 – 4.1) 0.05 LVPER (mL/sec) 2 413 ^ 123 (2 458 to 2368) 2 447 ^ 140 (2 514 to 2379) 2 360 ^ 62 (2 399 to 2321) 0.05 LVPFR (mL/sec) 506 ^ 136 (456 – 556) 538 ^ 154 (464 – 612) 457 ^ 87 (402 – 512) 0.11 LVPERt (%) 13 ^ 3 (12 – 15) 14 ^ 3 (12 – 16) 12 ^ 3 (11 – 14) 0.92 LVPFRt (%) 54 ^ 6 (52 – 56) 54 ^ 5 (51 – 56) 54 ^ 7 (50 – 58) 0.17 LAmax (mL) 55 ^ 15 (49 – 61) 59 ^ 15 (51 – 67) 48 ^ 14 (39 – 57) 0.05 LAmin (mL) 30 ^ 10 (26 – 34) 33 ^ 10 (28 – 38) 25 ^ 8 (20 – 30) 0.03 CC (mL) 25 ^ 7 (22 – 27) 26 ^ 8 (22 – 30) 23 ^ 6 (18 – 27) 0.26 ME (mL) 4 ^ 2 (3 – 5) 4 ^ 2 (3 – 5) 3 ^ 3 (2 – 5) 0.35 RV (mL) 17 ^ 5 (15 – 19) 19 ^ 5 (16 – 21) 14 ^ 4 (11 – 17) 0.01 LASV (mL) 12 ^ 5 (10 – 13) 11 ^ 5 (9 – 14) 12 ^ 4 (9 – 15) 0.74 PE (%) 28 ^ 7 (25 – 31) 26 ^ 7 (22 – 30) 32 ^ 5 (29 – 36) 0.02 CV (mL) 35 ^ 161 (29 – 41) 38 ^ 20 (28 – 48) 30 ^ 6 (26 – 34) 0.22 LAPFR (mL/sec) 143 ^ 50 (124 – 163) 155 ^ 53 (128 – 182) 126 ^ 41 (99 – 153) 0.13 LAPER (mL/sec) 2 196 ^ 60 (2 219 to 2173) 2 215 ^ 51 (2 241 to 2188) 2 168 ^ 63 (2 210 to 2126) 0.04 LAPFRt (%) 21 ^ 6 (18 – 23) 21 ^ 6 (17 – 24) 21 ^ 7 (16 – 26) 0.85 LAPERt (%) 53 ^ 5 (51 – 55) 53 ^ 5 (51 – 55) 53 ^ 6 (49 – 57) 0.93
Dependence on Body Index, Heart Rate, and Gender
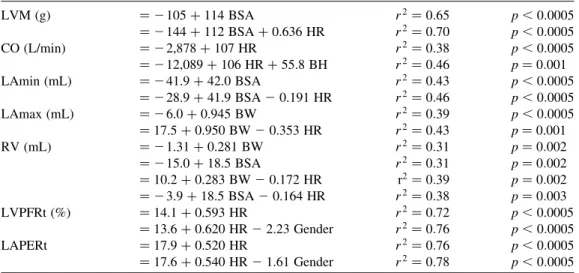
Using the “best subsets” routine, seven LV/LA parameters (LVM, CO, LAmin, LAmax, RV, LVPFRt, LAPERt) were linearly related to at least one variable among body size, HR, and gender. As shown in Table 4, CO, LVPFRt, and LAPERt were best predicted by HR. LVM and LAmin were best predicted by BSA. LAmax was best predicted by BW. RV was predicted equally by BSA and BW.
If two factors were considered, there was no exception that the HR was one of the factors. The other factor was BSA for LVM, LAmin, and RV. It was BH for CO, BW for LAmax and RV, and gender for LVPFRt and LAPERt.
Relationship Between LV and LA Functions
The conduit volume showed moderate to strong association with most of the systolic and diastolic functions including LVEDV, LVESV, LVSV, CO, LVPER, and LVPFR (Table 5). Strong association was
found between the time to the LVPFR and the time to the LAPER ðr2¼ 0:87; p ¼ 0:00Þ:
Results of Agreement Analysis
Table 6 shows interobserver, intraobserver, and interscan agreement, as well as the agreement between the edge detection method and the manual tracing, and the agreement between MR measurement and planime-try. The SD of differences in all comparisons ranged from 0.99 to 8.70% of the analyzed volumes, indicating reasonable reliability of the present methods.
DISCUSSION
In this study, we used cine MRI to establish normative values of LV and LA functions in healthy Asian adults and to characterize functional relationships between LV and LA. In associating LV/LA functions with the body size and HR, we found that LVM and LAmin correlated strongly with the BSA, LAmax and the reservoir volume correlated strongly with the BW, and both LVPFRt and LAPERt correlated strongly with the HR. In associating Table 3
LV and LA Volume Index and Time Parameters (Mean ^ SD) and 95% Confidence Intervals in Parentheses
All ðn ¼ 31Þ Male ðn ¼ 19Þ Female ðn ¼ 12Þ p-Value
LVEDV (mL/m2) 52 ^ 14 (46 – 57) 53 ^ 17 (45 – 61) 49 ^ 7 (44 – 54) 0.46 LVESV (mL/m2) 14 ^ 6 (12 – 17) 15 ^ 7 (12 – 18) 13 ^ 4 (10 – 16) 0.46 LVSV (mL/m2) 37 ^ 9 (34 – 40) 38 ^ 11 (33 – 43) 35 ^ 3 (34 – 38) 0.42 EF (%) 73 ^ 6 (73 – 75) 73 ^ 6 (70 – 76) 74 ^ 5 (71 – 76) 0.76 LVM (g/m2) 52 ^ 10 (48 – 56) 56 ^ 9 (52 – 61) 45 ^ 7 (41 – 50) 0.00 CO (L/min/m2) 2.5 ^ 0.7 (2.2 – 2.8) 2.6 ^ 0.9 (2.1 – 3.0) 2.3 ^ 4.0 (2.1 – 2.6) 0.23 LVPER (mL/sec/m2) 2 242 ^ 67 (2 266 to 2217) 2 250 ^ 79 (2 288 to 2212) 2 228 ^ 39 (2 253 to 2203) 0.69 LVPFR (mL/sec/m2) 297 ^ 75 (269 – 324) 301 ^ 85 (260 – 342) 290 ^ 58 (253 – 327) 0.37 LVPERt (%) 13 ^ 3 (12 – 15) 14 ^ 3 (12 – 16) 12 ^ 3 (11 – 14) 0.92 LVPFRt (%) 54 ^ 6 (52 – 56) 54 ^ 5 (51 – 56) 54 ^ 7 (50 – 58) 0.17 LAmax (mL/m2) 32 ^ 8 (29 – 35) 33 ^ 8 (29 – 37) 30 ^ 7 (25 – 34) 0.28 LAmin (mL/m2) 17 ^ 5 (15 – 19) 18 ^ 5 (16 – 21) 16 ^ 4 (13 – 18) 0.13 CC (mL/m2) 14 ^ 4 (13 – 16) 14 ^ 4 (12 – 17) 14 ^ 3 (12 – 16) 0.82 ME (mL/m2) 2 ^ 1 (2 – 3) 2 ^ 1 (2 – 3) 2 ^ 2 (1 – 3) 0.58 RV (mL/m2) 10 ^ 3 (9 – 11) 10 ^ 3 (9 – 12) 9 ^ 2 (7 – 10) 0.09 LASV (mL/m2) 7 ^ 3 (6 – 8) 6 ^ 3 (5 – 8) 8 ^ 2 (6 – 9) 0.30 PE (%) 17 ^ 5 (15 – 19) 15 ^ 5 (12 – 17) 20 ^ 4 (18 – 23) 0.02 CV (mL/m2) 20 ^ 9 (17 – 24) 21 ^ 11 (15 – 27) 19 ^ 4 (16 – 22) 0.56 LAPFR (mL/sec/m2) 83 ^ 27 (73 – 94) 87 ^ 30 (71 – 102) 78 ^ 22 (64 – 93) 0.43 LAPER (mL/sec/m2) 2 114 ^ 31 (2 126 to 2102) 2 120 ^ 28 (2 134 to 2105) 2 105 ^ 35 (2 128 to 281) 0.21 LAPFRt (%) 21 ^ 6 (18 – 23) 21 ^ 6 (17 – 24) 21 ^ 7 (16 – 26) 0.85 LAPERt (%) 53 ^ 5 (51 – 55) 53 ^ 5 (51 – 55) 53 ^ 6 (49 – 57) 0.92
LV with LA functions, we found that LA conduit volume contributed more than 50% of LVSV, and correlated strongly with both systolic and diastolic functions of the LV. Moreover, LVPFRt and LAPERt were virtually identical, indicating a close coupling between LV and LA during diastole.
Previous Reports on LV/A Functions Assessed with Cine MRI
Table 7 shows previous reports on LV parameters assessed with cine MRI and our results for comparison. With the exception of the EF, the values in the current study are smaller than the published values. The discrepancy exists even when the values are normalized to BSA. The difference ranges from 10 to 50% in absolute values, and 10 – 30% in normalized values.
Smaller values in our results may be partly due to smaller body size of the study population. As shown in Table 1, the mean BH, BW, and BSA in the current study are 166:13 ^ 7:87 cm; 64:18 ^ 10:11 kg, and 1:71 ^ 0:16 m2; respectively, substantially smaller than those in previous studies performed on Westerners (see BSA in Table 7). The length of LV long axis in the listed studies is about 9 cm, whereas it is about 8 cm in our study. The difference in length leads to approximately 30% reduction in volume, largely accounting for the observed difference.
Another reason for the smaller values in our study may be related to the criteria used for defining
endocardial border. In contrast to previous studies, we excluded papillary muscles and trabeculae from the definition of chamber cavity. Geest et al. showed that the difference in defining endocardial borders resulted in approximately 10% difference in chamber volumes.[8]
To assess the reproducibility of our methods, we analyzed the agreement of LV volumes between two separate MR measurements in five subjects. The agreement was 20:23 ^ 5:21 mL (or ^ 7.10%), indicat-ing reasonable reproducibility of our methods (Table 6). Smaller values in our study imply that racial difference may exist, and so the normative values of a particular ethnic group might not be applicable to a different group.
Gender Difference
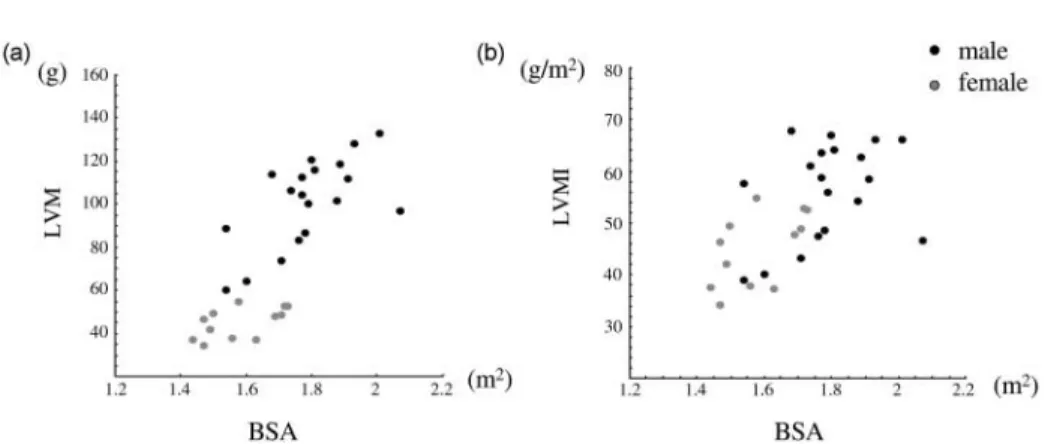
In LV parameters, we found that the difference between males and females was significant in LVM only. The difference in LVM still existed after normalization to BSA (Fig. 5). In contrast, Lorenz et al. found significant gender difference in all absolute and normalized LV parameters such as LVEDV, LVESV, LVSV, and LVM except EF.[9]However, Sanstede et al. later found that though there were significant differences in LVEDV, LVESV, and LVM, normalization to BSA eliminated the differences in LVEDV and LVESV.[10] These findings indicate that LVM is the parameter consistently showing gender difference despite normali-zation to the body indexes.
Table 4
Linear Regression Between LV/LA Functions and Body Size, Heart Rate, and Gender
LVM (g) ¼ 2 105 þ 114 BSA r2¼ 0:65 p , 0:0005 ¼ 2 144 þ 112 BSA þ 0.636 HR r2¼ 0:70 p , 0:0005 CO (L/min) ¼ 2 2,878 þ 107 HR r2¼ 0:38 p , 0:0005 ¼ 2 12,089 þ 106 HR þ 55.8 BH r2¼ 0:46 p ¼ 0:001 LAmin (mL) ¼ 2 41.9 þ 42.0 BSA r2¼ 0:43 p , 0:0005 ¼ 2 28.9 þ 41.9 BSA 2 0.191 HR r2¼ 0:46 p , 0:0005 LAmax (mL) ¼ 2 6.0 þ 0.945 BW r2¼ 0:39 p , 0:0005 ¼ 17.5 þ 0.950 BW 2 0.353 HR r2¼ 0:43 p ¼ 0.001 RV (mL) ¼ 2 1.31 þ 0.281 BW r2¼ 0:31 p ¼ 0:002 ¼ 2 15.0 þ 18.5 BSA r2¼ 0:31 p ¼ 0:002 ¼ 10.2 þ 0.283 BW 2 0.172 HR r2¼ 0:39 p ¼ 0:002 ¼ 2 3.9 þ 18.5 BSA 2 0.164 HR r2¼ 0:38 p ¼ 0:003 LVPFRt (%) ¼ 14.1 þ 0.593 HR r2¼ 0:72 p , 0.0005 ¼ 13.6 þ 0.620 HR 2 2.23 Gender r2¼ 0:76 p , 0:0005 LAPERt ¼ 17.9 þ 0.520 HR r2¼ 0:76 p , 0:0005 ¼ 17.6 þ 0.540 HR 2 1.61 Gender r2¼ 0:78 p , 0:0005
Table 5
Correlation Coefficient (r2) Between LV and LA Functions
LVEDV LVESV LVSV EF LVM CO LVPER LVPFR LVPERt LVPFRt
LAmax 0.12 ( p ¼ 0.07) 0.10 ( p ¼ 0.10) 0.12 ( p ¼ 0.07) 0.08 ( p ¼ 0.16) 0.38 ( p ¼ 0.00)* 0.04 ( p ¼ 0.34) 0.07 ( p ¼ 0.17) 0.03 ( p ¼ 0.38) 0.02 ( p ¼ 0.52) 0.00 ( p ¼ 0.83) LAmin 0.17 ( p ¼ 0.03) 0.17 ( p ¼ 0.03) 0.14 ( p ¼ 0.05) 0.16 ( p ¼ 0.03) 0.43 ( p ¼ 0.00)* 0.05 ( p ¼ 0.24) 0.09 ( p ¼ 0.13) 0.04 ( p ¼ 0.28) 0.02 ( p ¼ 0.49) 0.00 ( p ¼ 0.80) CC 0.03 ( p ¼ 0.35) 0.01 ( p ¼ 0.57) 0.05 ( p ¼ 0.26) 0.00 ( p ¼ 0.83) 0.18 ( p ¼ 0.03) 0.01 ( p ¼ 0.66) 0.03 ( p ¼ 0.41) 0.01 ( p ¼ 0.67) 0.01 ( p ¼ 0.66) 0.00 ( p ¼ 0.92) ME 0.04 ( p ¼ 0.28) 0.07 ( p ¼ 0.18) 0.03 ( p ¼ 0.42) 0.07 ( p ¼ 0.18) 0.03 ( p ¼ 0.41) 0.00 ( p ¼ 0.95) 0.00 ( p ¼ 0.79) 0.01 ( p ¼ 0.69) 0.01 ( p ¼ 0.63) 0.14 ( p ¼ 0.05) RV 0.14 ( p ¼ 0.05) 0.12 ( p ¼ 0.07) 0.14 ( p ¼ 0.05) 0.06 ( p ¼ 0.20) 0.33 ( p ¼ 0.00)* 0.03 ( p ¼ 0.37) 0.07 ( p ¼ 0.17) 0.07 ( p ¼ 0.19) 0.00 ( p ¼ 0.94) 0.06 ( p ¼ 0.22) LASV 0.00 ( p ¼ 0.92) 0.01 ( p ¼ 0.71) 0.00 ( p ¼ 0.93) 0.01 ( p ¼ 0.67) 0.01 ( p ¼ 0.60) 0.00 ( p ¼ 0.74) 0.00 ( p ¼ 0.94) 0.01 ( p ¼ 0.57) 0.01 ( p ¼ 0.71) 0.00 ( p ¼ 0.81) PE 0.18 ( p ¼ 0.02) 0.24 ( p ¼ 0.01) 0.12 ( p ¼ 0.07) 0.24 ( p ¼ 0.01) 0.30 ( p ¼ 0.00)* 0.11 ( p ¼ 0.08) 0.09 ( p ¼ 0.11) 0.10 ( p ¼ 0.11) 0.04 ( p ¼ 0.33) 0.00 ( p ¼ 0.90) CV 0.75 ( p ¼ 0.00)* 0.57 ( p ¼ 0.00)* 0.78 ( p ¼ 0.00)* 0.19 ( p ¼ 0.02) 0.18 ( p ¼ 0.02) 0.77 ( p ¼ 0.00)* 0.73 ( p ¼ 0.00)* 0.58 ( p ¼ 0.00)* 0.00 ( p ¼ 0.78) 0.05 ( p ¼ 0.24) LAPFR 0.04 ( p ¼ 0.30) 0.03 ( p ¼ 0.39) 0.05 ( p ¼ 0.28) 0.02 ( p ¼ 0.53) 0.18 ( p ¼ 0.03) 0.00 ( p ¼ 0.78) 0.02 ( p ¼ 0.44) 0.03 ( p ¼ 0.36) 0.01 ( p ¼ 0.59) 0.01 ( p ¼ 0.60) LAPER 0.22 ( p ¼ 0.01) 0.24 ( p ¼ 0.01) 0.18 ( p ¼ 0.02) 0.18 ( p ¼ 0.02) 0.34 ( p ¼ 0.00)* 0.06 ( p ¼ 0.21) 0.11 ( p ¼ 0.08) 0.14 ( p ¼ 0.05) 0.03 ( p ¼ 0.40) 0.07 ( p ¼ 0.18) LAPFRt 0.13 ( p ¼ 0.06) 0.11 ( p ¼ 0.09) 0.12 ( p ¼ 0.07) 0.10 ( p ¼ 0.09) 0.06 ( p ¼ 0.20) 0.07 ( p ¼ 0.17) 0.10 ( p ¼ 0.10) 0.05 ( p ¼ 0.27) 0.03 ( p ¼ 0.38) 0.02 ( p ¼ 0.47) LAPERt 0.06 ( p ¼ 0.21) 0.04 ( p ¼ 0.28) 0.06 ( p ¼ 0.19) 0.02 ( p ¼ 0.47) 0.12 ( p ¼ 0.07) 0.31 ( p ¼ 0.00)* 0.17 ( p ¼ 0.03) 0.00 ( p ¼ 0.80) 0.07 ( p ¼ 0.16) 0.87 ( p ¼ 0.00)* Note: The asterisk (*) indicates a p-value smaller than 0.005.
Normal Systolic and Diastolic Functions of the LV and LA 451
In LA parameters, we found significant gender difference in LAmin, RV, PE, and LAPERt. After normalizing to BSA, only percent emptying showed significant difference. As shown in Table 2, LAmax in males is larger than that in females ð p ¼ 0:05Þ; however, cyclic change is comparable in both genders ð p ¼ 0:26Þ: This leads to larger PE in females than in males ð p ¼ 0:02Þ:
Association of LV/LA Functions Vs. Body Indexes, Heart Rate, and Gender
Four volume parameters, i.e., LVM, LAmax, LAmin, and RV, showed high association with BW and BSA. Even after normalization to BSA, high association of LVM index and moderate association of LA volumes with BW and BSA still existed (Fig. 6). Because both LVM and LA volumes were associated with BW and BSA, high association between LVM and LA volumes was also found (r2¼ 0:38 between LVM and LAmax, r2¼ 0:43 between LVM and LAmin; see Table 5). Mineoi et al. reported that LA chamber indexes, i.e., LAmax/BSA and LAmin/BSA, and LVM index was greater in hypertensive patients with LV hypertrophy than in hypertensive patients without LV hypertrophy and in normal subjects.[13] They also found that LVM index correlated strongly with LA chamber indexes. Our study supports close relation between LVM and LA volumes, but reminds that LVM index and LA volume indexes still show moderate correlation with BW and BSA. Therefore, if these indexes are to be compared between patients and control groups, comparable BW and BSA are required.
In analysis of the best subset of dual predictors, we found that the body size was always the primary factor for volume parameters (LVM, LAmin, LAmax, and RV), and the HR was the secondary factor. On the other hand,
the HR was the primary factor for phase parameters (LVPFRt, LAPERt), and the gender was the secondary factor. As for CO, the product of volume and time, the primary and secondary factors were the HR and BH, respectively.
It is interesting to know that in all cases the HR is always one of the influential factors, either primary or secondary, and that the HR affects LVM and CO positively, and affects LAmin, LAmax, and RV negatively (Table 4). Our results are consistent with the report of Ja¨vinen et al. who documented negative correlation between the HR and LA’s maximum and minimum volumes.[11] To our knowledge, positive correlation of the HR with LVM has not been reported yet. The reproducibility of our methods in measuring LVM was assessed in five subjects. The SD of difference in LVM between two different scans was 6.3 g, substantially smaller than the SD of LVM among all subjects (23 g). Our results imply that if LVM is to be used for comparison between patient and control groups, similar HR or appropriate normalization procedure is required.
Heart rate was found to be associated with the time to LVPFRt and the time to LAPERt (Table 4). In fact, all the times including these two times were normalized to R – R intervals of individual subjects in order to eliminate HR dependence. The dependence of LVPFRt and LAPERt on the HR indicates that the duration of early diastole is more sensitive to the HR than other parts of the cardiac cycle. Moreover, we found that these two times actually coincided. The coincidence of LVPFRt and LAPERt might reflect close mechanical coupling between LV and LA during normal rapid filling. This comes about by having creating negative pressure gradient through the mitral valves during elastic recoil of the LV in early relaxation, followed by suction of the blood from LA and pulmonary veins to the LV.[36] Table 6
Results of Agreement Analysis
Variability Mean Difference (mL) 95% Limits of Agreement (mL) SD (mL) SD (%) Interobserver 1.74 2 8.62 to 12.11 5.18 8.70 Intraobserver 0.44 2 3.00 to 3.87 1.72 2.91 Interscan 2 0.23 2 10.65 to 10.19 5.21 7.10 MR vs. planimetry 0.46 2 0.10 to 1.01 0.28 0.99
Automated vs. manual tracing 0.25 2 3.54 to 4.04 1.89 3.23 Note: SD(%) was calculated by SD/(the mean of the analyzed volumesÞ £100%:
Table 7
Previous Reports on LV Parameters in Comparison
BSA LVEDV LVESV LVSV EF LVM CO
Refs. N (m2) (mL) (mL/m2) (mL) (mL/m2) (mL) (mL/m2) (%) (g) (g/m2) (L/min) (L/min/m2)
[8] 10 — 150 ^ 20 — 46 ^ 8 — 96 ^ 16 — 69 ^ 4 114 ^ 22 — — — [31] 10 1.92a 180 ^ 29 — 68 ^ 13 — 112 ^ 19 — 62 ^ 4 113 ^ 36 69.2 ^ 12 — — [3] 10 — 98 ^ 22 — 33 ^ 9 — — — 67 ^ 5 126 ^ 25 — — — [9] 75 1.81 ^ 0.30 121 ^ 34 66 ^ 12 40 ^ 14 — 82 ^ 23 45 ^ 8 67 ^ 5 158 ^ 39 87 ^ 12 5.2 ^ 1.4 2.9 ^ 0.6 [11] 17 1.82 ^ 0.20 138 ^ 23 75 ^ 11 — 51 ^ 9 93 ^ 17 — 68 ^ 5 — — 5.6 ^ 0.9 3.0 ^ 0.4 [10] 36 1.86a 108 ^ 27 58 ^ 12 35 ^ 13 19 ^ 6 — — 68 ^ 5 132 ^ 28 71 ^ 11 5.2 ^ 1.2 2.8 ^ 0.6 [12] 15 — 114 ^ 16 — 47 ^ 7 — — — 58 ^ 5 — — — — Present study 31 1.71 ^ 0.16 88 ^ 27 52 ^ 14 25 ^ 11 14 ^ 6 64 ^ 16 37 ^ 9 73 ^ 6 90 ^ 23 52 ^ 10 4.3 ^ 1.4 2.5 ^ 0.7
aThese values of BSA were computed from the reported parameters and their values normalized to BSA.
Normal Systolic and Diastolic Functions of the LV and LA 453
Figure 6. Correlation between LVM index, LAmax index, LAmin index, and body indexes: BSA (upper row) and BW (lower row). Figure 5. Correlation between LVM and BSA (a) and between LVM index and BSA (b). Note that even after normalizing to BSA, LVM index shows high correlation with BSA, and significant gender difference.
Association Between LA and LV Functions
In associating LA and LV functions, we found that relative contribution of the reservoir, conduit, and pump volumes to the LVSV was approximately 27, 55, and 19%, respectively. The values are consistent with those found with cineagniography.[37 – 40]Our values, however, differ from the normal values reported by Prioli et al. with Doppler echocardiography and agree with the values they found in restrictive type diastolic dysfunc-tion.[41] The inconsistent results may be partly due to different definition for the reservoir volume used in Doppler measurement. Instead of subtracting minimum LA volume at early diastole from LAmax, the volume reverted into pulmonary veins with atrial contraction was subtracted from LAmax. This causes over estimation of the reservoir volume, and consequently, under estimation of the conduit volume.
We also found that the conduit volume was the parameter that has uniquely high correlation with different aspects of LV functions such as LVEDV representing the preload, LVESV representing the after load, LVSV, CO, and LVPER representing the pumping function, and LVPFR representing the LV filling function (see Table 5). Our findings are consistent with Toma et al.’s report. In 8 control subjects and 10 patients with myocardial infarction, they found that the change in the LV filling volume correlated with the change in the conduit volume, but did not correlate with the change in the reservoir volume and pump volume.[42]Our results showed that this correlation still exists in normal subjects.
Limitations
We used multiple short-axis slices to acquire three-dimensional data set of LV/LA volumes to minimize the partial volume effect. This method, however, encounters difficulty in defining LV/LA areas in slices located at the junction between the LV and LA, as well as between the LV and aortic root. Owing to cyclical base-to-apex movement of the cardiac base, LV/LA cavities in these slices would appear only in some time frames of the cardiac cycle and were discarded from the analysis. It follows that LVEDV is likely to be underestimated.
Normative values determined in this study were obtained from the study population with the mean age of 32 ^ 10 years old. As reported in the literature, LV and LA functions are age-dependent,[10,43]so our values are applicable only for young adults.
CONCLUSIONS
Using time-resolved, three-dimensional volume data obtained from cine MRI, we have established normative values of LV and LA functions in healthy Asian adults and have characterized functional relationships between LV and LA. The imaging acquisition protocol, data analysis algorithms, and the established normal values provide the basis for the study of left heart function in patients. Moreover, it may also provide important information for modeling normal LV/LA function in the study of ventricular mechanics.
ACKNOWLEDGMENTS
The authors gratefully acknowledge Pei-Jen Jiang for her assistance in MRI scanning.
REFERENCES
1. White, H.D.; Norris, R.M.; Brown, M.A.; Brandt, P.W.; Whitlock, R.M.; Wild, C.J. Left Ventricular End-Systolic Volume as the Major Determinant of Survival After Recovery from Myocardial Infarction. Circulation 1987, 76, 44 – 51.
2. Borow, K.M.; Green, L.H.; Mann, T.; Sloss, L.J.; Braunwald, E.; Collins, J.J.; Cohn, L.; Grossman, W. End-Systolic Volume as a Predictor of Post Operative Left Ventricular Performance in Volume Overload from Valvular Regurgitation. Am. J. Med. 1980, 68, 655 – 663.
3. Sakuma, H.; Fujita, N.; Foo, T.K.; Caputo, G.R.; Nelson, S.J.; Hartiala, J.; Shimakawa, A. Evaluation of Left Ventricular Volume and Mass with Breath-Hold Cine MR Imaging. Radiology 1993, 188, 377 – 380.
4. Katz, J.; Milliken, M.C.; Stray-Gundersen, J.; Buja, L.M.; Parkey, R.W.; Mitchell, J.H.; Peshock, R.M. Estimation of Human Myocardial Mass with MR Imaging. Radiology 1988, 169, 495 – 498.
5. Mogelvang, J.; Thomsen, C.; Mehlsen, J.; Brackle, G.; Stubgaard, M.; Henriksen, O. Evaluation of Left Ventricular Volumes Measured by Magnetic Resonance Imaging. Eur. Heart J. 1986, 7, 1016 – 1021.
6. van Rossum, A.C.; Visser, F.C.; van Eenige, M.J.; Valk, J.; Roos, J.P. Magnetic Resonance Imaging of the Heart for Determination of Ejection Fraction. Int. J. Cardiol. 1988, 18, 53 – 63.
7. Ostrzega, E.; Maddahi, J.; Honma, H.; Crues, J.V., III. Resser, K.J.; Charuzi, Y.; Berman, D.S. Quantification of Left Ventricular Myocardial Mass in Humans by Nuclear Magnetic Resonance Imaging. Am. Heart J. 1989, 117, 444 – 452.
8. van der Geest, R.J.; Buller, V.G.; Jansen, E.; Lamb, H.J.; Baur, L.H.B.; van der Wall, E.E.; de Roos, A.; Reiber, J.H.C. Comparison Between Manual and Semiautomated Analysis of Left Ventricular Volume Parameters from Short-Axis MR Images. J. Comput. Assist. Tomogr. 1997, 21 (5), 756 – 765.
9. Lorenz, C.H.; Walker, E.S.; Morgan, V.L.; Klein, S.S.; Graham, J.T.P. Normal Human Right and Left Ven-tricular Mass, Systolic Function, and Gender Differences by Cine Magnetic Resonance Imaging. J. Cardiovasc. Magn. Reson. 1999, 1 (1), 7 – 21.
10. Sandstede, J.; Lipke, C.; Beer, M.; Hofmann, S.; Pabst, T.; Kenn, W.; Neubauer, S.; Hahn, D. Age- and Gender-Specific Differences in Left and Right Ventricular Cardiac Function and Mass Determined by Cine Magnetic Resonance Imaging. Eur. Radiol. 2000, 10, 438 – 442.
11. Ja¨rvinen, V.; Kupari, M.; Hekali, P.; Puotanen, V.P. Assessment of Left Atrial Volumes and Phasic Function Using Cine Magnetic Resonance Imaging in Normal Subjects. Am. J. Cardiol. 1994, 73, 1135 – 1138. 12. Nosir, Y.F.; Lequin, M.H.; Kasprzak, J.D.; van Domburg,
R.T.; Vletter, W.B.; Yao, J.; Stoker, J.; Ten Cate, F.J.; Roelandt, R.T.C. Measurements and Day-to-Day Varia-bilities of Left Ventricular Volumes and Ejection Fraction by Three-Dimensional Echocardiography and Compari-son with Magnetic ReCompari-sonance Imaging. Am. J. Cardiol. 1998, 82, 209 – 214.
13. Mineoi, K.S.Y.; Ochi, T.; Hiwada, K. Left Ventricular Mass and Atrial Volume Determined by Cine Magnetic Resonance. Am. J. Hypertens. 2000, 13, 1103 – 1109. 14. Kramer, C.M.; Imaging of Function. In Imaging in
Cardiovascular Disease; Pohost, G.M., O’rourke, R.A., Berman, D.S., Shah, P.M., Eds.; Lippincott Williams & Wilkins: Philadelphia, 2000; Chap. 30, 417 – 439. 15. Tseng, W.Y. Magnetic Resonance Imaging Assessment
of Left Ventricular Function and Wall Motion. J. Formos Med. Assoc. 2000, 99, 593 – 602.
16. Longmore, D.B.; Klipstein, R.H.; Underwood, S.R.; Firmin, D.N.; Hounsfield, G.N.; Watanabe, M.; Bland, C.; Fox, K.; Poole-Wilson, P.A.; Rees, R.S. Dimensional Accuracy of Magnetic Resonance in Studies of the Heart. Lancet 1985, i, 1360 – 1362.
17. Rehr, R.B.; Malloy, C.R.; Filipchuk, N.G.; Peshock, R.M. Left Ventricular Volumes Measured by MR Imaging. Radiology 1985, 156, 717 – 719.
18. Debatin, J.F.; Nadel, S.N.; Sostman, H.D.; Spritzer, C.E.; Evans, A.J.; Grist, T.M. Magnetic Resonance Imaging— Cardiac Ejection Fraction Measurements: Phantom Study Comparing Four Different Methods. Investig. Radiol. 1992, 27, 198 – 204.
19. Stratemeier, E.J.; Thompson, R.; Brady, T.J.; Miller, S.W.; Saini, S.; Wismer, G.L.; Okada, R.D. Dinsmore Reejection Fraction Determination by MR Imaging:
Comparison with Left Ventricular Angiography. Radio-logy 1986, 158, 775 – 777.
20. Deutsch, H.J.; Smolorz, J.; Sechtem, U.; Hombach, V.; Schicha, H.; Hilger, H.H. Cardiac Function by Magnetic Resonance Imaging. Int. J. Cardiovasc. Imaging 1988, 3, 3 – 11.
21. van Rossum, A.C.; Visser, F.C.; van Eenige, M.J.; Valk, J.; Roos, J.P. Magnetic Resonance Imaging of the Heart for Determination of Ejection Fraction. Int. J. Cardiol. 1988, 18, 53 – 63.
22. Van Rossum, A.C.; Visser, F.C.; Sprenger, M.; Van Eenige, M.J.; Valk, J.; Roos, J.P. Evaluation of Magnetic Resonance Imaging for Determination of Left Ventricular Ejection Fraction and Comparison with Angiography. Am. J. Cardiol. 1988, 62, 628 – 633.
23. Cranney, G.B.; Lotan, C.S.; Dean, L.; Baxley, W.; Bouchard, A.; Pohost, G.M. Left Ventricular Volume Measurement Using Cardiac Axis Nuclear Magnetic Resonance Imaging: Validation by Calibrated Ventricular Angiography. Circulation 1990, 82, 154 – 163.
24. Mogelvang, J.; Thomsen, C.; Mehlsen, J. Left Ventricular Ejection Fraction Determined by Magnetic Resonance Imaging and Gated Radionuclide Ventriculography. Am. J. Noninvas. Cardiol. 1987, 1, 278 – 283.
25. Dilworth, L.R.; Aisen, A.M.; Mancini, G.B.; Lande, I.; Buda, A.J.; Mich, A.A. Determination of Left Ventricular Volumes and Ejection Fraction by Nuclear Magnetic Resonance Imaging. Am. Heart J. 1987, 113, 24 – 32. 26. MacMillan, R.M.; Murphy, J.L.; Kresh, J. Left
Ven-tricular Volumes Using Cine-MRI: Validation by Catheterization Ventriculography. Am. J. Cardiovasc. Imaging 1990, 4, 79 – 85.
27. Gaudio, C.; Tanzilli, G.; Mazzarotto, P.; Motolese, M.; Romeo, F.; Marino, B.; Reale, A. Comparison of Left Ventricular Ejection Fraction by Magnetic Resonance Imaging and Radionuclide Ventriculography in Idiopathic Dilated Cardiomyopathy. Am. J. Cardiol. 1991, 67, 411 – 415.
28. Hundley, W.G.; Meshack, B.M.; Willet, D.L.; Sayad, D.E.; Lange, R.A.; Willard, J.E.; Landau, C.; Hillis, L.D.; Peshock, R.M. Comparison of Quantitation of Left Ventricular Volume, Ejection Fraction, and Cardiac Output in Patients with Atrial Fibrillation by Cine Magnetic Resonance Imaging Versus Invasive Measure-ments. Am. J. Cardiol. 1996, 78, 1119 – 1123.
29. Mogelvang, J.; Thomsen, C.; Mehlsen, J.; Brackle, G.; Stubgaard, M.; Henriksen, O. Evaluation of Left Ventricular Volumes Measured by Magnetic Resonance Imaging. Eur. Heart J. 1986, 7, 1016 – 1021.
30. Chin, B.B.; Bloomgarden, D.C.; Xia, W.; Kim, H.J.; Fayad, Z.A.; Ferrari, V.A.; Berlin, J.A.; Axel, L.; Alavi, A. Right and Left Ventricular Volume and Ejection Fraction by Tomographic Gated Blood-Pool Scintigra-phy. J. Nucl. Med. 1997, 38, 942 – 948.
31. Buck, T.; Hunold, P.; Wentz, K.U.; Tkalec, W.; Nesser, H.J.; Erbel, R. Tomographic Three-Dimensional Echo-cardiographic Determination of Chamber Size and Systolic Function in Patients with Left Ventricular Aneurysm: Comparison to Magnetic Resonance Imaging, Cine Ventriculography, and Two-Dimensional Echocar-diography. Circulation 1997, 96, 4286 – 4297.
32. Lamb, H.J.; Doornbos, J.; van der Velde, E.A.; Kruit, M.C.; Reiber, J.H.C.; de Roos, A. Echo Planar MRI of the Heart on a Standard System: Validation of Measurement of Left Ventricular Function and Mass. J. Comput. Assist. Tomogr. 1996, 20, 942 – 949.
33. Wang, J.L.; Tseng, W.Y.; Liao, T.Y. A Robust Edge Detection Algorithm for Volumetric Anaysis of Left Ventricle in Cine Magnetic Resonance Imaging. Biomed. Eng. Appl. Basis Comm. 2000, 12, 75 – 80.
34. Schoenberg, I. Contributions to the Problem of Approxi-mation of Equidistant Data by Analytic Functions. Q. Appl. Math. 1946, 4, 45 – 99.
35. Bland, J.M.; Altman, D.G. Statistical Methods for Assessing Agreement Between Two Methods of Clinical Measurement. Lancet 1986, 1, 307 – 310.
36. Braunwald, E. Heart Disease: A Textbook of Cardio-vascular Medicine, 6th Ed.; Braunwald, E., Ed.; W. B. Saunders Company: Philadelphia, 2001 Chp. 15, 495 –496. 37. Rahimtoola, S.H.; Ehsani, A.; Sinno, M.Z.; Loeb, H.S.; Rosen, K.M.; Gunnar, R.M. Left Atrial Transport Function in Myocardial Infarction Importance of Its Booster Pump Function. Am. J. Med. 1975, 59, 686 – 694.
38. Matsuda, Y.; Toma, Y.; Mortani, K.; Ogawa, H.; Kohno, M.; Miura, T.; Matsuda, M.; Matsuzaki, M.; Fujii, H.; Kusukawa, R. Assessment of Left Atrial Function in Patients with Hypertensive Heart Disease. Hypertension 1986, 8, 779 – 785.
39. Hamby, R.I.; Noble, W.J.; Murphy, D.H.; Hoffman, I. Atrial Transport Function in Coronary Artery Disease: Relation to Left Ventricular Function. J. Am. Coll. Cardiol. 1983, 1 (4), 1011 – 1017.
40. Toutouzas, K.; Trikas, A.; Pitsavos, C.; Barbetseas, J.; Androulakis, A.; Stefanadis, C.; Toutouzas, P. Echocar-diographic Features of Left Atrium in Elite Male Athletes. Am. J. Cardiol. 1996, 78, 1314 – 1317.
41. Prioli, A.; Marino, P.; Lanzoni, L.; Zardini, P. Increasing Degrees of Left Ventricular Filling Impairment Modulate Left Atrial Function in Humans. Am. J. Cardiol. 1998, 82, 756 – 761.
42. Toma, Y.; Mastuda, Y.; Moritani, K.; Ryoke, T.; Katayama, K.; Miura, T.; Ogawa, H.; Matsuda, M.; Matsuzaki, M.; Kusukawa, R. Left Atrial Conduit Function for Left Ventricular Filling Dynamics in Patients with Myocardial Infarction. Cathet. Cardiovasc. Diagn. 1989, 18 (2), 85 – 89.
43. Nishigaki, K.; Arakawa, M.; Miwa, H.; Kagawa, K.; Noda, T.; Ito, Y. A Study on Left Atrial Transport Function. Effect of Age or Left Ventricular Ejection Fraction on Left Atrial Storage Fraction. Angiology 1994, 45 (11), 953 – 962.
Received October 1, 2001 Accepted June 10, 2002