Water Dynamics on the Surface of MCM-41 via
2H Double Quantum Filtered NMR and
Relaxation Measurements
Dennis W. Hwang, Anil K. Sinha, Chi-Yuan Cheng, Tsyr-Yan Yu, and Lian-Pin Hwang* Department of Chemistry, National Taiwan UniVersity, and Institute of Atomic and Molecular Sciences, Academia Sinica, Taipei, Taiwan, R.O.C.
ReceiVed: August 9, 2000; In Final Form: March 30, 2001
Dynamics of water adsorbed on MCM-41 has been investigated by line shape analyses of2H double quantum filtered (DQF) NMR and T1measurements. From temperature-dependent studies with various water loadings on MCM-41, it is found that there are three sites for water adsorption on MCM-41, namely, a “slow site”, a “fast site I”, and a “fast site II”. The signal of water molecules in the slow site dominates in the observed DQF NMR. Fast site I is adjacent to the slow site, and the water molecules are exchangeable in these two sites. The fast site II is next to the fast site I, and water in the fast site II is only exchangeable with that in the fast site I. The influence of silanol groups on the MCM-41 surface strongly affects the motion of water molecules in the slow site, resulting in a residual quadrupolar interaction. As the signal of water in the fast site I dominates that observed in single quantum spectra, it also appears in DQF spectra through an exchange process. We found that when the fast site I is saturated, it has no influence on the internal rotation, but the wobbling motion of adsorbed D2O in the slow site becomes faster, i.e., the translational diffusion of D2O in the fast site I may increase the wobbling motion of adsorbed D2O through collision.
Introduction
The properties of simple liquids in the vicinity of solid surfaces, both for bulk liquids and particularly when they are confined in some specific regions, have received much attention. For example, a single smooth solid surface may induce layering in liquids in contact with it.1-6To understand more complete processes such as adsorption and catalysis, detailed knowledge of the dynamics and diffusion of adsorbates in porous systems is essential.
Recent advances in theory and experimental techniques have substantially increased the information obtainable by NMR characterization of porous materials.7-14 The use of double quantum filtered (DQF) NMR spectroscopy as a diagnostic tool for the detection of anisotropy in porous systems has recently been demonstrated,14for example, as a sensitive method for the determination of the residual quadrupolar interaction in adsorbed layers. For a spin-1 system, the double quantum coherence vanishes in an isotropic medium. Hence, observation of the DQF spectra indicates the presence of residual quadru-polar coupling, and so the order parameter for the adsorbed spin-bearing molecules must be nonzero.15-19
We report2H NMR relaxation studies to investigate temper-ature-dependent water dynamics and exchange processes in D2O loaded to various extents in MCM-41. In addition, we report line shape analysis and DQF NMR spectra to address dynamics. The water-saturated mesoporous materials have been commonly studied by conventional NMR spectroscopy.1,8,20 The spectra have been interpreted in terms of a water molecule interacting with the specific adsorption sites on the pore surface. Examina-tion of the double quantum coherence of quadrupolar spins may be helpful in selective excitation of adsorption-related spin species in the presence of isotropic species.15 The signal
sensitivity of DQF spectra essentially depends on the number of quadrupolar nuclei with nonvanishing residual interaction.16-19 The resulting spectra depend on the residual interaction. To interpret the adsorbate dynamics and to calculate the spectral density functions for restricted motion of adsorbed water molecules we employ a three-site exchange model.
Theory
Three-Site Exchange Model Incorporating a Residual Quadrupolar Interaction. We decide a density matrix approach including exchange and coherence transfer. The problem may be simplified by expressing the rate equation in an irreducible tensorial basis22,23where the individual elements of the density matrix transform as components of the full rotation group. The
qth component of a rank K irreducible tensorial component, TKq,
can be related to the elements of the usual density matrix. The basic relaxation theory including three-site exchange is similar to that used by Price et al.24In the present study, we assume that the residual quadrupolar interaction, given as the motionally averaged Hamiltonian, is axially symmetric with respect to the principal axis of motion,14-18e.g.,
withθ being the angle between the z-axis of the molecular frame and the Zeeman field, e.g., the angle between the hexagonal cylindrical axis of the MCM-41 and the Zeeman field. Here, the hexagonal pore of MCM-41 has been approximated to possess cylindrical symmetry. ωq,θ and ωq are the residual quadrupolar interactions, defined in the laboratory and the molecular frame, respectively, after averaging over all the * To whom correspondence should be addressed. Phone:
+886-2-23668287. Fax: +886-2-23636359. E-mail: nmra@po.iams.sinica.edu.tw.
H )ωq,θ
(
Iz2- 1 3I(I + 1))
≡ωq(
1 2)
(3 cos 2 θ - 1)(
Iz2- 1 3I(I + 1))
(1)10.1021/jp002888j CCC: $20.00 © 2001 American Chemical Society Published on Web 05/25/2001
Downloaded by NATIONAL TAIWAN UNIV on September 3, 2009 | http://pubs.acs.org
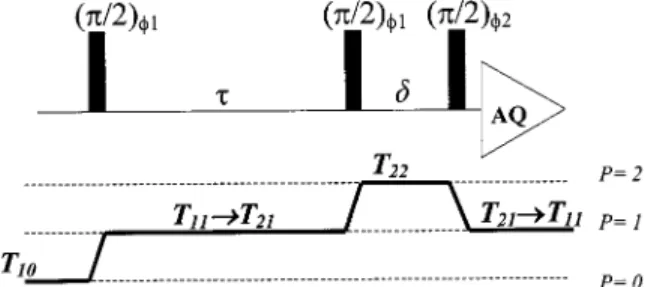
coordinates of molecular motions and orientational distribution of adsorbate. For the relaxation studies presented in this work, a two-site model cannot satisfactorily explain the experimental results. Therefore, in the present case we use a model with three sites: a “slow site”, a “fast site I”, and a “fast site II”, denoted by s, f1, and f2, respectively. We have made the following assumptions in the present model: (i) Site s is on the surface wherein D2O adsorption occurs, site f1is above site s which is under the influence of s; (ii) site f2is independent of s; and (iii) there are only two allowed D2O exchange processes. One is exchange between site s and site f1, and the other is between site f1and site f2. A schematic diagram of the model is presented in Figure 1. An isotropic distribution of θ is applied to approximate the location of adsorption sites under the random orientational distribution of MCM-41 crystals in our powder sample. In the rotating frame, the equation of motion for the related irreducible tensor components under the influence of the residual quadrupolar interaction, in the absence of spin relaxation processes, is given by refs 14-18
where the tensorial components are related to the usual spin operators by T11≡ I+/2 and T21≡ IzI++ I+Iz.
DQF spectra are conventionally measured using the pulse sequence14-18 π/2sτsπ/2sδsπ/2s (Acq.). Since we have restricted the problem to the case of a spin-1 system, the only coherence-transfer pathways (Figure 3) to be considered are between rank one and rank two, as described in eq 2. The first 90° pulse transforms Zeeman order T10 (T10 ≡ Iz/x2) into single-quantum coherence T11, which then generates T21in the evolution period via the residual quadrupolar interaction given in eq 2. The second 90° pulse, with DQF phase cycling, transforms T21into double-quantum coherence, T22(T22≡ I+I+/ 2) and T2-2(T2-2≡ I-I-/2). The last 90°pulse transforms the double-quantum coherence into an observable signal. In the present relaxation study, the molecular dynamics characterized by the modulation with a residual quadrupolar interaction by a prescribed exchange process is given. Hence, the evolution of the related transverse components T11and T21at sites f1, f2, and s, expressed by the superscripts, may be described by the following rate equation of density matrix operators.14,15
where
and
for R andβ ) f1, f2, and s. kf1sis the microscopic rate constant for transfer from site f1to site s, and ksf1is the microscopic rate constant for transfer from site s to site f1, kf1f2is the microscopic rate constant for transfer from site f1to site f2, and kf2f1is the microscopic rate constant for transfer from site f2to site f1. In addition, the detailed balance applied to the exchange process requires that
where we define Pf1, Pf2, and Psas the populations in site f1, site f2, and site s, respectively. In eq 3, the spin relaxation rate constants for single and double quantum coherence (expressed by the first subscript of R) with different sites (expressed by the superscript) are given in ref 15.
where CR ≡ 3χR2/160, for R ) f1, f2, and s and where the quadrupolar coupling constantsχf1≡ e2Qqf1/η, χf2≡ e2Qqf2/η, andχs≡ e2Qqs/η are for sites f1, f2, and s, respectively, and the corresponding spectral density functions defined below for motional relaxation of D2O molecules are Jn
f1
, Jnf2, and Jns. Since the O-D bond of the water molecule is considered to be cylindrical, the contribution of the asymmetry parameter of the electric field gradient to relaxation is negligible. It is worth noting that all the parameters used for the slow site have the characteristics of adsorption interactions. To guarantee the validity of this equation, the conditionτex. τcmust hold, where τcrepresents the microscopic motional correlation times defined below, andτexis defined asτex
f1s≡ Pf1
/ksf1) Ps/kf1sandτex f1f2≡ Pf1/kf2f1) Pf2/kf1f2.
The DQF spectra are simulated using a complete formulation of the relaxation processes occurring throughout the DQF and the subsequent acquisition period. Starting from thermal equi-librium, eq 3 is used to follow the creation of T21f1, T21f2, and T21s components during the periodτ. The resulting double-quantum terms, T21f1, T21f2, and T21s , form an initial condition for calculat-ing the transverse evolution durcalculat-ing the acquisition period. This equation is also used for simulation of the single quantum spectrum. For the calculation of T1the time evolution of the longitudinal components follows the rate equation14,15
Figure 1. Schematic representation of three-site model for D2O
adsorption in MCM-41. The water molecules exchange between the site s and site f1independently of the exchange between site f1and site
f2. The population of water in site s, site f1, and site f2, is denoted by
Pf1, Pf2, and Ps, respectively. kxyis the microscopic rate constant for transfer from site x to site y.
d dt
[
T11 T21]
)[
0 -iωq,θ -iωq,θ 0][
T11 T21]
(2) d dt[
σf2 σf 1 σs]
)[
- Rf 2- Kf2f1 Kf1f2 0 Kf 2f1 - Rf1- Kf1f2- Kf1s Ksf1 0 Kf1s - Rs- Ksf1-Ωq,θ]
[
σf2 σf1 σs]
(3a) σR≡[
T11R T21R]
(3b) KRβ≡ kRβ[
1 0 0 1]
(3c) R≡[
R11 R 0 0 R21R]
(3d) Ωq,θ≡[
0 iωq,θ iωq,θ 0]
(3e) Pf 1kf1s) Psksf1 (4a) Pf 1kf1f2) Pf2kf2f1 (4b) R11R ≡ CR(3J0R+ 5J1R+ 2J2R) R21R ) CR(3J0R+ J1R+ 2J2R) (5)Downloaded by NATIONAL TAIWAN UNIV on September 3, 2009 | http://pubs.acs.org
where R10f1, R10f2, and R10s are the longitudinal relaxation rates for site f1, f2, and site s, as defined in ref 15.
The calculations of T1and the single-quantum line shape were also employed in the determination of simulation parameters. Spectral Density for Fast Motion Site. For the fast motion sites, f1and f2, the reorientational Brownian motion of water molecules averages the anisotropic quadrupole interaction experienced by the2H nucleus to zero. The spectral-density function expressed in eq 7 for the fast sites is given by the spectral-density functions related to the reorientational motion of water molecules, i.e.,
where R ) f1 and f2. τc
R
is the effective reorientational correlation time of water molecules and ω0 is the Larmor precesion frequency of the deuteron.
Spectral Density for Slow Motion Sites. The spectral-density functions for site s including the residual quadrupolar interaction are given by the following expressions.15
where jns is the spectral density for the dynamic part of the motion at site s, D00(n) is the Wigner rotation matrix element, with the orientation specified by principal axis of deuteron quadrupolar interaction tensor relative to the laboratory frame. 〈 〉 means taking the average over the space of motion not restricted by the adsorptive interaction, and also the orientation distribution of adsorbate on MCM-41 surface.
To describe the motion of the adsorbate in the slow motion sites, we use a modification of the cone model of Brainard and Szabo.21This facilitates the calculation of the time-correlation function and the spectral-density functions of the adsorbed water molecule. The modified cone model is depicted schematically in Figure 2. In the present work, for the dynamics of the adsorbed water molecule we have ignored the overall reorienta-tion of the adsorbate molecule from their model because of the restricted motion caused by adsorption. Then the spectral density function is modified after omitting the overall reorientation25 as follows
where the internal rotation of D2O has a correlation timeτi s≡ 1/(4Di), and the wobbling motion of the D2O molecule along its C2 axis has a correlation time τw ≡ 1/(6Dw), d2mn(β) are elements of the reduced Wigner rotation matrix andβ is the fixed angle between the C2axis of D2O molecule and principal axis of the residual quadrupolar interaction, i.e., the O-D direction. In the present study, we consider the interaction of the bound water molecule with the silanol group only along the C2axis of water and β ) 54°. The wobbling motion of D2O about the C2axis is assumed to be within a cone, having a correlation timeτw(cf. Figure 2). The orientational distribution of the cone in the molecular frame may be expressed by an order parameter S ≡ 〈D00(2)〉m where the average is over the orientational distribution due to the wobbling motion and also due to the available site arrangement for water to interact with the silanol groups on the pore surface of MCM-41. When S ) 0 the bound water molecules have a completely randomized orientational distribution and for S ) 1 all the bound water molecules are inclined at an angle along the C2axis with respect to the adsorption site. With this assumption, the second terms in eq 9 can be readily evaluated as 〈D00(2)〉 ) SD00(2)(θ), where axial symmetry of the adsorption interaction and site distribution are assumed and the third term in eq 9 can be deduced from the term〈D00(4)〉)〈D00(4)〉mD00(4)(θ). To evaluate〈D00(4)〉in terms of S, a specific distribution for the cone model is needed. For an isotropic distribution with a cone angle of b, Brainard and Szabo21obtained S ) 1/2 cos b(1 + cos b). Using this, we then obtain〈D00(4)〉m) S(7S/2 - 7(1 + 8S)1/2+ 1). Hence, with this particular model one may evaluate the spectral density functions for site s. d dt
(
T10f1 T10f2 T10s)
)(
- R10f1 - k f1s- kf1f2 kf2f1 ksf1 kf 1f2 - R10 f2 - k f2f1 0 kf 1s 0 - R10 s - k sf1)
(
T10f1 T10f2 T10s)
(6) R10f1 ) 2Cf1(J 1 f1+ 4J 2 f1) R10f2 ) 2Cf2(J 1 f2+ 4J 2 f2) (7) R10s ) 2Cs(J1s+ 4J2s) JnR) 2τc R 1 + (nω0τc R )2 (8) J0s≡ j0s(
1 +10 7〈D00 (2)〉+ 18 7〈D00 (4)〉- 5〈D 00 (2)〉2)
J1s≡ j1s(
1 +5 7〈D00 (2)〉- 12 7〈D00 (4)〉)
(9) J2s≡ j2s(
1 -10 7〈D00 (2)〉+ 3 7〈D00 (4)〉)
Figure 2. The modified cone model for D2O molecule adsorption in
site s used in the present studies.τwis correlation time of restricted wobbling motion, and τi
s is correlation time of internal rotation motion. jns) 4S2(d102(β))2 Di Di2+ (nωo)2 + 4S2(d202(β))2 4Di (4Di)2+ (nωo)2 + 2(d002 (β))2 (1 - S 2 )[6Dw/(1 - S2)] [6Dw/(1 - S2)]2+ (nωo)2 + 4(d102(β))2 (1 - S 2 )[Di+ 5Dw/(1 - S2)] [Di+ 5Dw/(1 - S2)]2+ (nωo)2 + 4(d202(β))2 (1 - S 2 )[4Di+ 2Dw/(1 - S2)] [4Di+ 2Dw/(1 - S2)]2+ (nωo)2 (10)
Downloaded by NATIONAL TAIWAN UNIV on September 3, 2009 | http://pubs.acs.org
Order Parameter and Residual Quadrupolar Interaction. It is noted that ωqm is the maximum residual quadrapolar interaction for a D2O molecule adsorbed on the adsorption site with maximum strength of interaction. For D2O quadrapolar interaction,ωqm) 3/4χs, whereχsis the quadrapolar coupling constant.
In the formulation, both the S and ωq represent the same essential quantity of the system, i.e., their respective quantities are averaged over the same coordinates of molecular motion and the orientational distribution of adsorbate. Therefore, the residual quadrupolar anisotropy,ωq, is proportional to the order parameter, S, with the relation
where S characterizes the strength of residual interaction for adsorbed water molecules ranging in the limits 0 e S e 1.
Calculation of Line Shape in T1Process. The above theory may be used in simulating the signal of the free induction decay after the inversion recovery pulse sequence (i.e.,π-τ ′-π/2-Acq.). The equilibrium multipoles can be calculated from the corresponding density matrix elements as T10,eq≡ (γηB0I(I + 1)/3x2kT), where γ is the gyromagnetic ratio, k is the Boltzmann constant, and B0is the Zeeman field.
Since we have exchanging species, the individual multipoles must be population-weighed. The effects of theπ pulse are then calculated, and thus immediately after theπ pulse and including population-weighted multipoles as the initial conditions be-fore evolution of τ′ we have T10f1(0) ) -Pf1T10,eq, T10
f2(0) ) -Pf2T10,eq, and T10
s
(0) ) -PsT10,eq.
For the calculation of T1, eq 6 is used to follow the evolution of the longitudinal magnetization during the delay timeτ′. In eq 6, R10
s
is calculated from eq 7 with the help of eqs 9 and 10 for the slow motion site. R10f1 and R10f2 is calculated from eq 7 with the help of eq 8 for the fast motion site. An isotropic distribution of θ is applied to simulate the situation of the random orientational distribution of pore systems relative to the field direction in the powder sample. Then the longitudinal magnetization after the delay timeτ′can be evaluated as
The calculation is performed by numerical integration, with the inversion-recovery spectra evaluated from Mz at various τ′ described previously.24
Simulation of Double Quantum Spectra. The firstπ/2 pulse of the DQF sequence transforms the Zeeman order T10,eqinto single-quantum coherence T11, which then generates T21in the evolution timeτ via the residual quadrupolar interaction given in eq 2. Equation 3 is used to calculate T11f1, T21f1, T11f2, T21f2, T11s , and T21s during the evolution timeτ with the initial conditions T11f1(0) ) (1/x2)Pf1T10,eq, T11 f2(0) ) (1/x2)Pf2T 10,eq, T11 s(0) ) (1/ x2) PsT10,eq, and T21 f1 (0) ) T21f2(0) ) T21s(0) ) 0. In eq 3, R11s and R21s are calculated from eq 5 with the help of eqs 9 and 10 according to the distribution ofθ for the slow motion site, and R11f1, R21f1, R11f2, and R21f2 are calculated from eq 5 with the help of eq 8 for the fast-motion site. The relaxation rate associated with T22s, denoted R22s , is found to be much slower than R21s .15We have also made a similar observation in our present study where
R22s ≈ 102s-1, R
21
s ≈ 3 × 10³s-1. Thus, in a period ofδ ) 10µs, T22s coherence is maintained. Immediately after the third π/2 pulse with DQF phase cycling, the signal is proportional to the double-quantum coherence T21
f1(τ), T 21
f2(τ), and T 21
s (τ). Thus
with the initial condition T21f1 ) T21f1(τ), T21f2 ) T21f2(τ), T21s ) T21s(τ), and T11f1 ) T11f2 ) T11s , eq 3 is used again to calculate the free induction decay (FID) during the acquisition time t. In analogy to eq 12, the FID signal and the DQF spectra are obtained as described in the previous section. The DQF spectra may also be obtained by using a Fourier transform procedure.24 Experimental Section
Sample Preparation. Cetyltrimethylammonium bromide (CTAB) (Acros, 99%) was dissolved in distilled water at 35 °C under stirring. To it a solution of sodium silicate (Aldrich, 14% NaOH and 27% SiO2) was added and stirred for 20 min. The pH of the solution was adjusted to 10 by dropwise addition of 1.2 M sulfuric acid (Acros). The molar composition of the gel mixture was 1.00 SiO2/0.35 CTAB/0.28 H2SO4/100 H2O. The gel mixture was further stirred for 1 h. The resulting mixture was transferred to a Teflonq-lined autoclave and then heated at 100°C for 48 h. The final solid product obtained after filtration, was washed with distilled water, dried in air at room temper-ature, and calcined at 560°C for 6 h.
X-ray powder diffraction data of the MCM-41 was collected on a Scientag XI diffractometer using CuK∝ radiation. The average pore diameter was estimated from the d100-spacing of the X-ray diffractograms. The surface-area and pore-size measurements were performed on a homemade high vacuum system. Assuming the thickness of the walls to be 1 nm, the estimated average pore diameter is 3.38 ( 0.17 nm. The sample was degassed at 590 K and 1 mPa for 16 h. The sample has BET surface areas of 900 ( 45 m2g-1, which is a characteristic of mesoporous material.
The MCM-41 was initially dried under a vacuum of 10-5 Torr at 650 K for at least 16 h. Then it was transferred into a 8 mm i.d. tube approximately 40-mm long. An appropriate amount of D2O was introduced to get D2O/MCM-41 weight ratios of 11, 7, and 4 D2O. These are denoted as samples A, B, and C, respectively. Then the sample tubes were sealed and kept at 373 K for at least 24 h to ensure a homogeneous distribution of adsorbate in the sample before the NMR measurement. In case of the structure changing of MCM-41, all NMR measurement had were within one month of making the sample.
NMR Measurement. The 2H NMR measurements were performed on Bruker MSL-500 and MSL-300 spectrometers operating at 76.78 MHz (11.75 T) and 46.07 MHz (7.05 T) with a 90°pulse of 30 and 20µs, respectively. The receiver recovery time is less than 10µs, and probe dead time is 10 µs. For the quadrupolar echo measurement, a 90°pulse of 9 µs and a delay of 5µs were used with the high power unit. The line shape in single pulse experiment is not significantly different from that in a quadrupolar-echo measurement for the D2O samples at 210 K. Thus, single pulse experiments were used to obtain the spectra for analyses.
The pulse sequence for DQF NMR is shown in Figure 3. We used the following 2H NMR acquisition parameters 125 kHz spectral width, 16 K data points, and NS ) 20 000 scans per spectrum. A delay of at least 5 T1 was allowed between scans for the T1and DQF spectra. Phase cycling was used. The temperature was controlled to a precision of ( 0.1°C and was calibrated using methanol. The magnetic inhomogeneity was estimated by comparing Hahn spin-echo and line width measurements. The magnetic inhomogeneity was found to account for less than 5 Hz of the observed line width at half-height in the spectra. The longitudinal relaxation measurements were obtained using the inversion-recovery pulse sequence.
S≡ ωq/ωqm (11) Mz(τ′)∝
∫
0 π (T10f1(τ′) + T 10 f2(τ′) + T 10 s (τ′)) sinθ dθ (12)Downloaded by NATIONAL TAIWAN UNIV on September 3, 2009 | http://pubs.acs.org
Reproducibility of relaxation data has been checked to examine whether equilibrium is reached in the pore systems over a period of two months.
Results
The comparison of simulation with experimental spectra is presented in Figure 4 and Figure 5. Knowledge of the value of quadrupolar coupling constant (QCC) for D2O is important when analyzing2H NMR spectra. Several NMR measurements26-31 and theoretical calculations34have reported the values of D
2O quadrupolar coupling constant for different structures. Molecular dynamics simulation of liquid water indicates that the values usually vary with the geometry of D2O, in particular it strongly
depends both on intra- and intermolecular O-D bond distance.32 The range of quadrupolar coupling constant is from 180 to 373 kHz.32From NMR studies, it is observed that the quadrupolar coupling constant of ice is between 213 and 226 kHz.26-34For liquid-phase water at 300 K, the values of the quadrupolar coupling constant is between 208 and 259 kHz.26-34In MCM-41, some fraction of water molecules are adsorbed on the surface and the rest are condensed by capillary action. QCC values and internal rotation correlation time would affect both the null point of the inversion-recovery spectra and the line width of SQ spectra. As described below, we find out that 213 kHz is the best QCC value of determination for water molecules in site s. Water molecules present in sites f1and f2as similar to bulk water due to its isotropic motion, and thus we takeχ/2p) 256 kHz for sites f1 and f2 in accordance with the ab initio calculation32and NMR measurements.33
Evaluation of the Order Parameter. As shown in Figure 6a for sample A at a temperature below 240 K, the spectra demonstrate an edge splitting ∼4 kHz, which represents the anisotropically moving adsorbed D2O molecules. The invariance of the line shape with temperature indicates the existence of a single water component, the “bound water”. It possesses a residual quadrupolar interaction ωq/2π≡ 3/4χsS/2π∼ 4kHz. Accordingly, the magnitude of S may thus be evaluated with the choice of aχsvalue between 180 and 373 kHz. The relative intensity of the wiggling peaks in DQF spectra at DQ evolution time, 500µs, is only sensitive to S, e.g., Figure 4a, sample B at 260 K. Furthermore, the magnitude can be reconfirmed by the change in the negative peak intensity at different DQ evolution time. Besides, the obtained values ofχsand S can be justified
Figure 3. Pulse sequence and coherence-transfer pathway used in DQF experiment. Tlqrepresents the irreducible tensorial component with rank
l and coherence q.τ is the DQ evolution time for double quantum
coherence andδ was set at 10 µs.
Figure 4. Experimental (top) and simulated (bottom) 2H double
quantum filtered spectra at various evolution times cited for (a) sample B and (b) sample C at 260 K. The DQ evolution times are cited underneath the spectra. The spectra were acquired at 76.78 MHz.
Figure 5. Experimental (top) and simulated (bottom)2H spectra of
inversion recovery experiments at 260 K cited for (a) sample B and (b) sample C at 76.78 MHz.
Downloaded by NATIONAL TAIWAN UNIV on September 3, 2009 | http://pubs.acs.org
also from the edge splitting in the SQ spectra. It yields S ) 0.022 ( 0.001 and thenχs) 213 ( 10 kHz. It is believed that χs has negligible temperature dependency, and we take this quantity as a constant throughout the calculation in this work. Determination of τw from DQF Spectra. In Figure 7 2H
DQF NMR spectra for samples A, B, and C at temperatures 240, 259, 260, and 273 K are presented at frequency of 76.78 MHz. Field-independent DQF spectra were found for all samples studied. The intensity profile of the central peaks with increasing DQ evolution times may be utilized to determineτw.
Determination of Pf1, Pf2,τexf1s, andτexf1f2. Figure 4 represents
the two characteristics of DQF spectra which are very useful in
determining Pf1and Ps: (i) at shorter DQ evolution times,τ ) 80 to 220µs, the sharp embedded tip of the central peak can be used to determine Pf1. (ii) at longer DQ evolution times,τ ) 220 to 500 µs, Pf1 could affect the intensity of central peak through an exchange process. For instance, in the DQF spectra of sample C in Figure 4b, the tips embedded in the central peaks demonstrate narrower line widths than those in low loading samples at higher temperatures. Thus, the contribution of the D2O in site f1through exchange with the D2O in site s gives rise to the appearance of sharp tips in peaks. One may utilize this feature to determine the exchange rate τexf1s and the population ratio between site f1and s. Utilizing the parameters given above, one may obtain the population of site f2and also the value τexf1f2 by fitting the central peak in the SQ spectra. Furthermore, we can check Pf1, Ps, and τex
f1s, predetermined from DQF spectra, may be contributed by simulation of the SQ line shape. In particular,τexf1sis sensitive to the line shape in the shoulder region. With mutual successive trials of Pf1, Pf2,
Ps,τex
f1s
, andτexf1f2, a distinct set of parameters may be determined unambiguously. The values of Psdetermined for the system are given in Tables 1-3 in terms of Pf1/Psand Pf2/Psratios.
Determination ofτcf1,τcf2, andτisfrom T1Spectra. In the
recovery experiment, the line shapes of inversion-recovery spectra depend on temperature. By analysis of T1data, τcf1,τcf2, and τismay be determined. The relative population of D2O in each site may be found by line shape analysis, as described previously. The comparisons of simulated line shapes in T1measurements are given in Figure 4.
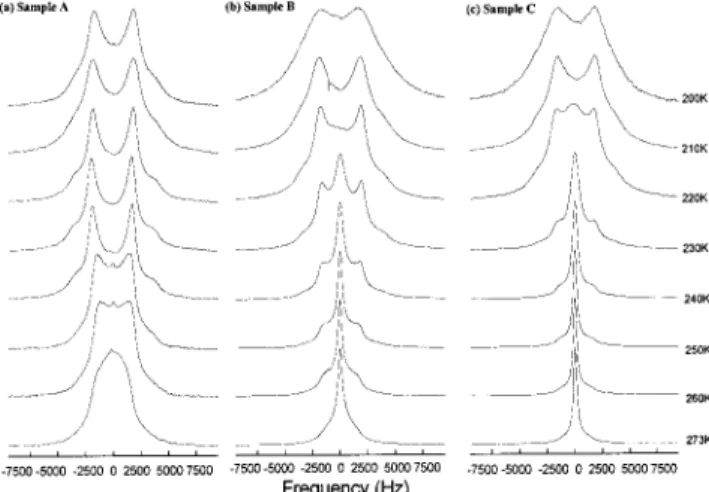
Sample A. Figure 6a shows the SQ spectra of sample A from 200 to 273 K. The central peak has contributions from sites f1 and f2, and the solidlike band is from molecules at site s. It is observed that the central peak decreases with decreasing temperature from 270 to 250 K and totally disappears at 240 K, with only the solidlike band at lower temperatures. The peak broadening in the shoulder region with decreasing temperature indicates slower molecular motions of water molecules, a result corroborated by the T1measurement. Accordingly, we obtained order parameter S ) 0.020∼ 0.026 depending on temperatures for sample A. Figure 7a shows the DQF spectra from 200 to 273 K. Theτwin sample A is unaffected by the temperature variation from 220 to 273 K. The DQF spectral profiles at 200 and 210 K differ from those at elevated temperatures. The drastic drop in DQF spectral intensity with DQ evolution time represents a slowerτw. The results listed in Table 1 shows the magnitude ofτw is approximately 10-5 s. The motion is too slow to apply a second-order perturbation treatment within the validity of the Redfield relaxation scheme. However, the difference in magnitudes still shows the relative slowness of the motion.
Sample B. The water loading in sample B is higher than in sample A. From Figure 6b, it is obvious that the central peak of the SQ spectra of sample B is larger than sample A. In Figure 7b from 240 to 273 K, DQF spectra of sample B also present a larger central peak atτ ) 220 to 500 µs than those of sample A at the sameτ values. As mentioned above, the central peak of DQF spectra result from a contribution of water in site f1 through an exchange process. Although the intensity of the central peak in DQF spectra is different, in Table 2,τwremains around 10-5s from 220 to 273 K. The water in site f1shows up at a temperature higher than 230 K. There is a significant increase of 1 order of magnitude in the internal rotation of water molecules at site f1 in the range from 240 to 250 K. Internal rotation of water molecules at site s also changes significantly from 230 to 240 K. Even at temperatures higher than 250 K,
Figure 6. Experimental2H SQ spectra at 76.78 MHz from temperature
range of 200 K to 273 K for (a) sample A, (b) sample B, and (c) sample C.
Figure 7. Experimental2H DQF spectra at 76.78 MHz from
temper-ature range of 200 to 273 K for (a) sample A, (b) sample B, and (c) sample C with different DQ evolution times. For a given temperature, the six DQF spectra from left to right are obtained with DQ evolution time,τ, given by 80, 160, 220, 280, 400, and 500 µs, respectively.
Downloaded by NATIONAL TAIWAN UNIV on September 3, 2009 | http://pubs.acs.org
water at site f2 appears only with very low population. This implies that the site f2is distant from site s.
Sample C. In Figure 7c, at a temperature higher than 240 K, the central peak of the DQ spectra of sample C at longer DQ evolution times is more intense than those in the same temperature range for samples A and B. As listed in Table 3, τw valves at 250 to 273 K are around 10-8 s, 3 orders of magnitude faster thanτwobserved in the temperature range from 235 to 273 K. Larger populations of water in site f1and f2are found for sample C than those in samples A and B. Figure 6c illustrates that the central peak of the SQ spectra of sample C disappears at 210 K, lower than for samples A and B. This indicates that the water loading in MCM-41 affects the temperature-dependent behavior of the SQ spectra. In ac-cordance with the simulation results given in Table 3, one finds an abrupt slow-down ofτcf1at temperatures below 235 K. The same phenomenon also happens in sample B in the temperature range from 240 to 245 K.
Discussion
DQF NMR and Water Adsorption of MCM-41. In practice, when referring to real surfaces the formation of adsorption layers involves various complicated surface interactions. For systems containing quadrupolar nuclei the effective adsorption interac-tions for D2O are expressed in terms of residual quadrupolar interactions of deuterium nuclei. Therefore, the study of quadrupolar relaxation may reflect the main feature of adsorption interaction, short-range adsorption interaction. With DQF NMR selective excitation of the spin species possessing residual
quadrupolar interaction address the investigation of these species. However, the long 90°pulse indeed affects the DQF experiment at the shortest evolution time. For evolution times of 80µs, the effect results in a relatively larger disagreement between the experimental2H DQF spectra and the simulation in comparison with other DQF spectra with larger evolution times.
From Tables 1 to 3, the total number of water molecules per gram of MCM-41 in each site for samples A, B, and C can be calculated. Figure 8 depicts the plot of the number of water molecules in site s vs temperature. The water signal from site s increases abruptly at temperatures below 240 K for both samples B and C, and it may result from the freezing of water molecules at sites f1 and f2. Although the number of water molecules in these three samples is too small to form a three-dimensional hydrogen-bonding network and to show the bulk properties of ice, the drastic slow ofτcf1andτcf2also implies the freezing process of water in site f1and f2, (cf. Tables 2 and 3), and the freezing temperature for samples B and C is between 235 and 245 K. Previous studies of the freezing of water in MCM-41 also indicate that the freezing temperature is around 235 to 245 K, depending on the pore size of samples.3,6From Figure 8, we can also conclude that there are about 3× 10²¹∼ 4× 10²¹water molecules/g of MCM-41 in site s. Moreover, the results of fast internal rotations of water molecules in those three sites indicate that sites f1and f2are more isolated than site s. It also indicates that the water molecules in sites f1and f2are not directly restricted by the surface. This implies that the only site in contact with the surface is site s. It has been TABLE 1: Parameters Used in Simulation for Sample A
temp Pf1/Ps Pf2/Ps τc f1 τ c f2 τ w τis τexf1s τexf1f2 S 200 K *a * * * >10-4 1.5 ( 0.1× 10⁻¹⁰ * * 0.026 ( 0.001 210 K * * * * >10-4 1.2 ( 0.1× 10⁻¹⁰ * * 0.026 ( 0.001 220 K * * * * 2.5 ( 0.5× 10⁻⁵ 9.5 ( 0.5× 10⁻¹¹ * * 0.026 ( 0.001 230 K * * * * 2.5 ( 0.6× 10⁻⁵ 8.5 ( 0.4× 10⁻¹¹ * * 0.025 ( 0.001 240 K * * * * 2.3 ( 0.3× 10⁻⁵ 7.5 ( 0.3× 10⁻¹¹ * * 0.025 ( 0.001 250 K <0.01 * * * 3.2 ( 0.8× 10⁻⁵ 3.8 ( 0.2× 10⁻¹¹ * * 0.022 ( 0.001 260 K 0.01 * * * 2.5 ( 0.5× 10⁻⁵ 3.8 ( 0.2× 10⁻¹¹ >10-3 * 0.020 ( 0.001 273 K 0.18 * 4.0 ( 0.2× 10-10 * 4.0 ( 0.4× 10⁻⁵ 2.0 ( 0.1× 10⁻¹¹ 1.5 ( 0.1× 10-4 * 0.018 ( 0.001
aAsterisks (*) indicate the physical phenomenon of the represented parameter was not observed.
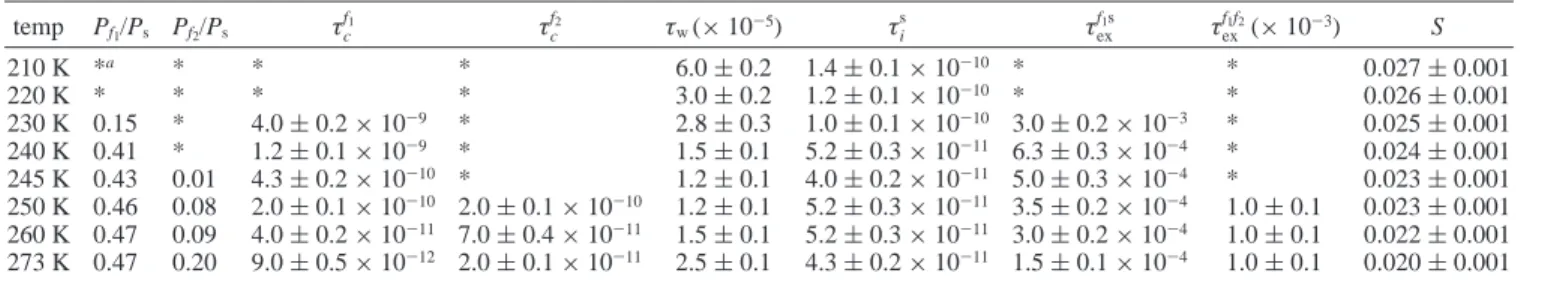
TABLE 2: Parameters Used in Simulation for Sample B
temp Pf1/Ps Pf2/Ps τc f1 τ c f2 τ w(× 10-5) τis τexf1s τexf1f2(× 10-3) S 210 K *a * * * 6.0 ( 0.2 1.4 ( 0.1× 10⁻¹⁰ * * 0.027 ( 0.001 220 K * * * * 3.0 ( 0.2 1.2 ( 0.1× 10⁻¹⁰ * * 0.026 ( 0.001 230 K 0.15 * 4.0 ( 0.2× 10-9 * 2.8 ( 0.3 1.0 ( 0.1× 10⁻¹⁰ 3.0 ( 0.2× 10-3 * 0.025 ( 0.001 240 K 0.41 * 1.2 ( 0.1× 10-9 * 1.5 ( 0.1 5.2 ( 0.3× 10⁻¹¹ 6.3 ( 0.3× 10-4 * 0.024 ( 0.001 245 K 0.43 0.01 4.3 ( 0.2× 10-10 * 1.2 ( 0.1 4.0 ( 0.2× 10⁻¹¹ 5.0 ( 0.3× 10-4 * 0.023 ( 0.001 250 K 0.46 0.08 2.0 ( 0.1× 10⁻¹⁰ 2.0 ( 0.1× 10⁻¹⁰ 1.2 ( 0.1 5.2 ( 0.3× 10⁻¹¹ 3.5 ( 0.2× 10⁻⁴ 1.0 ( 0.1 0.023 ( 0.001 260 K 0.47 0.09 4.0 ( 0.2× 10⁻¹¹ 7.0 ( 0.4× 10⁻¹¹ 1.5 ( 0.1 5.2 ( 0.3× 10⁻¹¹ 3.0 ( 0.2× 10⁻⁴ 1.0 ( 0.1 0.022 ( 0.001 273 K 0.47 0.20 9.0 ( 0.5× 10⁻¹² 2.0 ( 0.1× 10⁻¹¹ 2.5 ( 0.1 4.3 ( 0.2× 10⁻¹¹ 1.5 ( 0.1× 10⁻⁴ 1.0 ( 0.1 0.020 ( 0.001
aAsterisk (*) indicates the physical phenomenon of the represented parameter was not observed.
TABLE 3: Parameters Used in Simulation for Sample C temp Pf1/ Ps Pf2/ Ps τc f1 τ c f2 τ w τi s τex f1s τ ex f1f2 S 210 K *a * * * 5.0 ( 0.2× 10⁻⁵ 1.2 ( 0.1× 10⁻¹⁰ * * 0.025 ( 0.001 220 K 0.06 * 7.0 ( 0.4× 10-9 * 3.5 ( 0.2× 10⁻⁵ 1.2 ( 0.1× 10⁻¹⁰ 6.0 ( 0.3× 10-3 * 0.025 ( 0.001 230 K 0.56 0.05 5.0 ( 0.3× 10⁻⁹ 5.0 ( 0.3× 10⁻⁹ 3.0 ( 0.2× 10⁻⁵ 8.0 ( 0.4× 10⁻¹¹ 6.0 ( 0.3× 10⁻³ >1.0 0.024 ( 0.001 235 K 0.64 0.18 3.8 ( 0.2× 10⁻⁹ 3.8 ( 0.2× 10⁻⁹ 2.0 ( 0.1× 10⁻⁵ 6.0 ( 0.3× 10⁻¹¹ 9.0 ( 0.5× 10⁻⁴ 1.0 ( 0.1× 10⁻³ 0.024 ( 0.001 240 K 0.71 0.38 4.0 ( 0.2× 10⁻¹⁰ 4.0 ( 0.2× 10⁻¹⁰ 6.0 ( 0.5× 10⁻⁶ 6.0 ( 0.3× 10⁻¹¹ 3.5 ( 0.2× 10⁻⁴ 1.0 ( 0.1× 10⁻³ 0.020 ( 0.001 250 K 0.86 0.52 1.3 ( 0.1× 10⁻¹⁰ 1.3 ( 0.1× 10⁻¹⁰ 2.0 ( 0.3× 10⁻⁸ 6.0 ( 0.3× 10⁻¹¹ 2.5 ( 0.1× 10⁻⁴ 1.0 ( 0.1× 10⁻³ 0.020 ( 0.001 260 K 1.05 0.58 4.8 ( 0.3× 10⁻¹¹ 4.8 ( 0.2× 10⁻¹¹ 2.0 ( 0.3× 10⁻⁸ 6.0 ( 0.3× 10⁻¹¹ 2.5 ( 0.1× 10⁻⁴ 1.0 ( 0.1× 10⁻³ 0.020 ( 0.001 273 K 1.11 0.67 5.0 ( 0.3× 10⁻¹² 6.0 ( 0.3× 10⁻¹² 2.0 ( 0.3× 10⁻⁸ 6.0 ( 0.3× 10⁻¹¹ 1.5 ( 0.1× 10⁻⁴ 1.0 ( 0.1× 10⁻³ 0.020 ( 0.001
aAsterisks (*) indicate the physical phenomenon of the represented parameter was not observed.
Downloaded by NATIONAL TAIWAN UNIV on September 3, 2009 | http://pubs.acs.org
previously shown that silylated MCM-41 surfaces are very hydrophobic without significant adsorptions of water mole-cules.35-37 The probable adsorption centers on the MCM-41 surface for water adsorption are silanol groups. The total silanol groups on the MCM-41 surface have been investigated by29Si CPMAS.13The number of silanol groups on MCM-41 surface is around 7.2 × 10²⁰/g of MCM-41, and in our observation, there are 3× 10²¹∼ 4 × 10²¹water molecules/g of MCM-41 in site s. Thus, the ratio of water molecules to each silanol group is around 4 to 5 at 273 K. Lee et al. indicated that the water molecules in the vicinity of the surfaces participate in three hydrogen bonds with the surface silanol groups.38In our study, some of the water molecules may not interact with silanol groups directly. Recently, Smirnov et al. investigated the monolayer water structure on MCM-41 surface by X-ray diffraction.39 Although they have used a higher-surface-area MCM-41 than ours, they found around six water molecules in the vicinity of one silanol group which is in close agreement with our observation.
Order Parameter. As described in our three-site cone model, the order parameter S is the average over the orientational distribution due to the wobbling motion and also due to the available site arrangement for water to interact with the silanol groups on the pore surface of MCM-41. One may estimate the cone angle to be b ) 88°. Obviously, it is not feasible for water molecules, adjacent to the surface, to wobble with such a large angle. Hence, one can conclude that the small order parameter is due to the randomized site arrangement for water on the surface of MCM-41. According to molecular dynamics simula-tions by Lee et al., the orientation of water molecules on the silica surface is almost random,38which implies that the small magnitude of order parameter may mainly result from the orientational distribution of water molecules in site s.
The Wobbling Motion of D2O in the Slow Site. Most of the values of τw listed in Tables 1 to 3 are around 10-5 s. Although these values may violate the validity of spin relaxation theory, as we mentioned above, one still can judge the relative slowness of theτwprocess by comparing the intensity profiles of DQF spectra. The differences inτwfor samples A and B are negligible for all temperatures tested. However, the magnitude ofτwin sample C varies significantly between 235 and 250 K. This is related to the population differences among sites f1, f2, and s. Comparing sample B with sample C (cf. Tables 2 and 3), the site f2in sample C is more populated with water than that in sample B. Thus, it is reasonable to assert that water in site f1 in the former sample might be fully laden. Through collision, the translational diffusion of water in site f1 would result in momentum transfer to the bound water molecules, and therefore a fastτwprocess in site s. This is consistent with the observation of Takahara et al. that shows that part of the monolayer water has the same dynamic property as capillary-condensed water.3
Conclusion
The dynamics of D2O molecules on the MCM-41 surface have been investigated by DQF NMR and T1measurements. The solid-like pattern with 4 kHz edge splitting may reflect the presence of anisotropic interactions on the adsorption of pore sites. Moreover, the DQF spectral analysis provides detailed dynamic information on water mobility and related exchange processes. Thus, the division of water adsorbed on pore surface into slow motion and two fast motion components is consistent with the experimental observations. The amount of water distributed in each site depends on temperature and total water loading. The saturated water loading in site f1 increases the wobbling motion of water molecules in site s. Thus, translational diffusion of water in site f1results in the influence of a wobbling motion of water molecules in site s through collision.
Acknowledgment. This work was supported by the National Science Council of the Republic of China under Grant No. NSC 89-2113-M-002-033. We are thankful to Mr. Wen-Fong Cheng for his assistance in the preparation of high precision glassware. References and Notes
(1) Hansen, E. W.; Schmidt, R.; Sto¨cker, M.; Akporiaye, D. J. Phys.
Chem. 1995, 99, 4148.
(2) Morishige, K.; Kawano, K. J. Chem. Phys. 1999, 110, 4867, and pertinent references therein.
(3) Takahara, S.; Nakano, M.; Kittaka, S.; Kuroda, Y.; Mori, T.; Hamano, H.; Yamaguchi, T. J. Phys. Chem. 1999, B 103, 5814, and pertinent references therein.
(4) Turov, V. V.; Brei, V. V.; Khomenko, K. N.; Leboda, R.
Microporous and Mesoporous Mater. 1998, 23, 189.
(5) Morishige, K.; Nobuoka, K. J. Chem. Phys. 1997, 107, 6965. (6) Edler, K. J.; Reynolds, P. A.; White, J. W. J. Phys. Chem. 1998, B
102, 3676.
(7) Yu, T. Y.; Cheng, C. Y.; Hwang, D. W.; Huang, H. W.; Hwang, L. P. Appl. Magn. Reson. 2000, 18, 435.
(8) Overloop, K.; Van Gerven, L. J. Magn. Reson. A. 1993, 101, 179. (9) Akporiaye, D.; Hansen, E. W.; Schmidt, R.; Sto¨cker, M. J. Phys.
Chem. 1994, 98, 1926.
(10) Pfeifer, H. NMR - Basic Principles and Progress; Springer: Berlin, 1972; Vol. 7.
(11) Pfeifer, H. Phys. Rep. 1976, 26, 293. (Section C of Phys. Lett.) (12) Zibrowius, B.; Caro, J.; Pfeifer, H. J. Chem. Soc., Faraday Trans.
1 1988, 84, 2347.
(13) Zhao, X. S.; Lu, G. Q.; Whittaker, A. K.; Millar, G. J.; Zhu, H. Y.
J. Phys. Chem. 1997, B 101, 6525
(14) Chen, Y. H.; Hwang, L. P. J. Phys. Chem. 1999, B 103, 5070. (15) Jacobsen, J. P.; Bildsoe, H. K.; Schaumburg, K. J. Magn. Reson. 1976, 23, 153. There are some misprints in eq 32. The coefficient of〈D00
(2)〉
Figure 8. The plot of numbers of water molecules in site s per gram of MCM-41 vs temperature. In samples A, B, and C, the total water molecules per gram of MCM-41 are 3.03× 10²¹, 4.76 × 10²¹, and
8.33× 10²¹, respectively. For sample A, (9) indicates the numbers of
water molecules in site s. For sample B, (b) indicates the numbers of water molecules in site s. For sample C, (2) indicates the numbers of water molecules in site s.
Downloaded by NATIONAL TAIWAN UNIV on September 3, 2009 | http://pubs.acs.org
in J0(0) and J2(2ωr) should be corrected as -5 and 10/7 instead of -1 and
5x2/7 as printed, respectively.
(16) Eliav, U.; Navon, G. J. Magn. Reson. 1994, B 103, 19. (17) Eliav, U.; Shinar, H.; Navon G. J. Magn. Reson. 1992, 98, 223. (18) Sharf, Y.; Eliav, U.; Shinar, H.; Navon, G. J. Magn. Reson. 1995,
B 107, 60.
(19) Shinar, H.; Seo, Y.; Navon, G. J. Magn. Reson. 1997, 129, 98. (20) Stapf, S.; Kimmich, R. J. Chem. Phys. 1995, 103, 2247. (21) Brainard, J. R.; Szabo, A. Biochemistry 1981, 20, 4618. (22) Blum, K. Density Matrix Theory and Applications; Plenum: New York: 1981.
(23) Ernst, R. R.; Bodenhausen, G.; Wokan, A. Principles of Nuclear
Magnetic Resonance in One and Two Dimensions; Clarendon: Oxford,
U.K., 1987.
(24) Price, W. S.; Ge, N. H.; Hong, L. Z.; Hwang, L. P. J. Am. Chem.
Soc. 1993, 115, 1095.
(25) Wong, T. C.; Wang, P. L.; Duh, D. M.; Hwang, L. P. J. Phys.
Chem. 1989, 93, 1295.
(26) Woessner, D. E. J. Chem. Phys. 1964, 40, 2341.
(27) Edmonds, D. T.; Mackay, A. L. J. Magn. Reson. 1975, 20, 515.
(28) Edmonds, D. T.; Goren, S. D.; Mackay, A. L.; White, A. A. L.; Sherman, W. F. J. Magn. Reson. 1976, 23, 505.
(29) Edmonds, D. T.; Goren, S. D.; White, A. A. L.; Sherman, W. F. J.
Magn. Reson. 1976, 27, 35.
(30) Lang, E.; Ludemann, H.-D. Ber. Bunsen-Gezs. Phys. Chem. 1980,
84, 462.
(31) Davidson, E. R.; Morokuma, K. Chem. Phys. Lett. 1984, 111, 7. (32) Eggenberger, R.; Gerber, S.; Huber, H.; Searles, D.; Welker, M. J.
Chem. Phys. 1992, 97, 5898.
(33) Struis, R. P. W. J.; De Bleijser, J.; Leyte, J. C. J. Phys. Chem. 1987, 91, 1639.
(34) Nakahara, M.; Wakai, C. J. Mol. Liq. 1995, 65/66, 149. (35) Kinney, D. R.; Chuang, I.-S.; Maciel, G. E. J. Am. Chem. Soc. 1993, 115, 6786.
(36) Chuang, I.-S.; Maciel, G. E. J. Am. Chem. Soc. 1996, 118, 401. (37) Turov, V. V.; Mironyuk, I. F. Colloids Surf. 1998, A 134, 257. (38) Lee, S. H.; Rossky, P. J. J. Chem. Phys. 1994, 100, 3334. (39) Smirnov, P.; Yamaguchi, T.; Kittaka, S.; Takahara, S.; Kuroda, Y.
J. Phys. Chem. 2000, B 104, 5498.
Downloaded by NATIONAL TAIWAN UNIV on September 3, 2009 | http://pubs.acs.org