董監事暨重要職員責任保險對股票投
資人盈餘品質認知的影響
The Effect of Directors’ and Officers’ Liability Insurance
on Stock Investors’ Perceptions of Earning Quality
廖秀梅 Hsiu-Mei Liao 銘傳大學 會計系
Department of Accounting, Ming Chuan University
湯麗芬1
Li-Fen Tang
致理科技大學 會計資訊系
Department of Accounting Information, Chihlee University of Technology 李建然 Jan-Zan Lee
國立臺北大學 會計學系
Department of Accountancy, National Taipei University
摘要:本文從股票投資人的觀點,探討董監事暨重要職員責任保險(簡稱 D&O 保險)對其盈餘品質認知之影響,股票投資人對盈餘品質的認知則以盈餘反應 係數衡量。本文以 2008 年至 2010 年為研究期間,採用內生性二元處理模型 並輔以多種估計方法,分離自我選擇效果後,實證結果發現,相對於未購買 D&O 保險的公司,有購買 D&O 保險的公司,盈餘反應係數較低;進一步實 證結果也發現,有購買 D&O 保險的公司,D&O 投保金額愈大,盈餘反應係 數會愈低,而且當公司超額投保的金額愈大,盈餘反應係數會進一步惡化。 本文實證結果意味著股票投資人認為公司購買 D&O 保險可能會造成董監事 與管理階層的道德風險增加,反而不利於盈餘品質,進而降低盈餘資訊反應 在股價的程度。 關鍵詞:董監事暨重要職員責任保險;盈餘反應係數;內生性二元處理
Abstract:Using the earnings response coefficients (ERC hereafter) as a proxy for
stock investors’ perceptions of earnings quality, this study examines the effect of
1 Corresponding author: Department of Accounting Information, Chihlee University of
Technology, New Taipei City, Taiwan, E-mail: [email protected]
directors’ and officers’ liability insurance (D&O insurance hereafter) on the ERC. Using publicly-available D&O insurance data for public firms in Taiwan from 2008 to 2010, we employ an endogenous binary treatment model and other methods to control self-selection bias on the estimation of relationship between D&O insurance and ERC. The empirical results show that firms with D&O insurance have lower ERC than those without D&O insurance. In addition, we find that firms with higher D&O insurance coverage have lower ERC and firms with higher abnormal D&O insurance coverage will further deteriorate the ERC. These results imply that stock investors believing the purchase of D&O insurance may increase the risk of moral hazard from directors and officers, as it is not conducive to earnings quality, and their earnings information on responses to stock prices will thereby be reduced.
Keywords: Directors and officers liability insurance; Earnings response
coefficients; Endogenous binary treatment model
1. Introduction
This study examines the effect of directors’ and officers’ (or managers’) liability insurance (D&O insurance hereafter) on perceived earnings quality from the perspective of stock investors. We use the earnings response coefficients (ERC hereafter) as a proxy for stock investors’ perceptions of earnings quality. In recent years, a series of domestic and international financial scandals have been reported2. The quality of financial statements is therefore being questioned by general investors. Some were involved with financial reporting frauds and some emptied the firm’s assets, resulting in the firm going to bankruptcy. Without getting their investment back, many investors have suffered significant damages. In order to implement the corporate governance system and to protect the interests of investors,
2 For example, after scandal of some famous firms like Enron, World Com, Xerox, Merck etc., global investors have been called into question about and attentive to the impartiality on the global capital markets. Similar cases also have occurred in Taiwan since 2004, such as Bardon and other listed firms were suspected to empty funds, accounting fraud cases. These cases became known as Taiwan Enron scandal, seriously affecting the domestic financial order is a very huge scale.
public firms in many countries are enforced to purchase D&O insurance. Currently, the securities authority in Taiwan has not yet required firms listed in Taiwan Stock Exchange (TWSE here after) and Gre Tai Securities Market (GTSM here after) to purchase D&O insurance. Nevertheless, in the 2003 version of “Corporate Governance Best-Practice Principles for TWSE/GTSM listed firms”, directors and officers are encouraged to purchase liability insurance3. According to our survey, from 2008 to 2010 more than 50 percent of public firms have purchased D&O insurance, and the number of firms purchasing D&O insurance has been growing steadily year by year.
Board of directors and officers serve as one of the important elements of corporate governance, a key role to have a full play of good corporate governance. The purchase of D&O insurance for directors’ and officers’ liability can provide safeguards against litigation risk, and attract more talented directors and officers. Thus, D&O insurance will enhance the effectiveness of corporate governance (Bhagat, Brickley and Coles, 1987; Holderness, 1990; Daniels and Hutton, 1993; Chen and Pang, 2008; Chen and Chang, 2011). On the other hand, the purchase of D&O insurance also transfers certain risks of legal liability to the insurance company4, and may increase the risk of moral hazard from directors and officers. The legal liability is an important mechanism to urge directors and officers to fulfill
3
According to the Article 39 of the Corporate Governance Best-Practice Principles for TWSE/GTSM listed firms, listed firms may take out D&O insurance for directors with respect to their liabilities resulting from exercising their duties during their terms of occupancy, so as to reduce and spread the risk of material harms to the firm and shareholders arising from the wrong doings or negligence of directors.
4
In accordance with the regulations of Article 23 and 34 of the Company Act, directors and officers shall faithfully execute business and pay attention to perform the obligations of business as good administrators. If there is any violation causing damage, the firm shall be responsible for damage and responsibility. In addition, according to the regulations of Article 20 and 32 of the Securities Exchange Act, the issuer and representative of the firm shall not have misrepresentations or concealments of the contents concerning to raising the securities, distribution, or sale of private equity, financial reports and other relevant business documents. Anyone who violated above provisions shall be liable for damages sustained by bona fide purchasers or sellers of said securities. D&O insurance coverage includes the investigation costs, defense costs, settlement and compensation for the loss of the judgment expenses incurred and paid by directors and officers, when directors and officers or key staff perform their duties because of error, omission, negligence, breach of duty, trust violation, false or misleading statements and other acts and a third party put forth a request for compensation arising from personal liability.
their agent responsibilities entrusted by shareholders. Once the legal liability of directors and officers declines, it may make directors and officers less likely to be fully engaged in the operation and supervision of the firm. Thus, D&O insurance may reduce the effectiveness of corporate governance (Chalmers, Dann and Harford, 2002; Gutierrez, 2003; Baker and Griffith, 2007; Chung and Wynn, 2008; Wynn, 2008). Since D&O insurance may affect the effectiveness of corporate governance, and change the legal liability of directors and officers, both corporate governance and legal liability will influence earnings quality. Therefore, understanding the effect of D&O insurance on earnings quality is an issue worth exploring.
Stock investors must rely on financial statements to assess a firm value, and the trust of financial statements by stock investors can be judged by the ERC. The effect of D&O insurance on the ERC can infer how stock investors perceive the effect of earnings quality for the purchase of D&O insurance. Prior studies have indicated that higher earnings quality would have higher ERC (Holthausen and Verrecchia, 1988; Teoh and Wong, 1993; Schipper and Vincent, 2003). If stock investors believe that the purchase of D&O insurance is conducive to earnings quality, their earnings information on responses to stock prices will be enhanced, which makes the ERC become higher; conversely, if investors believe the purchase of D&O insurance is not conducive to earnings quality, then vice versa.
Prior studies on this subject are lacking. Although European and American countries have implemented the D&O insurance system for many years, the information on D&O insurance is not publicly available. Prior studies on D&O insurance are mostly concentrated on the countries (e.g., Canada, UK), where D&O insurance information is disclosed upon requested5. For example, some studies have adopted Canada as the object of research to explore the association between D&O insurance and IPO (Initial Public Offering) price, earning conservatism, or voluntarily disclosure (Chalmers, Dann and Harford, 2002; Chung and Wynn, 2008;
5
After the 1989 revised Companies Act in UK, its listed firms were allowed to purchase D&O insurance and listed firms were required to disclose relevant information about D&O insurance in the annual report since 1990. The Toronto Stock Exchange in 1993 also required its listed firms to disclose the relevant information about D&O insurance.
Wynn, 2008). These findings show that D&O insurance is negatively associated with stock returns after three years of IPO and earnings conservatism (Chalmers, Dann and Harford, 2002; Chung and Wynn, 2008); firms with abnormal D&O insurance coverage are less likely to report bad news forecasts (Wynn, 2008). In other words, the empirical results of these studies seem to mean that although D&O insurance may lower the directors’ and officers’ legal liability, it may also motivate the directors and officers to engage in opportunistic earnings management. Thus, D&O insurance may not be conducive to earnings quality.
Information on D&O insurance in Taiwan was not publicly available in the past, which limits the researchers’ surveys and analyses on related issues, such as questionnaires used to collect D&O insurance information by domestic scholars6 ( i.e., Chen and Pang, 2008; Chen and Li, 2010; Chen and Chang, 2011). So far, no domestic studies have investigated that whether the purchase of D&O insurance will affect stock investors’ perceptions of earnings quality. In order to strengthen the disclosure of relevant information on corporate governance, the security authority in Taiwan requires public firms to disclose the D&O insurance information in the market observation post system from 20087, enabling academia to get more accurate and comprehensive information on D&O insurance. Using publicly-available D&O insurance data for public firms in Taiwan from 2008 to 2010, this study examines the effect of D&O insurance on the ERC.
The empirical results show that the purchase decision of D&O insurance shows significant self-selection bias. We employ an endogenous binary treatment model8 (EBTM hereafter) and other methods to control self-selection bias on the
6 Chen and Pang (2008) and Chen and Li (2010) issue questionnaires in a way of data collection on D&O insurance in 2004, and total sample collection are 105 firms, in which just 35 firms have insured D&O insurance. In addition, Chen and Chang (2011) issue questionnaires to 1,225 listed firms in a way of data collection on D&O insurance in 2008, and total sample collection are just 299 firms.
7 Upon inquiry of a number of relevant employees in insurance companies (e.g., Cathay Century Insurance Co., Ltd.; Fubon Property & Casualty Insurance Co., Ltd.; Federal Insurance Co.), we find that practically, the objects of D&O insurance contains all the directors and officers, and they are in the same piece of D&O insurance policy.
8 EBTM employs simultaneous equation for estimation. Villalonga and Amit (2006) examine the effect of family ownership and control on firm value, Lee and Lin (2013) explore whether Taiwan big accounting firms are better than non-big accounting firms, both studies use EBTM.
estimation of the relationship between D&O insurance and the ERC. The empirical results of these models show that firms with D&O insurance have lower ERC than those without D&O insurance. In addition, we find that firms with higher D&O insurance coverage have lower ERC and those with higher abnormal D&O insurance coverage will further deteriorate the ERC. The empirical results tend to support the argument that stock investors believing the purchase of D&O insurance for directors and officers liability will transfer part of potential litigation risk to the insurance company. It may weaken directors and officers required attention to ensure reliable financial reports, as it is not conducive to earnings quality, and their earnings information on responses to stock prices will thereby be reduced. These results will be robust after we conduct several sensitive analyses.
This study offers several important contributions to the existing literature. First, using a more complete and accurate analysis on publicly-available D&O insurance data, this study provides evidence about the effect of D&O insurance on stock investors’ perceptions of earnings quality, The findings of this study will not only fill the deficiency in the existing domestic literature in this regard, but also upgrade the effectiveness of domestic D&O insurance studies. Second, prior international studies mainly focus on the effect of D&O insurance on the real earnings quality (e.g., earnings conservatism or voluntarily disclosure). Empirical results of social science have been deeply influenced by the national legal environment, agency problems, corporate governance, and some other factors. Prior studies have shown that the legal environment in Taiwan have been quite different from that in European and American countries9. Therefore, the effect of D&O insurance for domestic firms may not be the same. Truly, the studies and data analyses are to be carried out in consideration of Taiwan’s environmental factors. The findings of this study can serve as cross-country comparisons between the effect of D&O insurance on different earnings quality (e.g., earnings conservatism,
9
Such as in views of domestic legal environment, directors and officers and key executive involved in litigation may not be as frequent as in European countries and America; domestic firms are in prevalence of controlling shareholders, and board of directors has strong affiliations with family members; the main agent problem is related to the conflict of interest between control shareholders and external shareholders (called core agency problem), and the corporate governance environment is not as sound as that of the European countries and America.
voluntarily disclosure or earnings management).
Third, the findings of this study also can provide a reference to securities authority in the implementation of D&O insurance, a reference to firms in the purchase decision of D&O insurance and a reference to stock investors in assessment of the effect of D&O insurance on stock returns. Finally, public firms purchasing D&O insurance is still a voluntary decision. In other words, the purchase decision of D&O insurance is an endogenous variable. Thus, we adopt many self-selection estimation methods, such as the maximum likelihood method, Heckman two-stage approach, and propensity score matching method to analyze. The methods used in this study will serve as a reference for the future studies on the control over self-selection bias.
The remainder of the paper is organized as follows. Section 2 develops our research hypotheses, describes the research model and variables measurement. Section 3 describes sample selection and data. Section 4 presents the empirical results, and Section 5 concludes.
2. Research Hypotheses and Research Design
2.1 Research Hypotheses
Board of directors and officers serve as one of the important components of the corporate governance, so that D&O insurance is an important part of corporate governance. However, prior literature exposes two opposing arguments of D&O insurance on corporate governance. Proponents argue that D&O insurance provides indirect supervision from the insurance company on insured firms in corporate governance and operation10 (Holderness, 1990; Baker and Griffith, 2007; Chen and Pang, 2008). D&O insurance also have a significant influence over the structure of board of directors, For example, the subjects of D&O insurance are all directors. Once any director has a personal deviated behavior, all the right and reputation of
10
Before the underwriting process, in the period of insurance and litigation, the insurance company would be prudent in underwriting process and do damage prevention, indirect supervision of insured firms in corporate governance and operation.
whole directors will be affected. In this way, the purchase of D&O insurance will promote mutual supervision among directors, and attract excellent or reputed independent directors and officers to be involved in the operation; D&O insurance thereby strengthens the function of corporate governance, and increases the interests of shareholders (Bhagat, Brickley and Coles, 1987; Holderness, 1990; Daniels and Hutton, 1993; Chen and Pang, 2008; Chen and Chang, 2011).
On the other hand, opponents argue that D&O insurance will transfer part of the potential litigation risk to the insurance company, which may make the directors and officers are less likely to be fully engaged in the operation or in the reliability of the financial reporting (moral hazard); D&O insurance thereby reduces the effectiveness of corporate governance and even increases probability of shareholders’ claims (Gutierrez, 2003; Baker and Griffith, 2007).
Therefore, the purchase of D&O insurance also has two opposing effects on earnings quality. First, since D&O insurance will make the insurance company supervise the insured firm’s corporate governance and operating conditions as underwriting basis. When the insured firm’s earnings quality is better, the risk of litigation gets lower, and premiums will be lower as well. Therefore, the insured firms will report better earnings quality in order to reduce premiums. Second, since the firm purchasing D&O insurance is relatively easy to recruit excellent or reputed independent directors and officers. Meanwhile they will intend to protect their reputation as to ask for the firm reporting better earnings quality (Beekes, Pope and Young, 2004; García Lara, García Osma and Peñalva, 2009), and they will also supervise the behaviors of other directors and officers in order to avoid the risk of litigation. In addition, prior studies find that after the firm purchasing D&O insurance, it thereby results in a higher expected value of litigation for shareholders (or other stakeholders), the probability of litigation will increase (Gutierrez, 2003; Baker and Griffith, 2007). Hence, directors and officers in order to reduce litigation costs, and reported earnings quality will be better11. To analyze from the above perspective, the purchase of D&O insurance seems to enhance earnings quality.
11
Such inference is the same as Dye (1993) states that big accounting firms are more capable of compensation, users of financial statements would be more likely to sue big accounting firms, so big accounting firms may avoid high litigation risk by keeping a better audit quality.
However, due to D&O insurance will transfer part of the potential litigation risk of directors and officers to the insurance company, directors and officers thus are more likely to engage in speculative behaviors, less emphasis on the quality of financial reporting, which may result in a poor earnings quality. For example, Chung and Wynn (2008) find that D&O insurance is negatively associated with earnings conservatism; Chalmers, Dann and Harford (2002) find that D&O insurance is negatively associated with stock returns after three years of IPO; Wynn (2008) finds that firms with abnormal D&O insurance coverage are less likely to report bad news forecasts. In other words, to analyze from the point of views, the purchase of D&O insurance seems to reduce earnings quality.
Prior studies have indicated that higher earnings quality would have higher ERC (Holthausen and Verrecchia, 1988; Teoh and Wong, 1993; Schipper and Vincent, 2003), then vice versa. If stock investors believe that the purchase of D&O insurance may enhance the effectiveness of corporate governance and be conducive to earnings quality, then their earnings information on responses to stock prices (ERC) will be enhanced. Conversely, if stock investors believe the purchase of D&O insurance may reduce the effectiveness of corporate governance and deteriorate earnings quality, then the ERC will be weakened. Therefore, we do not predict the direction of the effect of D&O insurance on the ERC, the research hypotheses of this study are established as follows (stated in the alternative hypothesis):
H1: D&O insurance is correlated with the magnitude of the earnings
response coefficients (ERC).
2.2 Research Models and Variables Measurement
As mentioned above, there are still no enforcements that public firms shall purchase D&O insurance, which is still a voluntary decision. Prior studies find that the selection of D&O insurance is related to the firm’s traits (Core, 1997; O’Sullivan, 2002; Chung and Wynn, 2008; Chen and Pang, 2008)12; in other words, whether purchasing D&O insurance is not a random distribution (Chung and Wynn,
12
For example, the firm purchasing D&O insurance has a lower financial risk; directors and officers are risk averters, such firms are less likely to manipulate earnings.
2008). If only D&O insurance is seen as exogenous variable, using the ordinary least squares (OLS hereafter) to explore the association between D&O insurance and ERC, the results obtained may be only the firm’s traits (not caused by the selection of D&O insurance)13. Therefore, in order to control self-selection bias, we adopt EBTM for estimation to separate self-selection effect.
Most of the literature in estimating EBTM usually adopt the two-stage estimation by Heckman (1979). Nevertheless, Lennox, Francis and Wang (2012) find that the estimated results of the two-stage approach are likely to have changed due to slight differences of the selection of model setting, and have lack of robustness. They suggest adopting the maximum likelihood method. Thus, we use the maximum likelihood method which serves as a way of main estimation. To avoid bias in making conclusions, we also adopt other self-selection estimation methods, such as the Heckman two-stage approach and propensity score matching method (used by Lawrence, Minutti-Meza and Zhang, 2011) in our sensitivity tests.
In order to assess the effect of D&O insurance on the ERC14, we set up a D&O insurance Probit model and the ERC model, based on D&O insurance demand (Holderness, 1990; Core, 1997; O’Sullivan, 2002; Chung and Wynn, 2008; Zou et al., 2008; Chen and Pang, 2008) and ERC literature (Collins and Kothari, 1989; Lipe, 1990; Teoh and Wong, 1993; Gelb and Zarowin, 2002; Ghosh and Moon, 2005; Ali, Chen and Radhakrishnan, 2007; Chi et al., 2009; Lee and Chen, 2012), respectively to the following equations (1) and (2). We employ the maximum likelihood method of a simultaneous regression model for estimation15.
13
OLS estimated results also include self-selection effect and treatment effect; only treatment effect is in response to choosing D&O insurance to ERC (Lee and Lin, 2013).
14 Prior studies often use ERC in accounting earnings and stock returns in the regression model to measure stock investors’ perceptions of earnings quality. The magnitude of ERC depends on the level of earnings quality; when earnings contain less noise, and then the ERC is higher (Warfield, Wild and Wild, 1995; Schipper and Vincent, 2003; Ghosh and Moon, 2005).
15 Maximum likelihood method is to use the likelihood ratio test (LR test) to test data whether there is a self-selection bias; when correlation coefficients of two residual terms ( ) in equation (1) and (2) are significantly different from zero, it represents that there exists a self-selection bias in the empirical data, and the simultaneous regression model can be applied to correct the effect of self-selection bias. Conversely, when the LR test cannot reject =0, it represents that a self-selection bias is not taken into account. We can directly estimate equation (2) by employing OLS regression.
ρ
ρ
(1) D&O selection model: μ YEAR α it it 15 it 14 it 13 it 12 it 11 it 10 it 9 it 8 it 7 it 6 it 5 it 4 it 3 it 2 it 1 0 it BONUS α MGTOWN α CONTROLOWN α CONTROL α INDDIR α SIZE α STOCK α INDUSTRY α ECB α GDR α GROWTH α RESTATE α LEV α ROA α BETA α α Pr(DO) ∑ + + + + ++ + + + + + + + + + + + = η (1) (2) ERC model: it it 17 it 16 it 15 it 14 it 13 it 12 it 11 it it 10 it it 9 it it 8 it it 7 it it 6 it it 5 it it 4 it it 3 it 2 it 1 0 it LEV SIZE BETA PERSIST GROWTH 4 BIG AGE LEV UE SIZE UE BETA UE PERSIST UE GROWTH UE 4 BIG UE AGE UE DO UE DO UE SCAR ε β β β β β β β β β β β β β β β β β β + + + + + + + + × + × + × + × + × + × + × + × + + + = (2)
The variables and measurements of D&O insurance choice models in equation (1) are described as follows: The dependent variable DO is a category variable: if the firm purchases D&O insurance, its DO is 1; otherwise, DO is 0. We follow the prior studies related to D&O insurance demand (Holderness, 1990; Core, 1997; O’Sullivan, 2002; Chung and Wynn, 2008; Zou et al., 2008; Chen and Pang, 2008) by incorporating the following independent variables including litigation risk, firm size and corporate governance into equations (1). Prior studies find that when the financial risk is greater, directors and managers of risk aversion will be more likely to ask the firm to purchase D&O insurance, and increase the coverage of insurance as risk compensation. Proxy variables of financial risk included in our model are beta risk (BETA, measured by market model using the data of past 24-60 monthly stock returns), return on total assets (ROA, measured by net income after tax divided by total assets), debt ratio (LEV, measured by total liabilities divided by total assets), and financial statement restatement (RESTATE, measured by 1 if the firm incurred financial statement restatements, and 0 otherwise) variables.
Prior studies also find that the firm with a greater growth opportunity will be faced with a higher litigation risk. In this way, the firm is more likely to purchase D&O insurance, and avoids an underinvestment problem (Core, 1997; O’Sullivan, 2002; Zou et al., 2008). We use market value to book value (GROWTH, measured by sum of market value of equity plus total liabilities and then divided by total assets) to be a proxy variable for growth opportunities. Because the legal environments and liabilities abroad are more severe than these in Taiwan, firms
with overseas fund-raising activities and foreign sales-oriented high-tech industries may be faced with greater risks of litigation. In the past, domestic firms purchasing D&O insurance are focused on the electronics industry or issuing Global Depositary Receipts (GDR) or Euro-Convertible Bond (ECB). We predict that firms with overseas fund-raising activities and in electronics high-tech industries have greater demand for D&O insurance. Thus, we include a dummy variable of overseas securities (GDR or ECB, measured by 1 if the firm has issued GDR or ECB, and 0 otherwise) and a dummy variable of electronics industry (INDUSTRY, measured by 1 if the firm is in the electronics industry, and 0 otherwise). The higher the number of shareholders, the greater the chance of facing the shareholders’ claims; thus the firm is more likely to purchase D&O insurance (Zou et al., 2008; Chen and Pang, 2008), so we also include the number of shareholders (STOCK, measured by natural log of the number of shareholders) in our model. Prior studies also find that the greater damages to shareholders of large firms can be expected and the higher the probability of the occurrence of litigation will be; therefore, it is a larger demand for D&O insurance for large firms (Core, 1997). However, some studies indicate that large firms have higher real-service efficiencies16 and lower bankruptcy costs, which then reduce D&O insurance demand (Mayers and Smith, 1990; O’Sullivan, 2002). Thus, we include a firm size (SIZE, measured by natural log of total assets) in our model, but we don’t predict the direction of SIZE.
Prior studies also find that most of independent directors are risk averters; they usually require the firm to purchase D&O insurance, and D&O insurance can also help firms recruit excellent independent directors (O’Sullivan, 2002; Zou et al., 2008). Therefore, we include the ratio of independent directors (INDDIR) in our model. When the shareholdings of controlling shareholder or managers are higher, they will maximize their own utilities, and the interests of external shareholders may be more likely to be ignored. Hence, the firm with higher agency costs is more likely to purchase D&O insurance for increasing personal remuneration (Core, 1997; Zou et al., 2008). On the other hand, prior studies also find that when the
16
Mayers and Smith (1990) state that the insurance company provides lower cost of litigation services in response to economic scale and specialization, so it has more real-service efficiencies. Because small firms have lack of professionals, purchasing insurance is relatively favorable.
shareholdings of controlling shareholders or managers are higher, they align themselves with the external stockholders’ interests, which reduce the risk of litigation. In addition, they also need to share more the insurance cost. Hence, the firm with higher agency costs is less likely to purchase D&O insurance (Core, 1997). We include the ratio of ultimate controller (CONTROL), the percentage of shares held by ultimate controller (CONTROLOWN) and managers (MGTOWN) in our model; however, we do not predict the directions of CONTROL,
CONTROLOWN and MGTOWN. D&O insurance is a part of the total
remunerations of directors and officers, namely substitutes that D&O insurance and other forms of remunerations; when other remunerations of directors and officers increase, the D&O insurance demand will be reduced (Core, 1997); on the other hand, higher remunerations of directors and officers implies the responsibilities and risks of directors and officers will be greater and D&O insurance demand will be greater as well (Chen and Pang, 2008). We include the remunerations of directors and officers (BONUS, measured by natural log of the remunerations of directors and officers) in our model, but we do not predict the direction of BONUS. Finally, we include the year dummy variables (YEAR) in our model to control the year effect.
The variables of the ERC model used in equation (2) are described as follows: we use standardized cumulative abnormal returns as the dependent variable (SCAR). We adopt market model17 to estimate the cumulative abnormal returns, and then calculate the standardized cumulative abnormal returns18. According to prior studies, cumulative abnormal returns can be divided into two periods, including the corresponding accounting announcement period and accounting period (Basu,
17
The estimation period is 60 months prior to that year; if less than 60 months, actual number of months would be an estimation period, but it should be at least 24 months.
18
Shen and Lee (2000) point out that the variability of each firm’s stock price is not the same, non-standardized cumulative abnormal returns as dependent variable have a heteroscedasticity problem. So in prior studies, abnormal returns of individual securities first be standardized (abnormal returns of individual securities are divided by standard deviation of the abnormal returns) and then average and cumulate them. It aims at having distribution of all abnormal returns of individual securities, all transferred to a unit normal distribution. It therefore can help improve the ability to test the abnormal returns, especially under weak share prices (Patell, 1976; Ziebart, 1985; Boehmer, Musumeci and Poulsen, 1991).
1997). We use three patterns to measure standardized cumulative abnormal returns: respectively (1) from January of fiscal year t to April of fiscal year t+1, 16 months of standardized cumulative abnormal returns (SCAR16)19; (2) from January of fiscal year t to December, 12 months of standardized cumulative abnormal returns (SCAR12) and (3) from May of fiscal year t to April of fiscal year t+1, 12 months of standardized cumulative abnormal returns (SCAR12_May). In addition, for the robustness of our results, the sensitivity tests are conducted with non-standardized cumulative abnormal returns (CAR16, CAR 12 and CAR12_May), and accumulated to the end of March20, 15 months’ and 12 months’ standardized abnormal returns respectively (SCAR15, SCAR12_Apr).
In regard to the measurement of the independent variable, we adopt random walk model to measure the expected earnings (Teoh and Wong, 1993; Ghosh and Moon, 2005; Ali, Chen and Radhakrishnan, 2007; Chi et al., 2009; Lee and Chen, 2012), so unexpected earnings (UE) is that income from continuous operations in year t minus the income from continuing operations in year t-1 and then scaled by the market value of equity. The experimental variable (DO) is a dummy variable; if the firm purchases D&O insurance, its DO is 1; otherwise 0. According to the prediction of the hypothesis in this study, if the stock investors believe that the purchase of D&O insurance will deteriorate earnings quality, we expect that the coefficient on UE×DO in equation (2) to be negative. Conversely, if the stock investors believe that the purchase of D&O insurance will improve earnings quality, the coefficient on UE×DO should be positive. The control variables are defined as follows: older firms are more likely stable with less information asymmetry problems, which suggests higher ERC (Ghosh and Moon, 2005). We include listed ages (AGE) in our model. We control for Big4 because large auditors are generally
19
The reason to choose the 16-month standardized cumulative abnormal returns is the information on earnings is announced in the next year. Therefore, we try to calculate standardized cumulative abnormal returns in a period extending from 12 months afterwards, trying to capture the market reaction after the firm’s prior year earnings announcement (Lee and Chen, 2012).
20
According to the regulations before 2012, annual earnings information audited by an auditor should be announced by the end of April of the following year at the latest, but practically, annual earnings information of the firm are mostly known by the end of March. In addition, the April stock prices information may still be interfered by the earnings information of the first quarter declared by the firm (Lee and Chen, 2012).
associated high-quality audit (Teoh and Wong, 1993). Big4 is a dummy variable (BIG4) that equals 1 when the auditor is Big4 accounting firm, and 0 otherwise. When the firm has higher economic growth opportunities, the chance of earnings growth will relatively increase, so the ERC will be larger (Collins and Kothari, 1989). Growth opportunities (GROWTH) is the sum of the market value of equity and the book value of debt, and then scaled by total assets. Earnings persistence (PERSIST) is measured by the reciprocal of PE ratio; if the ratio is lower (i.e., high PE ratio), it indicates that the current earnings level is understated, which suggests lower ERC (Gelb and Zarowin, 2002; Lee and Chen, 2012). System risk (BETA) is an important factor in determining the firm’s expected returns. When the firm faces a higher system risk, the required rate of return by market (i.e., discount rate) is also higher. The present value of future cash flows will be smaller, and beta risk is negatively correlated with the ERC (Collins and Kothari, 1989; Lipe, 1990). We measure systematic risk by market model using the data of past 24-60 monthly stock returns. Firm size (SIZE) may represent a number of factors, such as agency costs, information environment costs and political costs. Prior studies find that the association with size and ERC is not consistent21, but it is often used to control as a proxy variable of other missing variables. We measure SIZE by the natural log of total assets. Finally, the firm with a high leverage is more likely to manipulate earnings to avoid possible debt-covenant violations (Ali, Chen and Radhakrishnan, 2007). We include the debt ratio (LEV), measured by total liabilities divided by total assets, in our model.
3. Sample Selection and Data
In order to strengthen disclosure about corporate governance, the securities authority required TWSE/GTSM listed firms to disclose D&O insurance information in the Market Observation Post System from 2008. We construct a sample from the firms listed on both the TWSE and GTSM from 2008 to 2011. We
21
For example, Warfield, Wild and Wild(1995) find that the firm size is positively correlated with ERC, but Teoh and Wong (1993) point out that firm size is negatively correlated with ERC, Easton and Zmijewski (1989) find that the firm size is not associated with ERC.
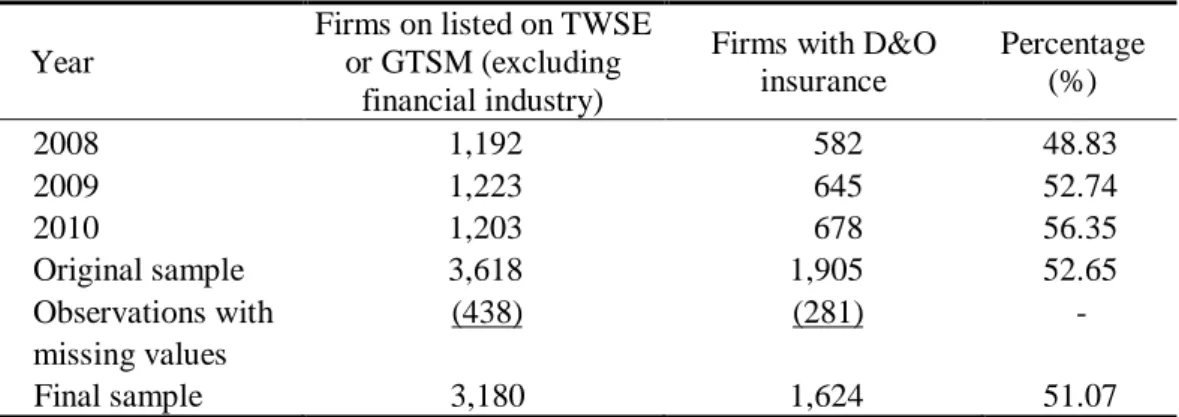
exclude the finance, insurance and securities industries. Our data collect from financial, stock and corporate governance database of Taiwan Economic Journal (TEJ hereafter). Our full sample contains 3,180 observations after excluding observations with missing value in variables. Table 1 presents selection procedure of sample and distribution of firms purchasing D&O insurance. From Table 1, we find 1,905 and 1,624 observations to purchase D&O insurance in original sample and final sample during the period of 2008 – 2010, which are 52.65 and 51.07 percent of the entire sample respectively. Furthermore, the firms purchasing D&O insurance have been showing a steady growth annually (from a 48.83% increase to a 56.35%).
Table 1 Sample Selection Year
Firms on listed on TWSE or GTSM (excluding
financial industry)
Firms with D&O insurance Percentage (%) 2008 1,192 582 48.83 2009 1,223 645 52.74 2010 1,203 678 56.35 Original sample 3,618 1,905 52.65 Observations with missing values (438) (281) -Final sample 3,180 1,624 51.07
4. Empirical Results
4.1 Descriptive Statistics
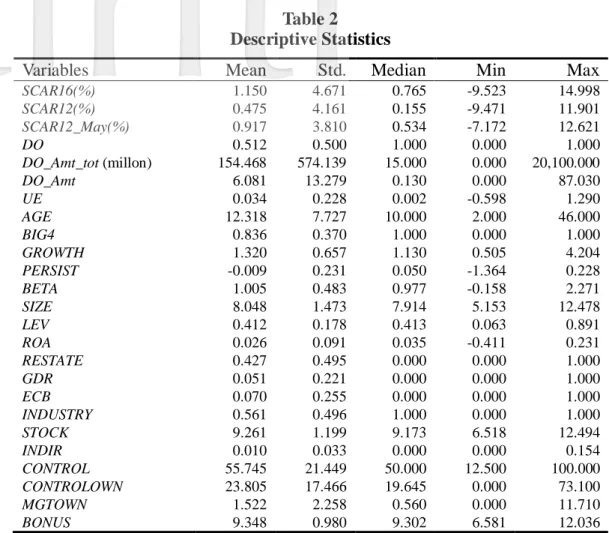
To control the influence of outliers, we winsorize all the continuous variables at the 1st and 99th percentiles of their respective distributions. Table 2 reports the descriptive statistics of main variables for full sample. From Table 2 we find that, the mean (median) of standardized cumulative abnormal returns (SCAR16,
Table 2 Descriptive Statistics
Variables Mean Std. Median Min Max
SCAR16(%) 1.150 4.671 0.765 -9.523 14.998 SCAR12(%) 0.475 4.161 0.155 -9.471 11.901 SCAR12_May(%) 0.917 3.810 0.534 -7.172 12.621 DO 0.512 0.500 1.000 0.000 1.000 DO_Amt_tot (millon) 154.468 574.139 15.000 0.000 20,100.000 DO_Amt 6.081 13.279 0.130 0.000 87.030 UE 0.034 0.228 0.002 -0.598 1.290 AGE 12.318 7.727 10.000 2.000 46.000 BIG4 0.836 0.370 1.000 0.000 1.000 GROWTH 1.320 0.657 1.130 0.505 4.204 PERSIST -0.009 0.231 0.050 -1.364 0.228 BETA 1.005 0.483 0.977 -0.158 2.271 SIZE 8.048 1.473 7.914 5.153 12.478 LEV 0.412 0.178 0.413 0.063 0.891 ROA 0.026 0.091 0.035 -0.411 0.231 RESTATE 0.427 0.495 0.000 0.000 1.000 GDR 0.051 0.221 0.000 0.000 1.000 ECB 0.070 0.255 0.000 0.000 1.000 INDUSTRY 0.561 0.496 1.000 0.000 1.000 STOCK 9.261 1.199 9.173 6.518 12.494 INDIR 0.010 0.033 0.000 0.000 0.154 CONTROL 55.745 21.449 50.000 12.500 100.000 CONTROLOWN 23.805 17.466 19.645 0.000 73.100 MGTOWN 1.522 2.258 0.560 0.000 11.710 BONUS 9.348 0.980 9.302 6.581 12.036
Note: SCAR16 is standardized cumulative abnormal returns from January of fiscal year t to April of fiscal year
t+1; SCAR12 is standardized cumulative abnormal returns from January of fiscal year t to December; SCAR12_May is standardized cumulative abnormal returns from May of fiscal year t to April of fiscal
year t+1; DO is a dummy variable that equals 1 if the firm purchases D&O insurance, and 0 otherwise;
DO_Amt_tot is total D&O insurance coverage; DO_Amt is total D&O insurance coverage scaled by
book value of equity; UE is unexpected earnings that is measured by income from continuous operations in year t minus the income from continuing operations in year t-1 and then scaled by market value of equity; AGE is the number of years a firm has been listed; BIG4 is a dummy variable that equals 1 if auditor is a Big 4 accounting firm, and 0 otherwise; GROWTH is growth opportunities that is measured by the sum of market value of equity and book value of debt, and then scales by total assets; PERSIST is earnings persistence that is measured by the reciprocal of PE ratio; BETA is systematic risk that is measured by market model using the data of past 24-60 monthly stock returns; SIZE is natural log of total assets; LEV is total liabilities divided by total assets; ROA is net income after tax divided by total assets; RESTATE is a dummy variable that equals 1 when the firm incurs financial statement restatements, and 0 otherwise; GDR is a dummy variable that equals 1 when the firm issues Global Depositary Receipts (GDR), and 0 otherwise; ECB is a dummy variable that equals 1 when the firm issues Euro-Convertible Bond (ECB), and 0 otherwise; INDUSTRY is a dummy variable that equals 1 when the firm is in high-tech industries, and 0 otherwise; STOCK is natural log of the number of shareholders; INDDIR is ratio of independent directors on the board; CONTROL is the ratio of ultimate controller on the board; CONTROLOWN is the percentage of shares held by ultimate controller;
MGTOWN is the percentage of shares held by managers; BONUS is natural log of the remunerations of
and 0.917% (0.534%). The mean of DO is 0.512, indicating that 51.2% of full sample purchase D&O insurance, this result is same as Table 1. The mean of the
DO_Amt_tot is 154.468 (million), the minimum is 0, and the maximum is 20,100
(million). The mean of DO_Amt is 6.081%, the minimum is 0, and the maximum is 87.03%. These results mean that there are still great differences between various firms in the D&O insurance coverage. The mean (median) of unexpected earnings (UE) is 0.034 (0.002). The mean of BIG4 is 0.836, revealing that 83.6% of the sample is audited by the Big4 accounting firms.
Table 3 exhibits the Person correlation matrix between various variables. Table 3 shows the correlation between standardized cumulative abnormal returns (SCAR16, SCAR12 and SCAR12_May) and unexpected earnings (UE) are positive and significant. As to the correlation coefficients between the independent variables are mostly below 0.4 and the value of variance inflation factor for all the variables ranges from 1 to 2 (not tabulated). These results indicate that multicollinearity problems of our model should not be serious.
4.2 Regression Results
Our regression results from EBTM using the maximum likelihood method estimation are presented in Table 4, Panel A presents the results for the ERC model, which the dependent variables are measured by three kinds of standardized cumulative abnormal returns respectively (SCAR16, SCAR12 and SCAR12_May), and Panel B provides the results for D&O insurance choice model. First, LR test is used to test whether the residual term of the ERC model (Equation 2 ) and of D&O insurance choice model (Equation 1) are correlated (ρ ≠0). The results show that the residual terms of two equations are significantly correlated. That is to say, the unobservable characteristics have an influence over the purchase decisions of D&O insurance and earnings quality simultaneously. DO in equation (2) is an endogenous variable. In other words, in order to control self-selection effect, it is appropriate for EBTM estimation, which be used to explore the relationship between D&O insurance and earnings quality.
Chi ao D a Manag e m e n t R e v ie w Vo l. 3 5 N o. 2 , 201 5 131 Ta b le 3 P ea rs on C o rr e lat ion M at ri x V ar iab le s 1 2 3 4 5 6 7 8 9 10 11 12 13 14 15 16 17 18 19 20 21 22 1. SC A R 16 2. SC A R 12 0 .930 a 3. SC A R 12 _ Ma y 0 .924 a 0 .832 a 4 .D O -0. 08 4 a -0. 07 8 a -0. 05 5 b 5 .U E 0 .176 a 0 .177 a 0 .173 a 0 .009 6 .A G E 0 .052 b 0 .065 a 0 .018 -0. 19 6 a 0 .029 7 .B IG 4 -0. 06 3 a -0. 05 2 b -0. 04 1 c 0 .129 a -0. 03 7 c -0. 07 2 a 8 .GR OW T H -0. 10 4 a -0. 03 6 c -0. 10 2 a 0 .122 a 0 .077 a -0. 15 3 a 0 .055 b 9. P E R SI ST 0 .023 0 .062 a 0 .040 c -0. 02 0 0 .213 a 0. 032 0 .069 a 0 .152 a 1 0 .BET A 0 .124 a 0 .162 a 0 .090 a 0 .036 c 0 .045 c 0 .123 a 0 .031 -0. 04 2 c -0. 18 2 a 11. SI Z E -0. 11 8 a -0. 04 9 b -0. 11 2 a 0 .171 a 0. 0 1 32 0 .309 a 0 .155 a 0 .333 a 0 .307 a 0 .073 a 12. L E V -0. 00 5 -0. 00 2 -0. 01 9 -0. 00 1 0 .073 a 0 .083 a -0. 02 4 -0. 21 7 a -0. 22 5 a 0 .061 a 0 .007 13. R O A -0. 04 2 c -0. 00 7 -0. 01 5 0 .004 0 .178 a -0. 00 6 0 .098 a 0 .321 a 0 .731 a -0. 19 1 a 0 .384 a -0. 24 8 a 1 4 .RES T AT E -0. 00 5 -0. 01 9 0 .004 -0. 01 5 0 .028 -0. 37 8 a -0. 07 3 a 0 .069 a -0. 10 9 a -0. 09 1 a -0. 45 5 a -0. 04 6 b -0. 14 8 a 1 5 .GDR -0. 04 3 c -0. 02 5 -0. 03 8 c 0 .127 a 0 .010 0 .168 a 0 .079 a -0. 02 4 -0. 03 7 c 0 .044 c 0 .417 a 0 .053 b -0. 01 6 -0. 16 6 a 16. E C B 0 .013 0. 0 0 87 0 .022 0 .076 a -0. 05 0 b 0 .071 a 0 .051 b -0. 10 1 a -0. 05 1 b 0 .061 a 0 .244 a 0. 0 8 77 a -0. 06 2 a -0. 12 0 a 0 .277 a 17. IN D U ST R Y -0. 09 2 a -0. 08 3 a -0. 02 7 0 .351 a -0. 01 9 -0. 43 2 a 0 .169 a 0 .123 a -0. 06 6 a 0 .091 a -0. 02 5 -0. 13 7 a -0. 03 9 c 0 .172 a 0 .093 a 0 .066 a 18. ST O C K -0. 05 0 b -0. 02 7 -0. 05 2 b 0 .140 a -0. 00 2 0 .522 a 0 .072 a -0. 10 9 a -0. 02 9 0 .283 a 0 .680 a 0 .113 a -0. 01 5 -0. 51 6 a 0 .433 a 0 .304 a -0. 00 3 1 9 .IN D IR -0. 05 1 b -0. 06 9 a -0. 01 7 0 .037 c -0. 05 2 b -0. 18 1 a 0 .067a -0. 03 3 0 .008 0 .038 c -0. 07 9 a -0. 02 7 0 .037 c 0 .080 a -0. 03 7 c 0. 0 1 14 0 .139 a -0. 11 5 a 2 0 .CO NT R O L 0 .052 b 0 .059 a 0 .028 -0. 21 2 a 0 .014 0 .478 a -0. 02 9 -0. 17 2 a 0 .012 0. 0 6 5 a 0 .221 a 0 .108 a -0. 02 7 -0. 29 2 a 0 .089 a 0 .057 a -0. 32 4 a 0 .362 a -0. 16 7 a 2 1 .C ON T R OL OW N 0 .070 a 0 .064 a 0 .034 -0. 26 9 a -0. 00 4 0 .060 a -0. 05 4 b -0. 07 2 a 0 .039 c -0. 15 3 a -0. 15 9 a 0 .020 0 .016 0 .001 -0. 11 5 a -0. 10 5 a -0. 29 0 a -0. 31 5 a -0. 00 6 0 .177 a 2 2 .MG T O WN -0. 01 3 -0. 01 5 0 .009 0 .105 a -0. 02 4 -0. 21 3 a 0 .040 c 0 .059 a 0 .056 b -0. 01 3 -0. 11 5 a -0. 06 6 a 0 .095 a 0 .071 a -0. 07 2 a -0. 06 9 a 0 .243 a -0. 16 0 a 0 .041 c -0. 10 8 a -0. 21 6 a 2 3 .B ON US -0. 12 1 a -0. 08 5 a -0. 09 7 a 0 .147 a -0. 03 7 c 0 .212 a 0 .142 a 0 .111 a 0 .264 a -0. 00 1 0 .662 a 0 .042 c 0 .392 a -0. 34 5 a 0 .310 a 0 .183 a -0. 02 5 0 .468 a -0. 02 49 0 .192 a -0. 20 9 a 0 .022 N o te s: a, b a n d c in d ic a te s ta tis tic a l sig n if ic a n c e a t th e 1 % , 5 % , a n d 1 0 % le v e l, r e sp e ct iv ely in a tw o -ta il e d t e st. S C AR1 6 i s st a nd a rdi ze d c u m ul a ti ve a bn o rm a l r et ur ns f rom J a n ua ry of f is ca l ye a r t to A p ril o f f is ca l y ea r t +1 ; S C AR1 2 i s s ta nd a rd iz e d c u m ul a ti v e a b nor m a l re tur ns f rom Jan u a ry o f f is ca l y ea r t to D e c em b er ; S CA R 12 _ Ma y i s s ta n d a rd iz ed c um ul a ti ve a b no rm a l r e tur ns f rom M a y of f is ca l ye a r t to A p ril o f f is ca l y ea r t+1 ; DO i s a d um m y v a ri a bl e th a t e q ua ls 1 i f the f ir m p ur ch a se s D & O i ns ur a nc e, a nd 0 ot he rw is e ; UE i s u n e xp e ct e d e a rni n gs t ha t is m ea su re d b y i nc o m e fr o m c o nt inu ou s o pe ra ti on s i n y ea r t m in us t he i nc om e f rom c on ti n ui n g o pe ra ti ons i n y ea r t-1 a n d t h e n s ca le d b y m a rke t v a lue of e q ui ty; AG E i s th e n um be r of ye a rs a f ir m h a s be en li st e d ; BI G 4 i s a d um m y v ar iab le t h a t eq u al s 1 if a u d it o r is a B ig 4 a cc o u n ti n g f ir m , a nd 0 o the rw is e; G R O WT H i s gr o w th o pp or tu ni ti e s t ha t i s m ea su re d b y t h e su m o f t he m a rk et va lu e o f e qu it y a nd th e b o ok va lu e o f de bt , a n d t he n sc a le s b y t ot a l a ss e ts ; P E R SI ST i s ea rn in g s p er si st e n c e th a t i s m ea su red b y t h e re ci p ro ca l o f P E r a ti o ; B ET A is sy ste m a tic r is k th a t i s m ea sur e d by m a rke t m od e l us ing t h e d a ta of 24 -60 m o nt hl y s toc k r e tur ns ; S IZE i s n a tu ra l lo g o f t o ta l a ss e ts ; LE V i s t o ta l lia b ilit ie s d iv id ed b y to ta l a ss et s; RO A i s n et i n c o m e a ft er t a x di vi de d b y t ot a l a ss et s; RES T A T E i s a du m m y va ri a b le t ha t e q ua ls 1 w he n th e fi rm i nc ur s fi n a n c ia l st at e m en t r es ta te m e n ts , a nd 0 ot he rw is e ; GDR i s a d u mmy v ar ia b le t h at e q ua ls 1 w he n th e f ir m is su e s G lo b a l D e p o si ta ry R ec ei p ts (G D R ), a n d 0 ot he rw is e; EC B is a du m m y va ri a bl e tha t equ a ls 1 w h e n th e f ir m is su e s Eu ro -C on v er ti bl e B o nd (E C B ), a nd 0 ot he rw is e; IND U S T R Y i s a du m m y va ri a bl e t ha t equ a ls 1 w h e n t h e fi rm i s i n hi gh -te c h in d u str ie s, a nd 0 ot he rw is e ; S TO C K is n a tu ra l log of t h e n u mb er o f s ha re h ol de rs ; IND D IR is r a tio of i nde pe n de n t di re c to rs o n the b o a rd ; C O N TR O L is th e r a ti o o f u lt im a te c o n tr o lle r on t h e bo a rd ; C ON T R O L O W N is th e p er ce n ta g e o f s h ar es h el d b y u lti m a te c o n tr o lle r; M G T O WN i s t h e pe rc e nt a ge o f s ha re s he ld by m a na g er s; BO N U S is n a tur a l l og of t he r e m une ra ti ons of d ir e ct o rs a nd o ff ic er s.
Table 4
Regression Results of the Effect of D&O Insurance on the ERC: EBTM Using Maximum Likelihood Method
Variables Predicted
sign SCAR16 SCAR12 SCAR12_May
Panel A:ERC Model
Intercept ? 4. 603 *** 1. 264 *** 3. 529 *** (0. 000) (0. 007) (0. 000) UE + 7. 126 *** 5. 441 ** 7. 880 *** (0. 005) (0. 015) (0. 000) DO ? -2. 659 *** -2. 004 *** -0. 731 * (0. 000) (0. 000) (0. 057) UE×DO ? -2. 147 *** -1. 843 *** -1. 630 *** (0. .004) (0. 005) (0. 008) UE×AGE ? -0. 233 *** -0. 257 *** -0. 137 *** (0. 000) (0. 000) (0. 003) UE×BIG4 + -0. 368 0. 575 -0. 590 (0. 648) (0. 424) (0. 375) UE×GROWTH + -0. 734 -0. 315 -0. 973 * (0. 239) (0. 571) (0. 058) UE×PERSIST + 1. 325 1. 294 1. 199 (0. 183) (0. 144) (0. 143) UE×BETA - -1. 788 *** -2. 208 *** -1. 894 *** (0. 008) (0. 000) (0. 001) UE×SIZE ? 0. 985 *** 0. 927 *** 0. 617 *** (0. 000) (0. 000) (0. 006) UE×LEV - -5. 631 *** -4. 203 ** -4. 787 *** ? (0. 002) (0. 011) (0. 002) AGE 0. 001 0. 014 -0. 002 ? (0. 929) (0. 229) (0. 840) BIG4 -0. 262 -0. 306 -0. 074 ? (0. 236) (0. 120) (0. 683) GROWTH -0. 513 *** -0. 051 -0. 499 *** ? (0. 000) (0. 689) (0. 000) PERSIST 0. 944 ** 1. 321 *** 0. 846 ** ? (0. 022) (0. 000) (0. 013) BETA 1. 037 *** 1. 665 *** 0. 906 *** ? (0. 000) (0. 000) (0. 000) SIZE -0. 277 *** -0. 163 ** -0. 272 *** ? (0. 000) (0. 016) (0. 000) LEV -0. 434 -0. 236 -0. 820 ** (0. 378) (0. 588) (0. 038)
Panel B:D&O insurance choice model
Intercept ? -2. 696 *** -2. 655 *** -2. 419 *** (0. 000) (0. 000) (0. 000) BETA + -0. 047 -0. 053 -0. 064 (0. 423) (0. 369) (0. 280) ROA - -1. 073 *** -1. 098 *** -1. 253 *** (0. 001) (0. 001) (0. 000) LEV + 0. 347 ** 0. 349 ** 0. 334 ** (0. 016) (0. 016) (0. 021) RESTATE + -0. 001 -0. 016 -0. 035 (0. 981) (0. 792) (0. 567)
Table 4
Regression Results of the Effect of D&O Insurance on the ERC: EBTM Using Maximum Likelihood Method (continued)
Variables Predicted sign SCAR16 SCAR12 SCAR12_May
GROWTH + 0. 089 * 0. 085 * 0. 079 (0. 066) (0. 081) (0. 108) ADR + 0. 096 0. 088 0. 114 (0. 471) (0. 512) (0. 403) ECB + -0. 113 -0. 086 -0. 054 (0. 268) (0. 401) (0. 610) INDUSTRY + 0. 749 *** 0. 740 *** 0. 745 *** (0. 000) (0. 000) (0. 000) STOCK + 0. 080 ** 0. 082 ** 0. 061 (0. 044) (0. 042) (0. 134) SIZE ? 0. 126 *** 0. 116 *** 0. 133 *** (0. 000) (0. 001) (0. 000) INDDIR + 0. 093 0. 302 -0. 180 (0. 899) (0. 686) (0. 813) CONTROL ? -0. 011 *** -0. 011 *** -0. 012 *** (0. 000) (0. 000) (0. 000) CONTROLOWN ? -0. 009 *** -0. 009 *** -0. 009 *** (0. 000) (0. 000) (0. 000) MGTOWN ? 0. 013 0. 014 0. 016 (0. 242) (0. 200) (0. 156) BONUS ? 0. 117 *** 0. 124 *** 0. 113 *** (0. 001) (0. 000) (0. 002)
Included Year Dummies
Wald 360. 78 362 93 304. 78
LR test (H0: ρ=0) value 29. 87 *** 20 56 *** 2. 62 *
Notes: The pvalues are reported in parentheses. *, ** and *** indicate statistical significance at the 10%, 5%, and 1% level, respectively in a two-tailed test.
SCAR16 is standardized cumulative abnormal returns from January of fiscal year t to April of fiscal
year t +1; SCAR12 is standardized cumulative abnormal returns from January of fiscal year t to December; SCAR12_May is standardized cumulative abnormal returns from May of fiscal year t to April of fiscal year t+1; DO is a dummy variable that equals 1 if the firm purchases D&O insurance, and 0 otherwise; UE is unexpected earnings that is measured by income from continuous operations in year t minus the income from continuing operations in year t-1 and then scaled by the market value of equity; AGE is the number of years a firm has been listed;BIG4 is a dummy variable that equals 1 if
auditor is a Big 4accounting firm, and 0 otherwise; GROWTH is growth opportunities that is measured by the sum of the market value of equity and the book value of debt, and then scales by total assets;
PERSIST is earnings persistence that is measured by the reciprocal of PE ratio; BETA is systematic risk
that is measured by market model using the data of 24-60 monthly stock returns; SIZE is natural log of total assets; LEV is total liabilities divided by total assets; ROA is net income after tax divided by total assets; RESTATE is a dummy variable that equals 1 when the firm incurs financial statement restatements, and 0 otherwise; GDR is a dummy variable that equals 1 when the firm issues Global Depositary Receipts (GDR), and 0 otherwise; ECB is a dummy variable that equals 1 when the firm issues Euro-Convertible Bond (ECB), and 0 otherwise; INDUSTRY is a dummy variable that equals 1 when the firm is in high-tech industries, and 0 otherwise;STOCK is natural log of the number of
shareholders; INDDIR is ratio of independent directors on the board;CONTROL is the ratio of ultimate
controller on the board; CONTROLOWN is the percentage of shares held by ultimate controller;
MGTOWN is the percentage of shares held by managers; BONUS is natural log of the remunerations of
directors and officers.
2
χ
2
Panel A of Table 4 shows that the coefficients on UE (unexpected earnings) are significant and positive (p values are all smaller than 5%), consistent with prior studies. The coefficients on UE×DO are significant and negative (-2.147, -1.843, -1.630 respectively, p values are all smaller than 1%). In other words, these results imply that stock investors believing the purchases of D&O insurance is not conducive to earnings quality, and then the ERC will be weakened. The empirical results tend to support the argument that stock investors believing the purchase of D&O insurance for directors and officers liability will transfer part of potential litigation risk to the insurance firm. It may weaken directors and officers required attention to ensure a reliable financial report, as it is not conducive to earnings quality, and their earnings information on responses to stock prices will thereby be reduced. In addition, although the coefficients on DO is not an issue to be discussed in this study, and we find coefficients on DO are significant and negative, indicating firms with D&O insurance have the lower cumulative abnormal returns than those without D&O insurance22.
Panel B of Table 4 reports the results of D&O insurance choice model, and we find that firms with lower return of assets (ROA), higher debt ratio (LEV), higher growth opportunities (GROWTH), the electronic industry (INDUSTRY), the greater number of shareholders (STOCK), greater size (SIZE), lower ratio of controller (CONTROL) and the percentage of shares held by controlling shareholders (CONTROLOWN), and higher remunerations of directors (BONUS) are more likely to purchase D&O insurance. The empirical results demonstrate the determinants of demandfor D&O insurance are related to litigation risk, firm size, and corporate governance factors. Our results are generally consistent with prior studies (Core, 1997; O’Sullivan, 2002; Chung and Wynn, 2008; Zou et al., 2008; Chen and Pang, 2008).
4.3 Additional Tests
4.3.1 The Effect of D&O Insurance Coverage on the ERC
22
We infer that firms with D&O insurance essentially have a higher risk (they would take the initiative to purchase D&O insurance), and on average, have lower cumulative abnormal returns than those without D&O insurance.
Wynn (2008) suggests that when the opportunistic incentives and opportunities for directors and officers are greater, D&O insurance coverage is greater for transferring legal liability arising from opportunistic behaviors. In other words, D&O insurance coverage can more accurately capture moral hazard problem of directors and officers. We further explore the effect of D&O insurance coverage on the ERC for firms with D&O insurance. We divide total D&O coverage into normal insurance coverage (NormalDO) and abnormal insurance coverage (AbnDO). Following prior studies, we construct D&O insurance coverage demand model (equation (3))23 to estimate normal D&O insurance coverage and abnormal D&O insurance coverage (that is the error term of equation (3)). Table 5 presents the estimated results for the determinants of D&O insurance coverage model. We find that the adjusted R2 of D&O insurance coverage demand model is 80.5%, and most of coefficients of D&O insurance demand variables (ROA、LEV、
GROWTH、STOCK、SIZE、CONTROL) are significant and consistent with the
predicted direction. The results reveal that the D&O insurance coverage model constructed in this study can reasonably estimate normal D&O insurance coverage and abnormal D&O insurance coverage.
Table 6 summaries the results of the effect of total insurance coverage (DO_Amt), normal insurance coverage (NORMAL_DO ) and abnormal insurance coverage (AbnDO) on the ERC. We find that most of coefficients on UE×DO_Amt,
UE×NORMAL_DO and UE×AbnDO are negative and significant at 10 percent
level, except that when dependent variable is SCAR12_May (only one-tailed test is significant). This indicates that regardless of total insurance coverage, either normal or abnormal insurance coverage will reduce the ERC. In other words, for firms with D&O insurance, higher D&O insurance coverage have the lower ERC and firms with higher abnormal D&O insurance coverage will further deteriorate the ERC. 23 G _ it it 15 it 14 it 13 it 12 it 11 it 10 it 9 it 8 it 7 it 6 it 5 it 4 it 3 it 2 it 1 0 it YEAR BONUS MGTOWN CONTROLOWN CONTROL INDDIR SIZE STOCK INDUSTRY ECB GDR ROWTH RESTATE LEV ROA BETA Amt DO ε η α α α α α α α α α α α α α α α α α η + + + + + + + + + + + + + + + + + =
∑
(3)DO_Amt is measured by total D&O insurance coverage scaled by book value of equity, the other
variables in Equation (3) are the same as Equation (1).
Table 5
Determinants of D&O Insurance Coverage
Variables Predicted sign Coefficients pvalue
Intercept ? 91.832 (0.000) *** BETA + -9.337 (0.002) *** ROA - -130.803 (0.000) *** LEV + 33.292 (0.000) *** RESTATE + -2.206 (0.263) GROWTH + 17.595 (0.000) *** GDR + -1.967 (0.634) ECB + -1.257 (0.679) INDESTRY + -3.889 (0.835) STOCK + 0.000 (0.013) ** SIZE ? -5.548 (0.000) *** INDDIR + -8.621 (0.695) CONTROL ? 0.103 (0.024) ** CONTROLOWN ? -0.019 (0.724) MGTOWN ? 0.506 (0.135) BONUS ? -1.427 (0.130)
Included Year Dummies
F-value 195.63 (0.000) ***
Adj. R2 0.805
n 1,624
Notes: The p values are reported in parentheses. *, ** and *** indicate statistical significance at the 10%, 5%, and 1% level, respectively in a two-tailed test.
DO_Amt is D&O original coverage scaled by book value of equity; BETA is systematic risk that is measured by market model using the past 24-60 monthly stock return data; LEV is total liabilities divided by total assets; RESTATE is a dummy variable thatequals 1 whenthe firm incurs financial statement restatements, and 0 otherwise; GROWTH is growth opportunities that is measured by the sum of the market value of equity and the book value of debt, and then scales by total assets; GDR is a dummy variable thatequals 1 whenthe firm issues Global Depositary Receipts (GDR), and 0 otherwise; ECB is a dummy variable that equals 1 whenthe firmissues Euro-Convertible Bond (ECB), and 0 otherwise; INDUSTRY is a dummy variable that equals 1 when the firm is in high-tech industries, and 0 otherwise;
STOCK is natural log of the number of shareholders; SIZE is natural log of total assets; INDDIR is ratio of independent directors on the board; CONTROL is the ratio of ultimate
controller on the board; CONTROLOWN is the percentage of shares held by ultimate controller; MGTOWN is the percentage of shares held by managers; BONUS is natural log of the remunerations of directors and officers.
Table 6
Regression Results of the Effect of D&O Insurance Coverage on the ERC Variables Predicted
sign SCAR16 SCAR12
SCAR12
_May SCAR16 SCAR12
SCAR12_ May UE + 8. 656 6. 684 8. 349 4. 257 2. 578 4. 604 (0. 208) (0. 308) (0. 240) (0. 658) (0. 788) (0. 564) DO_Amt ? -1. 548*** -1. 708*** -0. 864** (0. 000) (0. 001) (0. 049) UE×DO_Amt ? -3. 257*** -2. 690* -0. 949 (0. 000) (0. 087) (0. 184) NORMAL_DO ? 0. 014* 0. 022*** 0. 011** (0. 082) (0. 001) (0. 013) UE×NORMAL_DO ? -0. 059*** -0. 063*** -0. 036*** (0. 000) (0. 004) (0. 008) AbnDO - 0. 004 0. 002 0. 002 (0. 542) (0. 418) (0. 689) UE×AbnDO - -0. 047** -0. 039** -0. 030** (0. 016) (0. 016) (0. 044) F-value 17. 34*** 16. 05*** 18. 08*** 10. 08*** 8. 82*** 9. 13*** Adjusted R2 0. 089 0. 093 0. 08 0. 086 0. 085 0. 082
Notes: The pvalues are reported in parentheses. *, ** and *** indicate statistical significance at the 10%, 5%, and 1% level, respectively in a two-tailed test. To save space, the estimation result of control variable in the ERC model and the D&O model insurance choice model are omitted.
SCAR16 is standardized cumulative abnormal returns from January of fiscal year t to April of
fiscal year t +1; SCAR12 is standardized cumulative abnormal returns from January of fiscal year t to December; SCAR12_May is standardized cumulative abnormal returns from May of fiscal year t to April of fiscal year t+1; DO_Amt is total D&O insurance coverage scaled by book value of equity; NORMAL_DOis normal D&O insurance coverage, we construct D&O insurance coverage demand model (equation (3)) to estimate the normal D&O insurance coverage; AbnDOis abnormal D&O insurance coverage that is measured by DO_Amt minus
NORMAL_DO; UE is unexpected earnings that is measured by income from continuous
operations in year t minus the income from continuing operations in year t-1 and then scaled by the market value of equity.
4.3.2 Other Measure of Cumulative Abnormal Returns
We use alternative three measures of cumulative abnormal returns and rerun Table 4 and the results are presented in Table 7 (To save space, the results of control variable in the ERC model and the D&O insurance choice model are omitted). Panel A presents the results of non-standardized cumulative abnormal returns (CAR16, CAR12, CAR12_May), while Panel B presents the standardized cumulative abnormal returns, accumulated to the end of March 15 months’