The Impact of COVID-19 on the Global
Economy and Regional Integration
Darson Chiu
Research Fellow, Taiwan Institute of Economic ResearchAbstract
The spread of COVID-19 from Wuhan, China, to East Asia and the major part of global supply value chains, and then to the US and Europe, where the major market demand for finished products, has caused unprecedented and substantial impacts on the global economy. Many international forecasting institutes have aggressively revised downward their forecasts for 2020. As the demand for end products has rapidly decreased, and the oil producing nations have also failed to reach an in-time consensus, continuous tumbling crude oil prices could trigger the fear of deflation and have further the impacts. The economic damage caused by COVID-19 could be unparalleled; recession or even depression is inevitable, meaning that the economic outlook in the near future will be extremely pessimistic.
Nearly 80% of Taiwan’s exports in goods are intermediate products, namely parts and components; Taiwan is deeply integrated into the global supply value chains. For that reason, the global economic growth and Taiwan’s growth are highly correlated, making the Taiwanese economy difficult to be totally immune from such unexpected shocks. If such a COVID-19 economic disaster is indeed dreadful, protectionism may arise as a result. Globalization and regional integration processes will be redefined. Therefore, it is expected that a paradigm-shift will take place in the form of restructuring existing supply chains. Nevertheless, the shift may provide Taiwan with certain opportunities in addition to challenges.
Keywords: COVID-19, Global Supply Value Chains, Economic Outlook, Globalization, Regional Integration
I. Introduction
The spread of COVID-19 and its impact on the global economy has outpaced almost all economic indicators. In response, governments around the world have launched expansionary fiscal stimulus measures, and their central banks have conducted monetary policies that are as loose as possible. The impacts can be categorized in three phases. In phase one, when the outbreak was limited mainly to China and extended to the East Asian region, the risk associated with potential disruptions to supply value chains was high, because China is recognized as the so called “world factory” and East Asia is a major part of global production networks. In phase two, COVID-19 severely impacted the US and Europe, the areas of major market demand for finished products. At the same time, China claimed that the virus was under control. Accordingly, the impacts shifted from the world supply side to the demand side. However, when world demand starts to contract, business incentives for functioning supply chains also diminishes. The third phase, although uncertain, is presumed to be the COVID-19 pandemic returning from the US and Europe back to Asia to become a global scale catastrophe.1
With respect to exceptionally limited optimistic scenarios as well as plunging crude oil prices due to distorting supplies and weakening demands, all international forecasting agencies have further revised downward their forecasts for 2020 trusting headwinds hindering growth that will slow the functioning of global supply value chains. The Taiwanese economy has long been closely associated with global supply value chains. Issues focused and analyzed in the following sections include a) the impact of COVID-19 on the global economy, b) potential processes and outcomes of a paradigm-shift due to severe impacts, and c) the relevant challenges and opportunities facing Taiwan.
II. Impacts of COVID-19 on the Global Economy
The COVID-19 outbreak first started in Wuhan, China, and then spread to East Asian countries, where global manufacturers and suppliers were worried about a potential disruption to global supply value chains. Most East Asian countries are closely involved in the global supply value chains and most of the trade conducted Salvatore Babones, “The ‘Chinese virus’ spread along the new silk road,” Foreign Policy, April 6, 2020, <https://foreignpolicy.com/2020/04/06/chinese-coronavirus-spread-worldwide-on-new-silk-road/>.
in the region are exports and imports in intermediate goods. Before COVID-19 spread to Europe and the US, economists considered the relevant impacts to be similar to that of the Severe Acute Respiratory Syndrome (SARS) outbreak in 2003 that predominantly affected the East Asian region.
5.17% -1.15% 5.41% 7.26% -7% -2% 3% 8% 13% 18% Q1 Q2 Q3 Q4 GDP Private Consumption Fixed Investment Exports
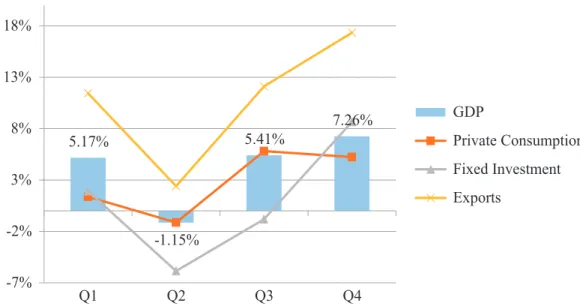
Figure 1. Taiwan’s Economic Growth Rates (Year-on-Year) during the 2003 SARS Outbreak
Source: Department of Statistics, Ministry of Economic Affairs, Taiwan (ROC), “Indices of National Income,” Department of Statistics, MOEA, Taiwan (ROC), <https://dmz26.moea. gov.tw/GMWeb/common/CommonQuery.aspx>.
If the outbreak and damage from COVID-19 is similar to that of SARS in 2003, then a “V” shape recovery for 2020 can be expected. Figure 1 shows a very obvious “V” shape rebound in Taiwan’s economic performance during the SARS in 2003. Taiwan’s gross domestic product (GDP) growth rate in the second quarter of 2003 declined by 1.15%, and the growth of fixed investment and private consumption dipped by 5.86% and 1.14% respectively compared with the same quarter of the previous year. In addition, exports in goods and services slowed downed notably in the second quarter. However, GDP grew strongly by 5.41% and 7.26% for the third and fourth quarter year-on-year thereafter with economic activities mostly resuming after the SARS was fully contained.
The impact of COVID-19 will however be very different from SARS and any economic damage that caused, because SARS did not affect the US and Europe, the
major market with demand for finished products. COVID-19 has had an unprecedented and substantial impact on western countries. As of May 4, 2020, the total number of cases in the US stood at 1,187,510, and cases in Europe and Asia were 1,447,503 and 558,802 respectively, out of the 3,563,065 cases worldwide.2
The spread of COVID-19 and its impact on the economy has outpaced almost all economic indicators. On March 3 and 16, 2020, the US Federal Reserve (Fed) slashed the federal funds rate from 1.5% to 1.75% to 0% to 0.25% when the personal consumption expenditure (PCE) inflation rate stood at 1.7%, and the unemployment rate was still only 3.5%. At the same time, the Fed also decided to launch a US$ 700 billion quantitative easing (QE) program by purchasing the US$500 billion-worth US Treasuries and US200 billion-worth mortgage-backed securities. On April 9, 2020, the Fed announced another US$2.3 trillion program to support its economy, and the purchasing targets were further expanded to municipal bonds, risky high-yield corporate bonds, and stocks, when the PCE inflation was 1.8% and unemployment rate was 4.4%. The Fed adopted extremely loose monetary policies when there was not yet obvious deflationary pressure nor a seriously worsening unemployment rate in the US, which was one of the many examples of where most the world’s economic decision-makers have decided to launch measures before the impact of COVID-19 is reflected in the data and usual indicators.
Table 1. GDP Growth (%) Forecasts by World Major Institutes
IMF IHS Markit EIU
2019 2020 2021 2019 2020 2021 2019 2020 2021 Global 2.9 -3.0 5.8 2.6 -3.0 3.9 2.2 -2.5 3.0 USA 2.3 -5.9 4.7 2.3 -5.4 6.3 2.3 -2.9 1.9 Japan 0.7 -5.2 3.0 0.7 -3.3 1.3 0.7 -1.5 0.7 Euro 1.2 -7.5 4.7 1.2 -4.6 1.2 1.2 -6.0 1.3 China 6.1 1.2 9.2 6.1 2.0 6.3 6.1 1.0 8.4 Taiwan 2.7 -4.0 3.5 2.7 -1.6 2.6 2.7 -1.9 2.3
Source: IMF, “World Economic Outlook,” April 14, 2020, IMF, <https://www.imf.org/external/ index.htm>; IHS Markit, “Global Economic Forecasting and Analysis,” April 16, 2020, IHS Markit, <https://ihsmarkit.com/index.html>; EIU, “Country Forecast World,” April 8, 2020, EIU, <http://www.eiu.com/>.
Worldometers, “Reported Cases and Deaths by Country, Territory, or Conveyance,” May 4, 2020, Worldometers, <https://www.worldometers.info/coronavirus/#countries>.
World major forecasting institutes including the International Monetary Fund (IMF), IHS Markit, and the Economist Intelligence Unit (EIU) all revised their forecasts downward in April 2020. They simultaneously predicted global growth in 2020 would decline significantly from 3% to 2.5%. Industrial and advanced economies such as the US, the Eurozone, and Japan, were all forecast to suffer negative GDP growth in 2020, whereas these institutes estimate that China’s economic growth rate will grow from 1% to 2%. Accordingly, there may be a “V” shape recovery in the world as well as major economies in the annual rate; however, quarterly, the “V” shape is still uncertain for the time being.
According to the 2020 forecasts by the IMF, IHS Markit, and the EIU, it can be concluded that all international institutes trust that the economic impacts caused by COVID-19 are much more serious than the damage caused by the dot com bubble in 2001 and the global financial crises of 2007-08. By comparison, the economic growth rate of the world was 2.46% in 2001 and -0.08% in 2009.
-2% 0% 2% 4% 6% 8% 10% 12% World Taiwan 1980 1982 1984 1986 1988199019921994 1996 1998 2000 2002 2004 2006 2008 2010 2012 2014 2016 2018
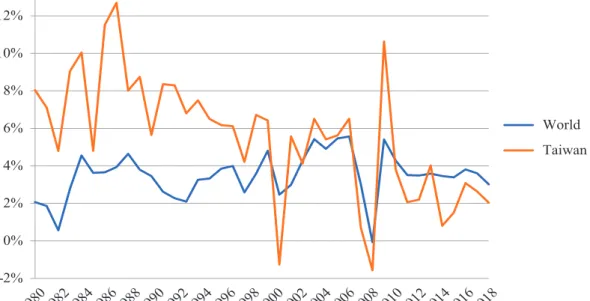
Figure 2. World versus Taiwan GDP Growth from 1980-2019
Source: IMF, “World Economic Outlook,” April 14, 2020, IMF, <https://www.imf.org/external/ index.htm>.
The IMF, IHS Markit, and the EIU further forecast Taiwan’s economic growth to decline in 2020 by 1.6% to 4% compared with the previous year. Figure 2 shows
the economic growth of the world versus the growth of Taiwan from 1980 to 2019. The correlation coefficient between growth for the world and that of Taiwan in the 1980s and 1990s is 0.3502. The correlation coefficient between these two series was 0.8649 in 2000s, and reached 0.9251 during the 2010s. As they have been highly correlated for the past 20 years, it seems sensible to lower the forecast for Taiwan’s growth as global growth drops from 3% to 2.5%.
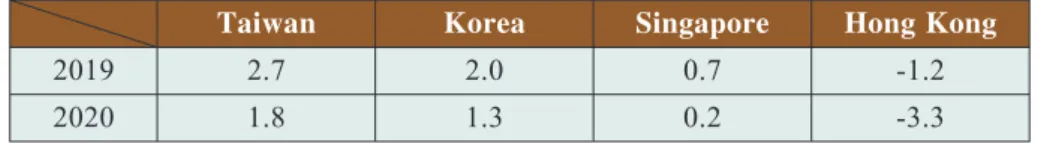
Table 2. GDP Growth (%) of Asian Four Tigers in 2019 and 2020 by ADB
Taiwan Korea Singapore Hong Kong
2019 2.7 2.0 0.7 -1.2
2020 1.8 1.3 0.2 -3.3
Source: ADB, “Development Outlook 2020,” April 3, 2020, ADB, <https://www.adb.org/publications/ asian-development-outlook-2020-innovation-asia>.
Nevertheless, the Central Bank of the Republic of China (Taiwan) (CBC) repudiated the IMF’s forecast April 20 forecast.3The CBC argued that Taiwan’s economy would
be able to boost its internal demand engines despite the fact that the external demand would be waning. After all, the Asian Development Bank (ADB) forecast that Taiwan’s economy would grow by 1.8% for 2020 on April 2, meaning that Taiwan’s economic growth would remain the highest among the “Asian Four Tigers”.4For the engine of
fixed investment, the Taiwanese government has planned to invest in green energy, and Taiwan’s semiconductor industry is prepared to meet the increasing demand for 5G and high-speed connections, according to the CBC. As for private consumption, the Taiwanese government has also launched fiscal stimulus packages to help domestic consumers with urgent needs. Furthermore, as the demand for global end products has shrunk and the oil-producing nations have failed to reach agreement on supply, falling crude oil prices might not only trigger global deflation (and increase the impacts as a result) but they will also lower the value of Taiwan’s imports. In other words, net exports might not be as seriously affected as predicted by international institutes.
Ching-Tse Cheng, “Central bank optimistic about Taiwan’s economic growth despite pandemic,” Taiwan News, April 20, 2020, <https://www.taiwannews.com.tw/en/news/3919334>.
Asian Development Bank, “Asian development outlook 2020- What drives innovation in Asia, Special topic: The impacts of coronavirus- An update,” April 2020, Asian Development Bank, <https://www.adb.org/publications/asian-development-outlook-2020-innovation-asia >.
Normally, Taiwan’s total imports decrease significantly when crude oil prices dip notably. 2.00% 0.30% 1.56% 2.40% -2% -1% 0% 1% 2% 3% 4% 5% Q1 Q2 Q3 Q4
GDP Private Consumption Fixed Investment Exports Figure 3. Forecasts for Taiwan’s Economic Growth Rate (Year-on-Year) for
2020 by the Taiwan Institute of Economic Research (TIER)
Source: TIER, “Economic Outlook,” April 24, 2020, accessed, TIER, <https://www.tier.org.tw/ forecast/macro_trends.aspx>.
On April 20, 2020, the CBC forecast Taiwan’s GDP growth in 2020 would be 1.3% to 1.8% on the assumption that the COVID-19 outbreak could be contained within six months. However, Taiwan’s economy will grow only by 0.4%-0.9% if the impacts of COVID-19 last for nine months without stimulus packages. On April 24, 2020, the Taiwan Institute of Economic Research (TIER) forecast Taiwan’s GDP would grow by 1.58%, a downward revision of 1.09 percentage points from the TIER’s previous forecast of 2.67% on January 22, 2020.
TIER forecast that COVID-19 will have an impact mostly on private consumption and the export of goods and services. However, the engine of growth to be relied upon for 2020 will be fixed investment. Taiwan’s overall fixed investment is expected to grow by 2.88%, specifically fueled by the government investment growing by 5.31% and public enterprise investment by 17.65% compared with the year of 2019.
-2 -1 0 1 2 3 -70 -60 -50 -40 -30 -20 -10 0 10 20 1 2 3 4 5 6 7 8 9 10 11 12 1 2 3 4 5 6 7 8 2014 2015
Annual Growth Rate (%) of Crude Oil Prices-Left Annual Growth Rate (%) of Consumer Price Index-Right
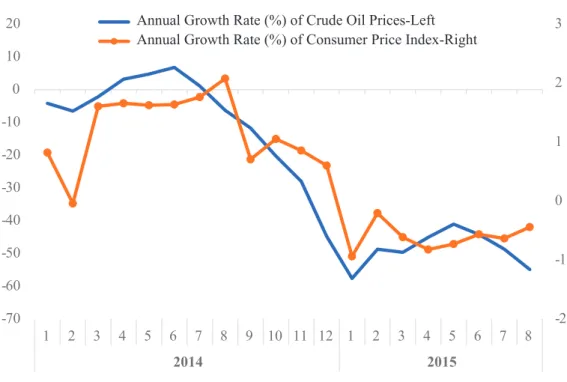
Figure 4. Annual Growth Rate of Crude Oil Prices vs. Annual Growth Rate of Consumer Price Index from January 2014 to August 2015
Source: The Directorate General of Budget, Accounting and Statistics (DGBAS) of Executive Yuan, R.O.C. (Taiwan), “CPI and WPI,” January 7, 2016, Executive Yuan, R.O.C. (Taiwan), <https://www.dgbas.gov.tw/point.asp?index=2>.
Although the tumbling crude oil prices could make Taiwan’s net exports figure better than expected, the situation might additionally deteriorate the global outlook. From the fourth quarter of 2014, crude prices started to decline by 30% to almost 60% annually. The continuous falling prices caused fears for deflation from January to the end of August, 2015. The definition of deflation is when the annual growth rate of the consumer price index is below 0% for at least two quarters. It is therefore very obvious that Taiwan’s economy was hit by deflation from January till August of 2015 due to the fall in crude oil prices. In October 2014, the IMF forecast Taiwan’s economic growth rate for 2015 to be 3.8%; it was in the end only 1.5% as a result of deflation.
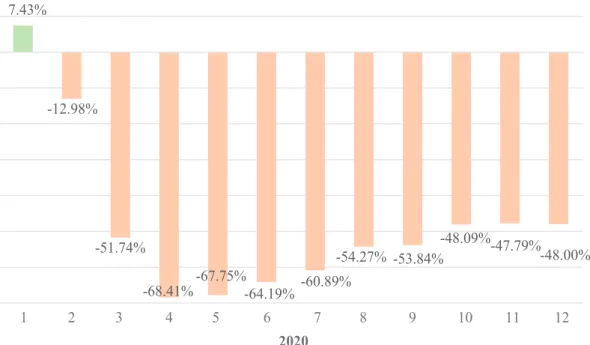
7.43% -12.98% -51.74% -68.41% -67.75% -64.19% -60.89% -54.27% -53.84% -48.09% -47.79% -48.00% 1 2 3 4 5 6 7 8 9 10 11 12 2020
Figure 5. Actual (January-March) and Forecast (April-December) Annual Growth Rate of Brent Crude Oil (US Dollar per Barrel) in 2020
Source: US Energy Information Administration (EIA), “Forecast released date,” April 7, 2020, EIA, <https://www.eia.gov/outlooks/steo/>.
According to the US EIA’s forecast, the annual growth rate in Brent crude oil price could decline by 50% to 70% from April to December 2020. The demand for oil is expected to decrease continuously unless COVID-19 can soon be contained and manufacturing sufficiently resumed. With an extremely painful experience in 2014-2015, a potential global deflation would be the biggest uncertainty for the global economy in 2020.
III. World Economic Order in Possible Paradigm-Shift
Since the outbreak of COVID-19, many developed countries, including the US, Japan, and Korea, have been trying or planning to move their manufacturing supply chains out of China. The trade war between the US and China in July, 2018 forced many international companies to considering whether or not China is a trustworthy supply chain partner. Controversial issues, such as the deliberate ignoring of intellectual property rights, forceful technology transfer, a lack of transparency, and inconsistent regulations, have been repeatedly criticized by foreign businesses investing and
operating in China.
Furthermore, scientists believe that COVID-19 emerged in November, 2019; however, China has been accused of trying to conceal the outbreak and failing to report the epidemic for more than two months. As a result, China’s conduct enabled the coronavirus to spread, causing a global economic crisis of unimaginable proportions. The industrial and advanced countries led by the US have been trying to hold China legally responsible for the economic impacts by demanding that China should pay reparations.5
As the forming of supply value chains is an important process of globalization, it is believed that the COVID-19 pandemic as well as the trade war is a major catalyst for de-globalization.6In the past, globalization meant multinational production networks
through international trade and played a key role in the global economy. International trade came to be about the competition and cooperation with respect to diverse industrial comparative advantages. There have been three major developments transforming multinational production networks: a) rapidly improving production technology in industry has enabled the further breakdown the value chains into smaller proportions, b) advancing technology in communication and transportation has shortened the geographical distances for cross-border production networks and helped promote relevant services links, and c) the trend toward liberalization via the World Trade Organization (WTO) or free trade agreement (FTA) processes eliminated substantial obstacles hindering trade and production networks.7 The objectives of forming
production networks in the first place were for greater efficiency and lower costs. However, an emergent disruption like the COVID-19 outbreak is capable of holding back all efforts and hindering the trade networks from functioning properly.
Mercy A. Kuo, “Taking China to court over COVID-19?” The Diplomat, April 14, 2020, <https://thediplomat.com/2020/04/taking-china-to-court-over-covid-19/>.
Roman Darius, “COVID-19 has exacerbated anti-globalization sentiments,” Australian Outlook, March 26, 2020, <http://www.internationalaffairs.org.au/australianoutlook/covid-19-has-exacerbated-anti-globalisation-sentiments/>.
Darson Chiu, “Advancing the Production Networks in East Asia,” Modern Management Science & Engineering, Vol. 1, No. 1, February 2013, pp. 1-23.
Before the outbreak of COVID-19 and the 2018-2019 trade war, China was the major assembly economy, importing intermediate goods from other East Asian countries and exporting finished goods to the US and European markets. In addition, as the world’s largest exporting economy, China attracted many international businesses to extend their manufacturing and supply chains to China. China used to be considered by many as the top global supply chain partner; investment in China was once deemed necessary in order to succeed in the world markets.8
In a nutshell, intra-regional trade in intermediate goods and extra-regional trade in final goods jointly provided East Asia with much needed growth momentum before the trade war and the COVID-19 outbreak.9Increasing intra-regional trade in parts and
components has also been the result of expanding regional production networks. In addition, the extra regional trade in finished products with industrial and advanced economies such as the US and Europe is still the main growth engines for East Asia. Since trade, intra-regional and extra-regional, plays a key role in linking production networks and economic growth for East Asia, eliminating redundant barriers to promote trade through regional economic integration (REI) will be necessary. REI can take many forms, whereas FTAs have been recognized as a practicable means to create trade.10
Furthermore, it has been tested with East Asia’s panel data that REI with an FTA can help promote vertical specialization-based trade, meaning that furthering REI will improve East Asian production networks.11Modern FTAs have evolved beyond
duty-free and includes many important issues that can help strengthen production networks, such as technological standards and intellectual property rights (IPR) regulations. Therefore, the need for multilateral economic integration processes to continue economic momentum will be essential.
Amita Jhangiani & Carl Stocking, “China: Top global supply chain partner,” China Business Review, September-October 2006, p. 78.
Prema-chandra Athukorala, “Production networks and trade patterns in East Asia: Regionalization or globalization?” Asian Economic Papers, Vol. 10, No. 56, August 2010, pp. 65-95.
Florian Molders & Ulrich Volz, “Trade creation and the status of FTAs: Empirical evidence from East Asia,” Review of World Economics, Vol. 147, No. 3, November 2011, pp. 429-456. Charles Harvie, “SMEs and regional production networks,” in Vo Tri Thanh, Dionisius Narjoko & Sothea Oum, eds., Integrating Small and Medium Enterprises (SMEs) into the More Integrate East Asia (Jakarta: ERIA, 2009), pp. 19-45.
As countries impacted by COVID-19 are planning to relocate their factories out of China, a shift in existing production networks will be inevitable. As a result, REI processes, including CPTPP and RCEP, that support networks will shift as well. The Trump administration has been encouraging and incentivizing US companies to leave China and move to Southeast Asia and Mexico, thanks to the passing of the US-Mexico-Canada (USMCA) Agreement.12Since both Canada and Mexico are signatory members
of CPTPP and the US is the key member charting trade rules of USMCA, it is possible for the US to rejoin CPTPP and perform a leadership for these two processes. The purpose would be to form a new production network by linking CPTPP and USMCA with regional trade rules and an economic order set up and led by the US.
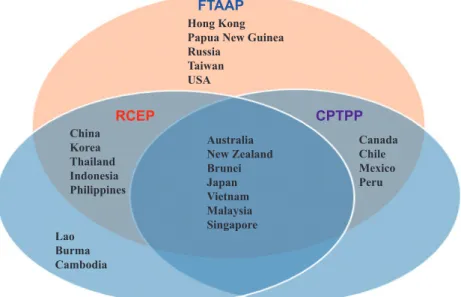
FTAAP Hong Kong Papua New Guinea Russia Taiwan USA RCEP China Korea Thailand Indonesia Philippines Lao Burma Cambodia Australia New Zealand Brunei Japan Vietnam Malaysia Singapore Canada Chile Mexico Peru CPTPP
Figure 6. Regional Economic Integration Processes: Comprehensive and Progressive Agreement for Trans-Pacific Partnership (CPTPP), Regional Comprehensive Economic Partnership (RCEP), and the Free Trade Area of Asia-Pacific
(FTAAP) Source: Made by the author.
Note: CPTPP consists of 11 member countries, and RCEP has 15 member countries for the time being. The FTAAP was proposed and studied by the Asia-Pacific Economic Cooperation (APEC). The process may include all 21 APEC members. The APEC Leaders’ Declaration in 2016 announced that the FTAAP should be built upon ongoing undertakings.
Kenneth Rapoza, “New data shows US companies are definitely leaving China,” Forbes, April 7, 2020, <https://www.forbes.com/sites/kenrapoza/2020/04/07/new-data-shows-us-companies-are-definitely-leaving-china/#640a07c540fe>.
RCEP was scheduled to come into force in 2020, although India decided to leave this REI process in 2019.13Two key members of RECP, Japan and Korea, are currently
relocating production out of China even with part of government stimulus budget suggesting trust is now missing among major members of RCEP.14 Since REI serves
to promote trade and investment, China needs to rebuild trust with other signatory member countries to consolidate this REI process. And trust building may further postpone the RCEP agenda.
FTAs have a tendency for enlarging, docking and merging;15 consequently, more
countries may hope to take part in the CPTPP if the US takes the helm in the future. After all, the US has the biggest market demand of the world; a large demand can incentivize supply chains within the region. On the other hand, RCEP signatory member countries may lose confidence in forming supply chains in such a region, as emergent disruptions can happen again and yield unnecessary transaction costs for businesses. Further, China may lose its grip on RCEP; member countries may lose faith in RCEP and especially China’s leadership. Production networks and REI are crucial factors for globalization. Supply chains leaving China seem to be the action of de-globalization. However, a new paradigm will be formed after shifting; the US-centric economic bloc may further decouple from the other trading bloc that China is striving to manage in the post-pandemic era.
IV. Opportunities and Challenges Facing Taiwan
The spread of COVID-19 has had a serious impact on the global economy, possibly leading to global-scale depression with numerous businesses going bankrupt Subrata Majumder, “Coronavirus stricken China losing grips on RCEP: Should India give second thought to join? Analysis,” Eurasia Review, April 30, 2020, <https://www.eurasiareview. com/30042020-coronavirus-stricken-china-losing-grips-on-rcep-should-india-give-second-thought-to-join-analysis/>.
Isabel Reynolds & Emi Urabe, “Japan to fund firms to shift production out of China,” Bloomberg, April 8, 2020, <https://www.bloomberg.com/news/articles/2020-04-08/japan-to-fund-firms-to-shift-production-out-of-china>.
Siow Yue Chia, “Trade and Investment Policies and Regional Economic Integration in East Asia,” ADBI Working Paper, No. 210, April 2010, Asian Development Bank Institute, <https:// www.adb.org/sites/default/files/publication/156065/adbi-wp210.pdf>.
and soaring jobless rates. On the world stage, trust between international society and China is indeed dwindling, and a paradigm shift in terms of relocating production networks or supply chains and the decoupling of regional economic integration processes is indeed foreseeable. The impact of COVID-19 on both economic and political arrangements will certainly mean significant challenges for Taiwan. Taiwan needs to change in response to such challenges; however, there are pros and cons to these changes. In addition to challenges, there will also be opportunities for Taiwan. The correlation coefficient between the GDP growth series of the world and that of Taiwan for the past 10 tears stood at 0.9251. That means that if the world economic growth stagnates, there will be a 92.51% chance that Taiwan’s GDP growth will also slow down. According to the US Bureau of Economic Analysis, the US GDP growth rate for the first quarter in 2020 stood at 0.3% compared with the same quarter the previous year. China’s first quarter GDP growth rate in 2020 was -6.8% also on a year-on-year basis. However, Taiwan’s GDP increased by 1.54% for the first quarter of 2020.16
The US and China have been the two largest markets for Taiwan’s exports in goods and services; however, the Taiwanese economy managed to outperform the world’s two biggest economies in the first quarter when COVID-19 caused the most obvious economic damages. Firstly, this was simply because Taiwan’s growth momentum was from external demand in 2020. Second, Taiwan successfully lessened its economic and trade dependence on China by forming more independent supply chains as a result of the new southbound policy and innovative industrial plans in recent years. The trade war between the US and China has furthered the trend. In 2017, 41.2% of Taiwan’s total exports went to China and 11.4% to the US. In the first quarter of 2020, 39.4% of Taiwan’s exports went to China, and 14.2% to the US.17The evidence
suggests that some Taiwanese businesses have moved their operations back to Taiwan; goods were manufactured and exported directly from Taiwan to the US market.
National Statistics, Republic of China (Taiwan), “Latest indicators,” April 30, 2020, National Statistics, Republic of China (Taiwan), <https://eng.stat.gov.tw/point.asp?index=1>.
Department of Statistics, Ministry of Economic Affairs, R.O.C. (Taiwan), “Statistical Release,” May 1, 2020, MOEA, R.O.C. (Taiwan), <https://www.moea.gov.tw/Mns/dos/home/Home.aspx>.
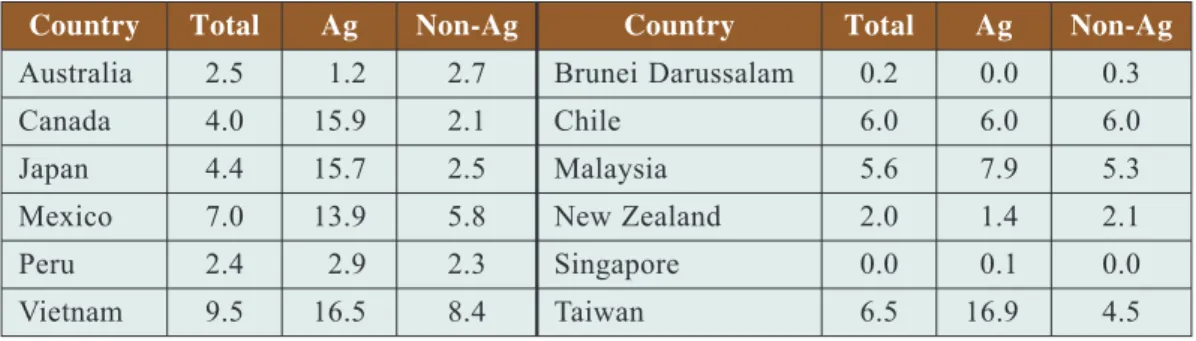
Table 3. Tariffs (%) on Average (Simple Average MFN Applied): Ag (Imported Agricultural Products) and Non-Ag (Non-Agricultural Products) of
CPTPP Member Countries and Taiwan
Country Total Ag Non-Ag Country Total Ag Non-Ag
Australia 2.5 1.2 2.7 Brunei Darussalam 0.2 0.0 0.3
Canada 4.0 15.9 2.1 Chile 6.0 6.0 6.0
Japan 4.4 15.7 2.5 Malaysia 5.6 7.9 5.3
Mexico 7.0 13.9 5.8 New Zealand 2.0 1.4 2.1
Peru 2.4 2.9 2.3 Singapore 0.0 0.1 0.0
Vietnam 9.5 16.5 8.4 Taiwan 6.5 16.9 4.5
Source: WTO, “Tariff Profile,” May 1, 2020, WTO, <https://www.wto.org/english/res_e/statis_e/ tariff_profiles_list_e.htm>.
Although Taiwan’s government has long been striving to expand its internal demand and reduce its reliance on external markets, exports in goods are still the most critical engine for Taiwan in the long run. After all, Taiwan is a small, export-oriented economy. In addition, Taiwan is a hub for the production and exporting of parts and components in global supply value chains. REI and especially the CPTPP is therefore very important for Taiwan. CPTPP membership will have many benefits for Taiwan: a) Taiwan’s exports can compete with products from other countries without tariff barriers, b) Taiwan’s outbound investments can be treated equally and protected on a legal basis, and c) Taiwan’s role in global production networks can be consolidated with respect to the rules of origins. However, there are many challenges facing Taiwan as well. Politically, China may leverage its influence on CPTPP members and attempt to hinder Taiwan’s access to this REI process in the future. Furthermore, Table 3 shows that Taiwan’s tariffs on imported agricultural products are on average higher than all CPTPP member countries. Taiwan’s participation in the CPTPP also implies that protections on certain domestic industries will be lifted.
If Taiwan can join the CPTPP and other REI processes, economic welfare can certainly be generated. Nevertheless, the pressure of bringing in competition will be on rather vulnerable domestic industries. COVID-19 will catalyze a paradigm-shift in the international arena; both challenges and opportunities for Taiwan are presented. Adapting to such changes could be painful in the short term, but undoubtedly necessary for the time being and in the future.