Two-phase Fuzzy-ART with Principal Component
Analysis for Semantic Image Classification
Chuan-Yu ChangDepartment of Computer Science and Information Engineering, National Yunlin University of Science
& Technology, Taiwan [email protected]
Ru-Hao Jian
Department of Computer Science and Information Engineering, National Yunlin University of Science
& Technology, Taiwan [email protected]
Hung-Jen Wang Graduate School of Engineering
Science and Technology, National Yunlin University of Science
& Technology, Taiwan [email protected]
Abstract―Analyzing the contents of an image and
re-trieving corresponding semantics are important in seman-tic-based image retrieval system. In this paper, we apply the principal component analysis (PCA) to extract sig-nificant image features and then incorporated it with the proposed Two-phase Fuzzy Adaptive Resonance Theory Neural Network (Fuzzy-ARTNN) for image content classi-fication. In general, Fuzzy-ARTNN is an unsupervised classifier. Meanwhile, the training patterns in image con-tent analysis are labeled with corresponding categories. This category information is useful for supervised learn-ing. Thus, a supervised learning mechanism is added to label the category of the cluster centers derived by the Fuzzy-ARTNN. The experimental results show that the proposed method has a high accuracy for semantic-based photograph content analysis, and the result of photograph content analysis is similar to perception of the human eyes.
Index Terms―principal component analysis; Fuzzy
Adaptive Resonance Theory Neural Network; Image Re-trieval
I. INTRODUCTION
Due to the rapid development of digital image processing, database, and internet technologies, image classification and analysis are challenging problems in content-based image retrieval system (CBIR) [1]. Most studies in this field have focused on how to group images into semantically mean-ingful categories or index image in a database based on low-level visual features of the images. These systems follow the paradigm of representing image via a set of features such as color, texture, and shape. However, it is difficult to describe high-level semantics using low-level features. In
general, users query an image by semantics (e.g., “Show me a sunrise image.”) without thinking the low-level features, thus such image retrieval sys-tems have poor performance for semantic queries. Recently, semantics-based approaches have been proposed to bridge the gap between high-level se-mantics and low-level features. However, an image may contain many objects. It is hard to index an image by a single semantics. On the other hand, region-based image retrieval (RBIR) systems [2] decompose an image into regions and index images by region features. According to region features, we can analyze image to obtain how many seman-tics and what percentage of these semanseman-tics in im-ages. By analyzing the contents of an image, the accuracy of image retrieval system were improved. Therefore, analyzing the contents of an image and retrieving the corresponding semantics are impor-tant in semantic-based image retrieval system.
In order to obtain effective features and reduce time-spent, the feature selection is needed. In this paper, we adopt the principal component analysis (PCA) [3, 4] to reduce the feature dimension and to derive effective and discriminative features. PCA is a good method for data representation and has been widely used in a lot of research fields such as computer vision and pattern recognition. Essen-tially, it is to transform data to a subspace where the data can be represented compactly and efficiently. The projections on the subspace bases are called principal components.
Fuzzy-ART is a famous classifier. Fuzzy-ART proposed by G. A. Carpenter et al. is an
vised learning network [5]. It is capable of rapid
stable learning of recognition categories in re-sponse to arbitrary sequences of analog or binary input patterns. In general, Fuzzy-ARTNN is an un-supervised classifier. Meanwhile, the training pat-terns in image content analysis are labeled with corresponding categories. This category informa-tion is useful for supervised learning. Thus, a su-pervised learning mechanism is added to label the category of the cluster centers derived by the Fuzzy-ART. In the first phase, we use the Fuzzy-ART to obtain the ranking winning neurons. In the second phase, the desired results were classi-fied by the previously ranking winner neurons. Figure 1 shows the flowchart of semantic-based photographic analysis.
There are four steps in the proposed method and they are summarized as follows: (1) Each im-age is segmented into several regions by J-imim-ages segmentation (JSEG) [6]. (2) The color, texture, and shape features are extracted from each seg-mented region and they form a feature vector. (3) The dimensional reduction of each feature vector is performed by PCA. (4) The principal components of each feature vector form an input of the two-phase Fuzzy-ART. The experimental results show that the proposed method has a high accuracy for semantic-based photograph analysis, and the result of photograph analysis is similar to percep-tion of the human visual systems.
The remainder of this paper is organized as fol-low. In Section II, J-image segmentation, feature extraction, and PCA are briefly described. In Sec-tion III, two-phase Fuzzy-ART is presented. The experimental results are given in Section IV. Fi-nally conclusions are drawn in Section V.
Fig. 1. Flowchart of semantic-based photo-graphic analysis.
II. PREPROCESSING
A. Image Segmentation
In general, a scene image contains different
ob-ject regions with various colors and textures. To extract regional features, JSEG, a color image seg-mentation method [6], is used. In brief, JSEG first quantizes colors of an image to several representa-tive classes. It then labels pixels with the color classes to form a class map of image. Finally, the image is segmented using multi-scale J-images [6]. Figure 2(a) shows the original image and Fig. 2(b) shows the segmentation result of JSEG.
(a) (b)
Fig. 2. (a) Original image. (b) Segmentation re-sult by JSEG
B. Feature Extraction
After assigning semantic category label for each segmented region manually, each region would be described by their color, texture, and shape features. The HSV color histogram is quantified into 64 color bins to represent color features of an object region. To describe the texture features of an object region, four common gray-level statistical features including contrast, energy, entropy, and homogene-ity are adopted, along with four different angles (0, 45, 90, and 135).
(
) ( )
∑ ∑
− = − = − = 1 0 1 0 2 , N i N j j i P j i Contrast δ (1)( )
∑ ∑
− = − = = 1 0 1 0 2 , N i N j j i P Energy δ (2) 1 1 0 0 ( ) log( ( )) N N i j Entropy P iδ j P iδ j − − = = = −∑∑
− − (3) 1 1 2 0 0 ( ) 1 ( ) N N i j P i j Homogeneity i j δ − − = = − = + −∑∑
(4)where Pδis the co-occurrence matrix under a spe-cific conditions ( , )δ θr in which denotes the dis-tance and is the orientation between adjacent inten-sity ( ,i j ).
The edge direction histograms have been used in image retrieval [7] and image classification [8]. These methods describe the shape information
contained in an image on the basis of its significant
edges.
Step 1. Edge detection: The Sobel operator is less sensitive to noise than other edge detectors [9]. Therefore, it has been used for edge detection and obtaining the gradient image. The Sobel operator generates two edge components, Gx and Gy. The
amplitude and edge orientation is computed as fol-lows: 2 2 | x y G = G +G (5) 1 tan ( x/ y) G − G G ∠ = (6)
Step 2. Finding important edges: This step ex-tracts the important edges of the gradient image by comparing a threshold value T1. We have chosen T1
= 25, which is approximately 10% of the maximum intensity value in the gray-level image.
As a result, each region can be presented as a feature vector that consists of color, texture, and shape feature, with the size of 104.
Step 3. Quantizing edge orientation: This step quantizes the edge histogram uniformly into n segment∠G1,∠G2,...,∠ . Twenty-four histogram Gn
bins where used in our system.
C. Principal component analysis (PCA)
Principal component analysis (PCA) is a useful statistical technique that has been applied in vari-ous fields such as image compression, dimensional reduction, etc. PCA aims to reduce a large set of variables to a small set meanwhile contains most of the information of the large set. The method gener-ates a new set of variables that are uncorrelated, called principal components, and they have the maximal variance.
Suppose that N image features are extracted from each image to form an original feature vector
1 2
{ , , , N}
X = x x x . Firstly, the symmetric covari-ance matrixC of the original feature vector is cal-x culated as Eq.(7). 1 1 ( )( ) 1 N T x i i i C x x x x N = = − − −
∑
(7)wherex , denotes the mean of x.
Subsequently, the eigenvalues of the symmetric covariance matrix are calculated, and be ordered in the decreasing sequence asλ λ1, 2, ,λN , and then
find out the corresponding eigenvectors: 1, 2, , N
E E E , respectively. One can create an
or-dered orthogonal basis with the first eigenvector having the direction of the largest variance of the data. This gives the components in the order of sig-nificance. The k-th principal componenty is given k
by :
1, 2, 3, , T
k k
y =E X k = … N (8)
The number of principal component is deter-mined by P, which is calculated as follows:
1 2 1 2 , where M N P λ λ λ N M λ λ λ + + + = > + + + (9)
By means of PCA, we can get a new feature set
{
y y1, 2, ,yM}
. In addition to the dimensionalre-duction, this set of feature variables can also have the maximal variance. For this reason, each image is presented with a lower dimensional feature vec-tor, which is an input of the two-phase Fuzzy-ART network.
III. TWO-PHASE FUZZY-ART NEURAL NETWORK
A. Fuzzy-ART neural network
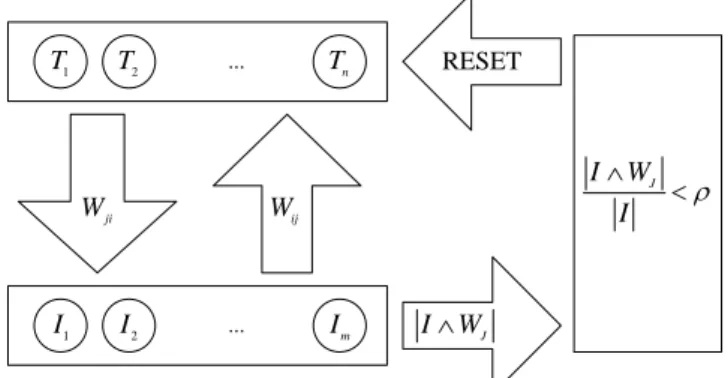
Fuzzy-ARTNN is an unsupervised learning clas-sifier and pattern recognition network. The tradi-tional Fuzzy-ARTNN is shown in Fig. 3. It consists of two layers of computing neurons: the input layer and the output layer, and a vigilance subsystem controlled by an adjustable vigilance parame-ter .The input vectors are applied to the Fuzzy-ART network sequentially. The network seeks for the “nearest” cluster that “resonance” with the input pattern according to a winner-take-all strategy and updates the cluster to become “closer” to the input vector. In the process, the vigilance parameter de-termines the similarity of the inputs belonging to the same cluster. The choice parameter and the learning rate are two other factors that influence the quality of the clustering results. The Fuzzy-ART algorithm proposed by G. A. Carpenter is summa-rized as follows:
Initially, each category in the output field is said to be uncommitted and corresponds to a weight vec-torWj = ⎣⎡wj1,wj2, ,wjm⎤⎦ which is set as
1(0) 2(0) (0) 1
j j jm
w =w = =w = (10)
wherew represents the weight between the m-th jm
input and the j-th output. According to the archi-tecture of Fuzzy ART, there are three parameters need to establish including the choice parame-terα >0, learning rateβ∈[0,1], and vigilance pa-rameterρ∈[0,1]
Step 2: Category choice
For each category, the choice function is defined by
j j j I W T W α ∧ = + (11)
where I is the input data and the fuzzy intersec-tion operator∧ is defined by
(
x∧y)
=min(
x yi, i)
.The chosen category is indexed byJwhere
{
}
max : 1, ,
J j
T = T j= n (12)
If more than one index j gives the maximumT , j
the node with the smallest index is chosen. Thus nodes become committed in order j=1, 2,3… Step 3: Resonance or reset resonance occurs if the match function of the chosen category meets the vigilance criterion. That is
J
I W
I ρ
∧
≥ (13) Then, the weight vector is updated for learning
ac-cording to the equation:
( ) (1 )
new old old
j j j
W =β I∧W + −β W (14)
For fast learning, the learning rate is set to one. Hence, Eq. (14) is simplified as
new old
j j
W = ∧I W (15)
On the other hand, mismatch reset occurs if
J
I W
I ρ
∧
< (16)
Then the value of the choice function TJ is reset to -1 for the duration of the input presentation to prevent its persistent selection during the search. A new index is chosen by Eq. (12). The search proc-ess continues until the chosen satisfies Eq. (13).
... 1 I I2 Im ji W Wij J I∧W RESET J I W I ρ ∧ < ... 1 T T2 Tn
Fig. 3. The architecture of the Fuzzy-ART
B. Two-phase Fuzzy-ART neural network
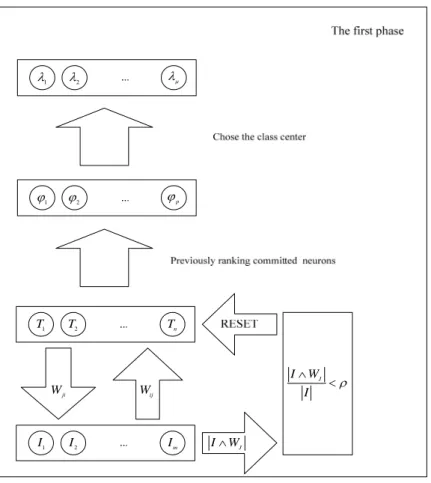
In order to obtain the desired classification re-sults, the supervised learning is needed. Therefore, we make changes from Fuzzy-ART into two-phase supervised Fuzzy-ART. Figure 4 shows the archi-tecture of the first phase two-phase fuzzy-ART neural network. In the first phase, the committed neurons { ,T1 ,Tn} were obtained by Fuzzy-ART and the previously ranking committed neurons were selected by statistics of training samples. Then these committed neurons were set to be the centers in the second phase. In the second phase, the choice function is defined by Eq. (11). The chosen category is indexed by Eq. (12). Figure 5 shows the second phase of two-phase Fuzzy-ART neural network. In the second phase, the best match neuron is selected only by Eq. (12) and Eq. (13). If the best match neuron is the expected result, the weight vector is updated by Eq. (14). Otherwise, the weight vector is updated as follows:
( ) (1 )
new old old
j j j
W =β I∧W − −β W (17)
IV. EXPERIMENTAL RESULTS AND DISCUSSIONS A total of 600 real-world images, selected from the
1 ϕ ϕ2 ϕp 1 I I2 Im ji W Wij J I∧W J I W I ρ ∧ < 1 T T2 Tn 1 λ λ2 λμ
Fig. 4. The first phase of the two-phase Fuzzy-ART.
Corel image collection, were used in our photo-graph analysis experiment. After JSEG, we choose 939 region images for training and testing. There are eight semantic categories in natural scene im-ages, In order to improve the classification accu-racy, an image must be correctly segmented before training. We then labeled the semantic category to each segmented region. We then labeled the seman-tic category to each segmented region.
1 I I2 Im ji W Wij 1 λ λ2 λμ
Fig. 5. The second phase of two phase Fuzzy-ART.
Table 1. The semantic categories and their corre-sponding color in block image
Semantic catego-ries Color Number of images Building 123 Cloud 127 Flower 111 Grass 112 Mountain 110 Sky/Water 138 Sun 101 Tree 117
A total of 104 features which consists of 64 color
features, 16 texture features, and 24 shape features, are extracted from each segmented region. Then the principal components of each feature vector where obtained by PCA. Accordingly, we reduced the di-mension of feature vectors and got a new feature vector. In this paper, we obtained the principal components of each feature vector using PCA with P≧0.8 and demonstrated the classification capabil-ity under 10, 15, 20, 25, and 30 principal compo-nents, respectively.
Therefore, for a given image, the analysis results are to sum the weight value of each semantic cate-gory occurring in the segmented region. For in-stance, for building category, we would obtain the weight value of building from the segmented re-gions and sum up these values into analysis result of building. Therefore, the percentage of the j-th semantic category can be defined as follows:
0 j k i j i W P S = =
∑
(18)where S denotes the image size, k represents the number of segmented regions, j
i
W is the size of the i-th segmented region of the j-th semantic category.
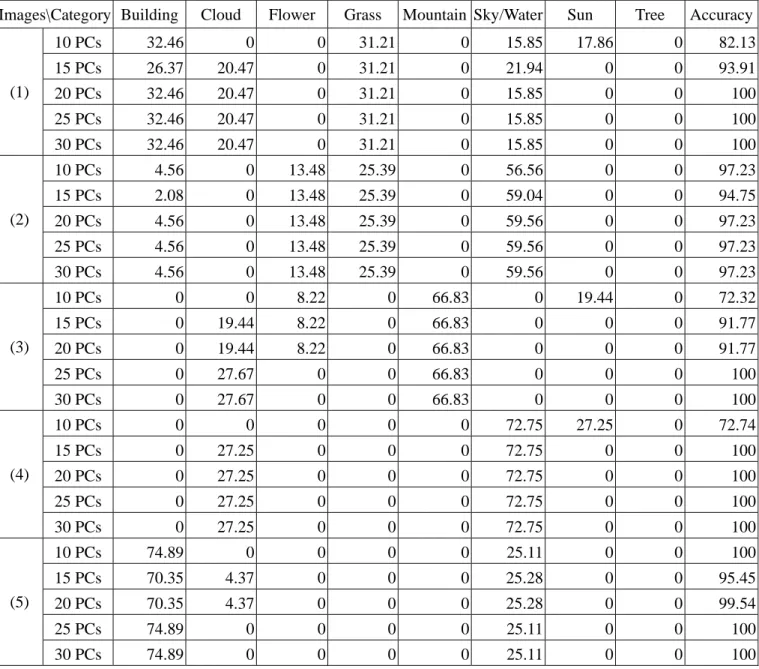
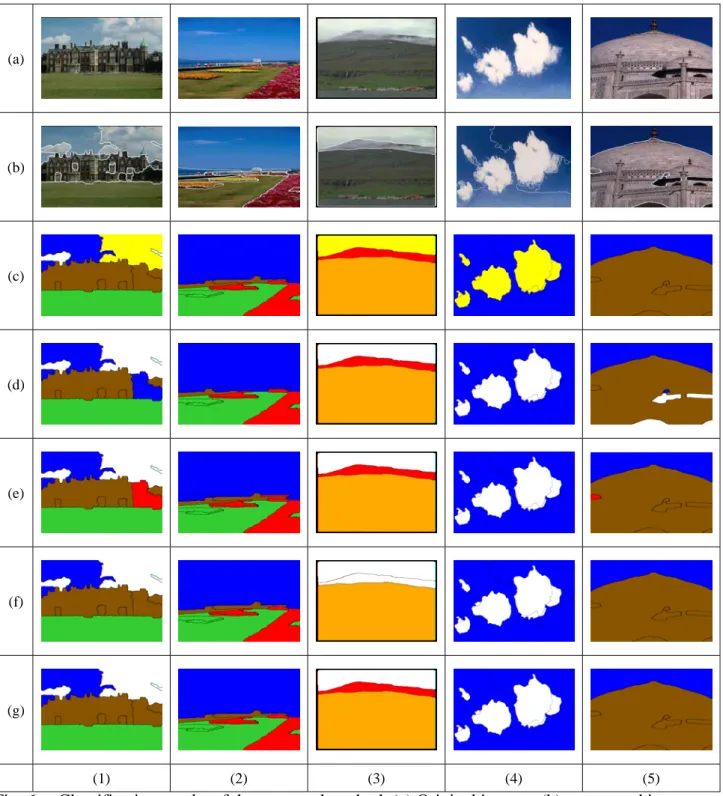
Figure 6 and table 2 show the results of seman-tic-based photograph analysis. Figure 6(b) shows the segmentation results of each image. Figure 6(c-g) shows the classification results with 10, 15, 20, 25, and 30 PCs, respectively. If the PCA was performed with 10 PCs, the classification results show that some cloud regions were classified to sun and flower, and the accuracy of the testing images were 82.13%, 97.23%, 72.32%, 72.74, and 100%, respectively. If the PCA was performed with 15 PCs, some building regions were classified to sky and cloud, some cloud regions were classified to flower, and the accuracy of the testing images were 93.91%, 94.75%, 91.77%, 100, and 95.45%, re-spectively. If the PCA was performed with 20 PCs, some building and cloud regions were classified to flower, and the accuracy of the testing images were 93.91%, 97.23%, 91.77%, 100, and 99.54%, re-spectively. If the PCA was performed with 25 PCs, the accuracy of the testing images were 93.91%, 97.23%, 91.77%, 100, and 100%, respectively. If the PCA was performed with 30 PCs, some cloud regions were classified to flower. These results show that the accuracy increased if the PCA was performed and the suitable features were selected. Figure 7 and table 3 show the comparative results of two-phase Fuzzy-ART, RBF, and LVQ with 30
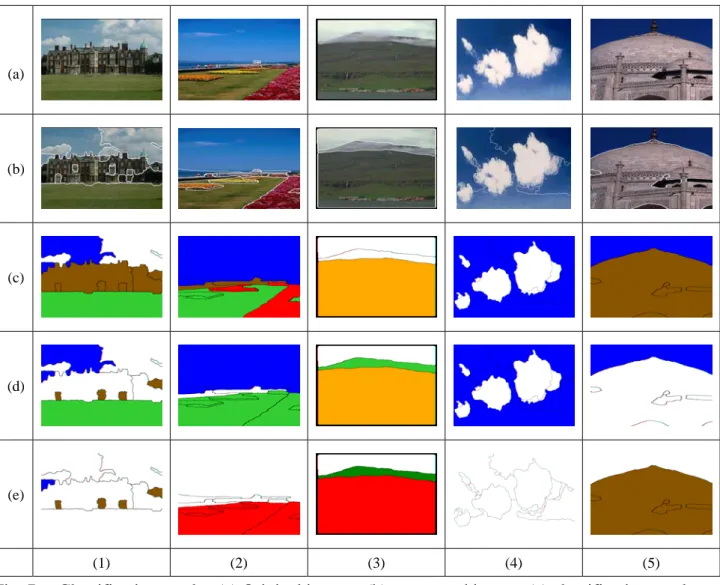
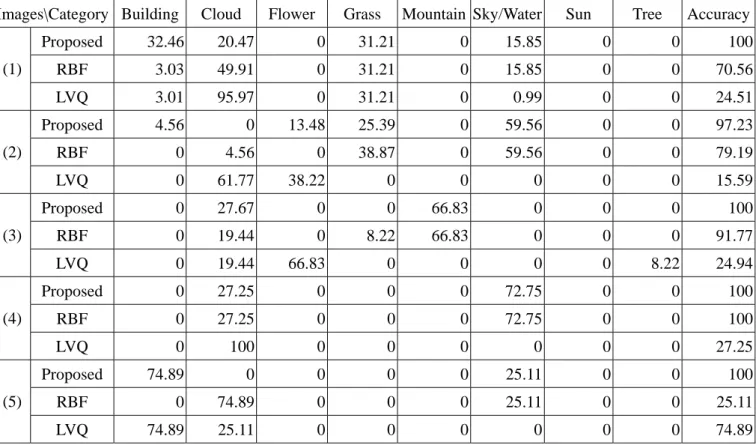
PCs in semantic-based photograph analysis. In two-phase Fuzzy-ART, the accuracy of the testing images were 100%, 97.23%, 100%, 100%, and 100%, respectively. In RBF, the accuracy of the testing images were 70.56%, 79.19%, 91.77%, 100%, and 25.11%, respectively. In LVQ, the ac-curacy of the testing images were 24.51%, 15.59%, 24.94%, 27.25%, and 74.89%, respectively. The classification results of the proposed two-phase Fuzzy-ART neural network are batter than the other comparative neural networks. Therefore, the pro-posed method has high performance, and the clas-sification results are quite close to human visual perception.
V. CONCLUSIONS
In this paper, we proposed a two-phase Fuzzy-ART neural network for semantic-based image analysis. We used low-level features to de-scribe eight high-level semantic items. The PCA is applied to reduce dimensionality and to extract dis-criminative features. Experimental results show that the proposed method classified the contents of photographs correctly and efficiently. And the clas-sification results are close to human visual percep-tion.
ACKNOWLEDGMENT
This work was supported by the National Science Council of Taiwan, Republic of China, under Grant NSC-96-2221-E-224-070.
REFERENCE
[1] C. Faloutsos, R. Barder, M. Flickner, J. Hafner, W. Niblack, D. Petkovic, and W. Equitz, “Effi-cient and effective querying by image content,” J. Intell. Inform. Systems, vol. 3, pp. 231-262, 1994.
[2] Y. Liu, D. Zhang, G. Lu, and W.Y. Ma, “Re-gion-based image retrieval with high-level se-mantic color names,” in: Proc. of the 11th In-ternational Multimedia Modelling Conference, pp. 180-187, 2005.
[3] A. C. Rencher, Methods of Multivariate Analysis, John Wiley and Sons INC,1995.
[4] M. Collins, Sanjoy Dasgupta, and Robert E. Schapire, “A generalization of principal com-ponent analysis to the excom-ponential family,” Advances in Neural Information Processing Systems, vol.14, pp. 617–624, 2001.
“Fuzzy ART: fast stable learning and
catego-rizing of analog patterns by an adaptive reso-nance system,” Neural Networks, vol. 4, pp. 759–771, 1991.
[6] Y. Deng and B. S. Manjunath, “Unsupervised segmentation of color texture regions in im-ages and video,” IEEE Trans. Pattern Anal. Mach. Intell. Vol. 23, issue 8, pp. 800–810, 2001.
[7] A. K. Jain and A. Vailaya, “Image retrieval us-ing color and shape,” Pattern Recognit., vol. 29,
pp. 1233-1244, 1996.
[8] A. Vailaya, A. Jain, and H.J. Zhang, “On image classification: city vs. landscape,” in: Proc. of the IEEE Workshop on Content-Based Access of Image and Video Libraries, pp. 3-8, June 1998.
[9] F. Mahmoudi, J. Shanbehzadeh, A. M. Eftek-hari-Moghadam, and H. Soltanian-Zadeh, “Image retrieval based on shape similarity by edge orientation autocorreslogram,” Pattern Recognit., vol. 36, pp. 1725-1736, 2003.
Table 2. The classification results of the proposed method with respectively 10, 15, 20, 25, and 30 PCs in Fig. 6 (unit: %).
Images\Category Building Cloud Flower Grass Mountain Sky/Water Sun Tree Accuracy 10 PCs 32.46 0 0 31.21 0 15.85 17.86 0 82.13 15 PCs 26.37 20.47 0 31.21 0 21.94 0 0 93.91 20 PCs 32.46 20.47 0 31.21 0 15.85 0 0 100 25 PCs 32.46 20.47 0 31.21 0 15.85 0 0 100 (1) 30 PCs 32.46 20.47 0 31.21 0 15.85 0 0 100 10 PCs 4.56 0 13.48 25.39 0 56.56 0 0 97.23 15 PCs 2.08 0 13.48 25.39 0 59.04 0 0 94.75 20 PCs 4.56 0 13.48 25.39 0 59.56 0 0 97.23 25 PCs 4.56 0 13.48 25.39 0 59.56 0 0 97.23 (2) 30 PCs 4.56 0 13.48 25.39 0 59.56 0 0 97.23 10 PCs 0 0 8.22 0 66.83 0 19.44 0 72.32 15 PCs 0 19.44 8.22 0 66.83 0 0 0 91.77 20 PCs 0 19.44 8.22 0 66.83 0 0 0 91.77 25 PCs 0 27.67 0 0 66.83 0 0 0 100 (3) 30 PCs 0 27.67 0 0 66.83 0 0 0 100 10 PCs 0 0 0 0 0 72.75 27.25 0 72.74 15 PCs 0 27.25 0 0 0 72.75 0 0 100 20 PCs 0 27.25 0 0 0 72.75 0 0 100 25 PCs 0 27.25 0 0 0 72.75 0 0 100 (4) 30 PCs 0 27.25 0 0 0 72.75 0 0 100 10 PCs 74.89 0 0 0 0 25.11 0 0 100 15 PCs 70.35 4.37 0 0 0 25.28 0 0 95.45 20 PCs 70.35 4.37 0 0 0 25.28 0 0 99.54 25 PCs 74.89 0 0 0 0 25.11 0 0 100 (5) 30 PCs 74.89 0 0 0 0 25.11 0 0 100
(a) (b) (c) (d) (e) (f) (g) (1) (2) (3) (4) (5) Fig. 6. Classification results of the proposed method. (a) Original images, (b) segmented image
(c) classification result with original 10 PCs, (d) classification result with 15 PCs, (e) classification result with 20 PCs, (f) classification result with 25 PCs, (g) classification result with 30 PCs.
(a) (b) (c) (d) (e) (1) (2) (3) (4) (5) Fig. 7. Classification results. (a) Original images, (b) segmented images (c) classification results
Table 3. The classification results with 30 PCs respectively of the proposed method, RBF, and LVQ in Fig. 7 (unit: %).
Images\Category Building Cloud Flower Grass Mountain Sky/Water Sun Tree Accuracy Proposed 32.46 20.47 0 31.21 0 15.85 0 0 100 RBF 3.03 49.91 0 31.21 0 15.85 0 0 70.56 (1) LVQ 3.01 95.97 0 31.21 0 0.99 0 0 24.51 Proposed 4.56 0 13.48 25.39 0 59.56 0 0 97.23 RBF 0 4.56 0 38.87 0 59.56 0 0 79.19 (2) LVQ 0 61.77 38.22 0 0 0 0 0 15.59 Proposed 0 27.67 0 0 66.83 0 0 0 100 RBF 0 19.44 0 8.22 66.83 0 0 0 91.77 (3) LVQ 0 19.44 66.83 0 0 0 0 8.22 24.94 Proposed 0 27.25 0 0 0 72.75 0 0 100 RBF 0 27.25 0 0 0 72.75 0 0 100 (4) LVQ 0 100 0 0 0 0 0 0 27.25 Proposed 74.89 0 0 0 0 25.11 0 0 100 RBF 0 74.89 0 0 0 25.11 0 0 25.11 (5) LVQ 74.89 25.11 0 0 0 0 0 0 74.89