行政院原子能委員會
委託研究計畫研究報告
【太陽能及乙醇/氫氣轉換之量子化學計算模擬及實驗驗證】 【Quantum Simulations of Solar Energy and Ethanol to Hydrogen
Conversion Processes with Experimental Validations】
計畫編號:962001 INER 0028 受委託機關(構):國立交通大學 計畫主持人:林明璋 核研所參與人員:謝宏明 聯絡電話:(03)5731696 E-mail address:[email protected] 報告日期:96 年 11 月 23 日
I 目 錄 目 錄...I 中文摘要...1 英文摘要...3 壹、計畫緣起與目的...5 貳、研究方法與過程...8 一、Ethanol to H2 conversion...8 二、Si-quantum dots...27
三、InN/TiO2 related calculations...41
四、Functionalization of TiO2 surface...52
五、Relativistic parameterization of the SCC-DFTB method...60
六、Ethanol to H2 conversion...68
1 中文摘要
本計畫是為期四年行政院原子能委員會委託研究計畫之第三
年執行結果摘要。這一年主要的工作在繼續進行以下兩個目標:1. 利
用大型電腦計算解釋InN/TiO2太陽能電池的製作機制及InN 與 TiO2
之間利用量子點及有效的化學鍵製作方法。2. 理論與實驗驗證 L. D. Schmidt 的 Rh/CeO2 乙醇轉換氫氣催化劑的性能,並進而研究發現 新而便宜的催化劑。 在乙醇轉換氫的實驗上,今年實驗結果發現,Ru/CeO2/Al2O3 催化分解乙醇與水的混合物目前已得到 120%的轉換率,Ru 金屬比 Rh 較便宜 25 倍;另外,研究 CeO2與 ZrO2混合氧化物的實驗已在 進行中。 大型量子計算可分為三方面,1. 乙醇轉氫在不同催化劑表面反 應基制的研究。2. 量子點在 TiO2 表面吸附的能量與結構。3. 發展 SCC-DFTB 將應用於乙醇轉氫及量子點/TiO2方面大型計算的元素參 數。 在乙醇轉氫方面的計算,今年主要在了解水氣轉氫 (CO+H2O → CO2 +H2) 在 Rh/CeO2 上 的 反 應 機 制 及 能 量 。 也 進 行 乙 醇 在
Rh/CeO2/ZrO2催化劑上的吸附及分解,同時,CuO/Al2O3對乙醇轉氫
的可行性也在計算中。
在量子點/TiO2 系統的計算,今年著重於(InN)x/OY(O)O/TiO2
(Y=B and P)及(Si)x 量子點兩系統的研究,不同量子點的大小影響
TiO2帶隙的計算,已供給良好的結果。
在SCC-DFTB 程式的發展,目前也有很好的進展,這個程式的
2
的計算,諸如Rux/CeO2/Al2O3催化系統應用於乙醇轉氫的反應機制,
將可用此程式研究並得反應速度常數。
除了上述的計算外,H2S、H2O2及H3BO3在TiO2表面反應的計
算已完成;類似計算研究以 H3PO3作 InN 及 TiO2中間的 linker 已在
3
Abstract
This is the report for the third of the 4-year research project on the computational and experimental studies of the InN/TiO2 system
and/or the catalytic conversion of ethanol to hydrogen by the Schmidt type technique employing the Rh/CeO2 and other catalysts. Our goals are
two-fold: 1. Utilization of the large scale computation to elucidate processes relevant to the InN/TiO2 solar cell system including
quantum-dot and chemical functional-group modifications of the InN-TiO2 interface; 2. Experimental and computational studies of
Schmidt’s ethanol to H2 conversion processes in order to search for
cheaper and equally efficient catalysts.
For the ethanol to H2 conversion studies, experimentally we
have demonstrated that the Ru/CeO2/Al2O3 catalyst performed better
than Schmidt’s Rh/CeO2/Al2O3 catalyst, reaching >120% H2 conversion
efficiency from autothermal oxidation with mixtures of C2H5OH and
H2O. Ru is cheaper than Rh commercially by a factor of 25.
Computationally, we have continually focused on three aspects: 1. Catalytic conversion of ethanol to H2; 2. Electronic structures of
quantum dots (QDs) attached to TiO2 nanoparticles; 3. Development of
the SCC-DFTB (self-consistent charge-density functional theory tight-binding) method for large atomic/molecular cluster calculations.
For the ethanol to hydrogen conversion related calculations, we have completed the study of the H2O+CO water-gas shift reaction on the
Rh/CeO2 catalyst. The reaction was found to be obeying the
Langmuir-Hinshelwood mechanism through chemisorption of both H2O
4
dissociation of H2O(a) and oxidation of CO(a) by HO(a). In addition,
calculations for adsorption and decomposition of ethanol on Rh/CeO2-ZrO2 and CuO/Al2O3 have also been finished.
For the QD/TiO2 related calculations, focus has been placed on
(InN)n/OY(O)O/TiO2 (n=1-10) (Y=B and P) and (Si)x (x>100). The
effects of QD-sizes on the system’s band gap have been clearly elucidated. Most importantly the effect of the OY(O)O linker between InN and TiO2 has been interpreted.
For the development of the SCC-DFTB method, a basic code for the establishment of elemental parameters has been completed, and the effort on the conversion of binding properties of key elements involved in the fabrication of the QD-solar cells and ethanol to H2
conversion is being made.
Aside from the aforementioned large practical systems, we have also carried out detailed potential energy surfaces for reactions of H2S,
H2O2 and H3YO3 (Y=B and P) on TiO2 surfaces. These reactions are
directly relevant to the OMCVD of the (InN)x/OY(O)O/TiO2 and
5 壹、計畫緣起與目的 有鑑於地球能源問題已開始受到重視,尋求相關取代能源已 是迫不及待,而目前以燃料電池及太陽能電池為首要研究目標。在 燃料電池方便,由於考慮到環保上相關的問題,因此希望發展出一 套良好的乙醇轉換為氫氣的系統。希望此套系統能得到最高的轉換 效率,並且不對環境造成破壞影響。目前此方向之研究又以 Schmidt 所得到的將近百分之ㄧ百的轉換為最優[1],而此相關研究中,最理想 的狀況下,甚至可以得到百分之一百六十六的轉換效率,所以本次 計劃將以此理論為根本,希望發產出更進一步的結果。 乙醇是一種”綠色”(環保)燃料,在台灣它可以利用糖或甘蔗等 農產品發酵而製造。台灣的亞熱帶地理位置適合發展以乙醇作為未 來可能的永續能源,尤其是在燃料電池的應用方面。很不幸的,乙 醇目前無法直接地被用於燃料電池,因為它和碳氫化合物具有相同 的碳原子位置的問題。燃燒電池除產生電能外,其副產物僅為水及 熱能,因此具有低污染的優點,是一種可產生環保能源的方法。 Schmidt 等人[1]所採用的一個策略就是利用貴重金屬,如: Pt 或 Rh 吸 附在金屬氧化物,如: CeO2或La2O3上面。他們利用在陶瓷泡狀結構 上的Rh/CeO2觸媒可以達到 95% 以上之轉化率。他們利用乙醇和水 的混合物,藉由眾所周知的水煤氧反應CO + H2O →CO2 + H2之助, 可以達到115%的轉化率。這些令人振奮的結果顯示利用乙醇這種真 正環保且不多產生 CO2的燃料來取代日漸昂貴且對環境極具殺傷力 的石化燃料,如石油和天然氣,已經變為可能。 在太陽能電池的研究方面,最近,主持人與其研究群藉由有
6 機金屬化學沉積的方式TiO2的奈米粒子上成長出不同厚度且品質優 良的InN 薄膜[2],吸收光譜顯示吸收波段為UV/visible 範圍內 390 nm 到 800 nm 波長的寬廣吸收。為了了解 InN 光敏化 TiO2奈米粒子薄 膜的結構與電子能態及對吸收波長的影響以及促進電子由 InN 移轉 到TiO2奈米薄膜的效率,量子點及有效的化學鍵,諸如 Si 及 InP 量 子點和-OB(O)O、-OP(O)OO、>Si(O)O 等化學根在 TiO2表面吸附能 量必須估計。這類資料必須利用新進的量子計算軟體與高速電腦的 工率才能得知,故與國網中心的合作是非常必要的,因為台灣在這 方面的大型計算尚遠落後於日本、美國及歐盟國家。 以超級電腦進行大尺度的計算以模擬相關化學反應及物理現 象已經變成尖端材料研究及元件製造的一個不可或缺的部份。此種 模擬計算可以幫助吾人瞭解所欲研究的系統中支配的物理法則及化 學機制,因而提昇研究品質及產品開發的效率。在這方面,台灣是 遠落於美國、日本和歐洲之後。為了增進台灣利用大型計算的能力, 尤其是改進 InN/TiO2奈米粒子太陽電池之製程及效率[2]以及乙醇-氫 氣的催化轉化效率[1],我們擬模擬 InN 薄膜沉積的反應,尤其是將 重點放在利用自組官能基形成奈米量子點的過程,並研究其與不同 頻帶邊(band edge)之金屬氧化物混合之效應。我們也將研究乙醇催化 轉化成氫氣的機制,希望能夠找到一個比最近Schmidt 等人[1]所提出 來的Rh/CeO2更為價廉且更具效率的非均相觸媒。 此計劃將專注於利用最先進的量子化學計算,系統化地研究 在含有Si, InP 及其他金屬氧化物量子點的 InN/QDs/TiO2系統中,使
TiO2奈米粒子表面官能化的反應機構以及乙醇在吸附在CeO2, La2O3,
7 制,並比較不同金屬的催化效率,以瞭解其催化的基本物理及化學 原理。一旦催化劑的催化明確性以及其金屬氧化物基質的關連作用 被瞭解,則我們可以利用量子化學理論計算探尋較具經濟效益的金 屬催化物及其金屬氧化物基質;吸附在Al2O3, TiO2或 ZnO 等奈米粒 子上面的Fe, Co, Cu 或 Ag 金屬奈米粒子的催化作用將會被仔細地研 究。為了落實理論計算的結果,我們亦將利用一個類似 Schmidt 等 人[1]所使用的小型的反應系統,以實驗來測量理論計算所建議的觸媒 及其金屬氧化物基質的乙醇轉化效率。理論與實驗相結合來研究 InN/TiO2沉積以及乙醇-氫氣轉化過程,將可對其將來在工業上的應 用提供寶貴的資訊。 References:
1. G. A. Deluga, J. R. Salge, L. D. Schmidt, X. E. Verykios, Science, 2004, 303, 993.
8 貳、研究方法與過程
一、Ethanol to H2 conversion:
(一) J. J. Ho(何嘉仁):
We applied the periodic density-functional theory (DFT) to investigate the dehydrogenation of ethanol and the followed steam reforming reactions on the 4Rh/CeO2 (111) surface. We assumed
that one O2 molecule diffused into the O vacancy on 4Rh/CeO2-X
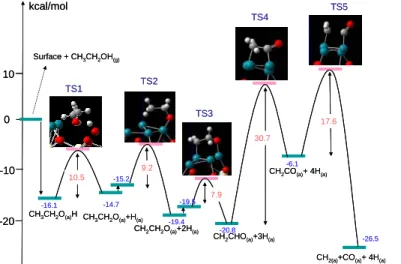
(111) surface, and under this circumstance, the adsorption energy of ethanol adsorbed on the surface was calculated to be -16.1 kcal/mol. Before forming a five-membered ring of an oxametallacyclic compound, the hydrogen atom of O-H and that of one β-carbon hydrogen from ethanol are first eliminated. The dehydrogenation reaction continues with the loss of two hydrogens from the α-carbon, at the same time, transforming to four-membered ring species (Rh-CH2CO-Rh). Scission of the C-C bond occurs at this stage
with a dissociation barrier 17.6 kcal/mol. Finally, the adsorbed products of CO、CH2 and 4H could be observed. In the steam
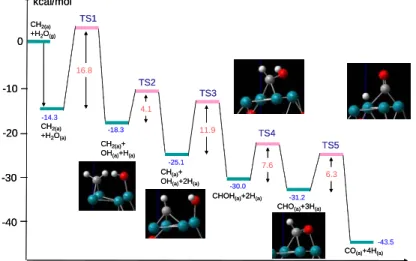
reforming process (CH2 + H2O), the hydrogen dissociation of CH2
and H2O occurs first, forming the species CH and OH, respectively.
The CH prefers to associate with OH to form intermediate CHOH rather than further dissociates into C and H. The intermediate CHOH then dissociates the two hydrogens consecutively and forms CO and 2H. Finally, the adsorbed products of CO and 4H could be observed.
On the basis of the oxygen storage capacity (OSC) of ceria (CeO2) and the dissociation of C-C bond activated by Rhodium, the
9
Rh/CeO2 is considered to be a suitable catalyst for decomposition of
ethanol. We apply the density-functional theory (DFT) to calculate the possible pathways for the dehydrogenation of ethanol and steam reforming reactions (CH2 + H2O) on a 4Rh/CeO2-(111)-(3x2)
surface. Both the adsorbed intermediates and the reaction barriers in the dissociation pathways as well as the possible potential-energy surfaces are presented.
We applied plane-wave periodic density-functional theoretical calculation implemented in the Vienna ab initio simulation program (VASP). The generalized gradient approximation (GGA) of Perdew and Wang (PW91) was used for the exchange-correlation functional. The projector–augmented wave method (PAW), an all–electron method combining the accuracy of augmented plane waves with the cost–effective pseudopotentials implemented in VASP, is applied. The k-points set we used was 4x6x1with a spin polarized calculation. The Rh/CeO2(111) surface
was modeled as 3x2 super cells with dimensions a ) 11.49 Å, b ) 7.65 Å, and c ) 18.98 Å, including the vacuum region with a thickness ca. 12 Å. The top three atomic layers of the slab as well as the adsorbates were allowed to relax. The bottom three atomic layers were held fixed at the bulk positions of ceria. Moreover, the transition states in possible dehydrogenation and steam reforming reaction processes were studied with the Nudged Elastic Band (NEB) method.
1. Dehydrogenation of ethanol
The adsorption energy of ethanol adsorbed on the surface (through the O of ethanol) was calculated to be -16.1 kcal/mol.
10
Moreover, we also calculated the possible dehydrogenation process upon this surface. The proposed possible subsequent pathways for dehydrogenation of ethanol on the 4Rh/CeO2-(111)
surface are schematically depicted in Scheme 1; the calculated corresponding potential-energy surfaces are drawn in Figure 1.
Scheme 1. The possible reaction pathways for the dehydrogenation of ethanol on a 4Rh/CeO2-(111) surface.
Figure 1. Calculated possible potential-energy diagram for the dehydrogenation of ethanol on the 4Rh/CeO2(111) surface.
2. Steam reforming of CH2 ( CH2+H2O )
It is possible to carry out a steam reforming reaction of CH2+H2O
to form more hydrogens. The proposed possible subsequent pathways are depicted in Scheme 2; the calculated corresponding potential-energy surfaces are drawn in Figure 2.
kcal/mol Reaction coordinate 0 -10 10.5 9.2 30.7 17.6 7.9 Surface + CH3CH2OH(g)
CH3CH2O(a)H CH3CH2O(a)+H(a)
CH2CH2O(a)+2H(a)
CH2CHO(a)+3H(a)
CH2CO(a)+ 4H(a)
CH2(a)+CO(a)+ 4H(a)
-16.1 -14.7 -15.2 -19.4 -19.5 -20.8 -6.1 -26.5 TS2 TS1 TS3 TS4 TS5 -20 10 kcal/mol Reaction coordinate 0 -10 10.5 9.2 30.7 17.6 7.9 Surface + CH3CH2OH(g)
CH3CH2O(a)H CH3CH2O(a)+H(a)
CH2CH2O(a)+2H(a)
CH2CHO(a)+3H(a)
CH2CO(a)+ 4H(a)
CH2(a)+CO(a)+ 4H(a)
-16.1 -14.7 -15.2 -19.4 -19.5 -20.8 -6.1 -26.5 TS2 TS1 TS3 TS4 TS5 -20 10
11
Scheme 2. The possible reaction pathways for steam reforming of CH2 on a 4Rh/CeO2-(111) surface.
Figure 2. The calculated possible potential-energy surfaces for the steaming reforming of CH2 on the surface of 4Rh/CeO2(111).
3. Conclusion
The subsequent dehydrogenation of ethanol follows the processes starting the –OH group, then β -CH ,and α -CH, forming a four-membered ring intermediate CH2CHO on the surface, and
the barriers are 10.5, 9.2, and 7.9 kcal/mol, respectively. One more dehydrogenation of α-CH taking place to form CH2CO
(with barrier of 30.7 kcal/mol), then it breaks the C-C bond (17.6 kcal/mol of barrier) to form CH2 and CO two separate subgroups
absorbed on the surface. After further steam reforming of CH2
with H2O, the final adsorbed products of 2CO, and the total 8H kcal/mol Reaction coordinate 0 -10 -20 -30 -40 16.8 4.1 CH2(a) +H2O(g) -14.3 -18.3 -25.1 -30.0 -31.2 -43.5 TS2 TS1 TS3 TS4 TS5 11.9 7.6 6.3 CH2(a) +H2O(a) CH2(a)+ OH(a)+H(a) CH(a)+ OH(a)+2H(a)
CHOH(a)+2H(a)
CHO(a)+3H(a)
CO(a)+4H(a) kcal/mol Reaction coordinate 0 -10 -20 -30 -40 16.8 4.1 CH2(a) +H2O(g) -14.3 -18.3 -25.1 -30.0 -31.2 -43.5 TS2 TS1 TS3 TS4 TS5 11.9 7.6 6.3 CH2(a) +H2O(a) CH2(a)+ OH(a)+H(a) CH(a)+ OH(a)+2H(a)
CHOH(a)+2H(a)
CHO(a)+3H(a)
12 could be observed.
The dehydrogenation of second α -CH might be the rate-determined step of aforementioned reaction, since its calculated barrier height is 30.7 kcal/mol, the highest over all. References:
1. H. L. Chen, S. H. Liu and J. J. Ho, J. Phys. Chem. B, 2006 , 110, 14816.
2. H. Idriss, Platinum Met. Rev., 200, 448, 105.
3. S. G. Wang, D. B. Cao, Y. W. Li, J. Wang and H. Jiao, J. Phys. Chem. B, 2006, 110, 9976.
4. S. G. Wang, X. Y. Liao, Jia. Hu, D.B. Cao, Y. W. Li, J. Wang and H. Jiao, Surf. Sci., 2007, 601, 1271.
(二) M. Hayashi(林倫年):
In the past year, we first optimized the geometries of Ce0.5Zr0.5O2 (111) surface and γ- Al2O3 (110) surface and then
obtained the most probable adsorption sites of a 4Rh cluster or a Rh atom on the respective surfaces. We then investigated dehydrogenation of ethanol on 4Rh/ Ce0.5Zr0.5O2 (111) surface and
Rh/γ-Al2O3 (110) surface. A possible chemical reaction path for
the dehydrogenation of ethanol was proposed for each surface system. Recently, we have been studying several transition state searching algorithms and a possible application of adaptive kinetic Monte Carlo simulation, combined with transition state theory, for chemical reactions taking place on a surface.
Geometry optimization and energy calculations were carried out based on Density functional theory. The exchange-correlation
13
functional was approximated by Perdew and Wang PW91[1] generalized gradient approximation (GGA) functional[2]. All calculations were performed using Vienna ab initio simulation program (VASP)[3-5] that uses plane-wave basis set and projected augmented wave (PAW) [6-7] for inner cores.
Geometry optimization for stable geometries was performed with the conjugate gradient algorithm (CG) method [8 and references
therein]. For transition state search, nudged elastic band (NEB)
method [8 and references therein] was used in which the energies of several “images” (7~8 images) were scanned. Each image was partially optimized by fixing the geometrical parameter related to the reaction and relaxing the rest. For both surfaces, the cutoff energy was set to 350eV or 400eV and the k points were 4×4×4 for Ce0.5Zr0.5O2 surface and 2×2×1 for γ-Al2O3 (110) surface.
Ce0.5Zr0.5O2 surface was constructed as follows; (1) CeO2
crystal with Fm3m space group was constructed (lattice constants a = b = c =5.41Å); (2) since the ratio of the number of Ce atom to that of O atoms in the unit cell is C:O = 4:8, the number of Zr atoms in the unit cell was chosen such that Ce:Zr:O=2:2:8 and the structure was re-optimized and the resulting lattice constants were a = b = 5.285 Å and c=5.300 Å. A 3×2×1 slab model for 2×3
Ce0.5Zr0.5O2 (111) was then constructed by taking 6-layer from the
optimized Ce0.5Zr0.5O2. The dimension of the slab model was a =
7.4863 Å, b = 11.132 Å and c=18.5 Å. The c-axis has the vacuum layer. In the slab model, the atom positions of the lower 3 layers were fixed while the upper 3 layers were freely relaxed. A reaction mechanism of the dehydrogenation of ethanol on Ce0.5Zr0.5O2 (111)
14
surface, Rh/Ce0.5Zr0.5O2 (111) and 4Rh/ Ce0.5Zr0.5O2 (111) was
investigated based on the slab model.
A similar process was employed for γ-Al2O3 (110). The unit
cell of monoclinic γ-Al2O3 crystal consists of about 40 atoms
equivalent to 8Al2O3. A slab model of γ-Al2O3 (110) was
constructed with 8 layers in which the lower 3 layers were fixed and the rest free. 32 Al atoms and 48 O atoms were included in the slab model. The vacuum layer has 14 Å long along c-axis. The k points were set to 6×4×4 . A reaction mechanism of the dehydrogenation of ethanol on the slab model of γ-Al2O3 (110)
surface was studied.
In these studies, LDA(GGA)+U was not taken into account. 1. Dehydrogenation of ethanol on Rh/Ce0.5Zr0.5O2 (111) surface and
4Rh/Ce0.5Zr0.5O2 (111) surface
The major difference in the optimized structures of the slab models of CeO2 (111) and Ce0.5Zr0.5O2 (111) surfaces is that the
first layer of CeO2 has a homogeneous Ce-O bond length of 2.34
Å while Ce-O and Zr-O bond lengths are distributed within 2.11 Å ~ 2.41Å. As a result, in Ce0.5Zr0.5O2 (111) there exist many
possible active sites that can adsorb ethanol molecules or Rh atoms upon deposition. Thus the first task is to determine the most probable adsorption site of ethanol on the slab model of Ce0.5Zr0.5O2 (111) surface. It is found that the adsorption energy
is -10.2 kcal/mol if adsorption takes place on Ce site and this is about 1.1 kcal/mol larger than Zr site. Once the H atom of the EtO(a)-H is dissociated and formed O-H bond on the surface, the
15
adsorption energy of EtO- becomes 46.0 kcal/mol while 18.7 kcal/mol is obtained for Zr site. We conclude that the most probable adsorption site of EtOH should be Ce site. For a Rh atom deposition, we find that if Rh is added at the middle of 3 Ce atoms with a slight displacement on the top layer the largest adsorption energy is obtained for Ce2O (111) surface. For
Ce0.5Zr0.5O2 (111) surface, more serious displacement occurs
forming 2.61 Å for Zr-O and 1.98 Å for Rh-O. We also consider 4Rh cluster adsorbed on Ce0.5Zr0.5O2 (111) surface.
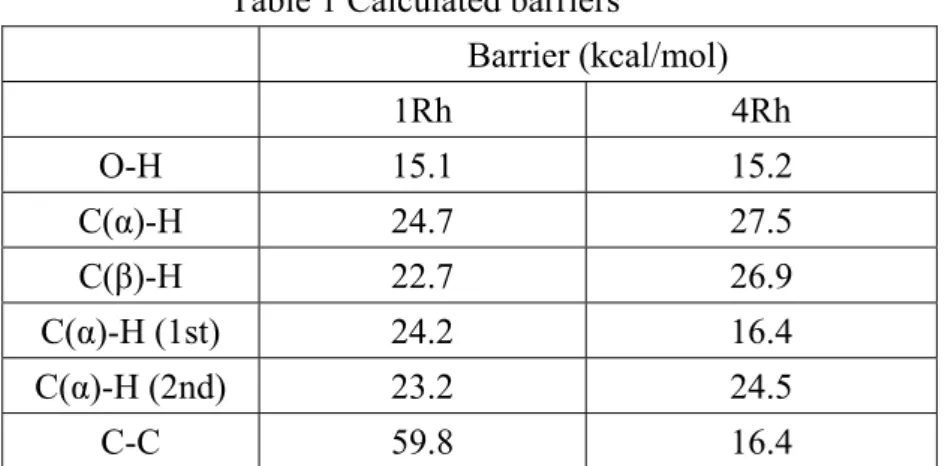
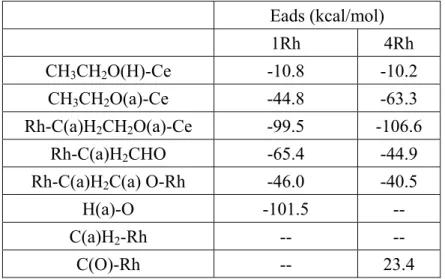
It is found that there are 9 intermediate products including 4 isomers and 6 transition states for one Rh adsorption. For the 4Rh deposition case, one more intermediate product is found. Table 1 lists the calculated barriers for the dehydrogenation of ethanol on these two surfaces. It is found that deposition Rh dramatically reduces C-C bond breaking energy while barriers for dehydrogenation do not show such a drastic effect. Table 2 presents adsorption energies of intermediate products. For 4Rh case, C(a)H2-Rh and C(O)-Rh are found. The CO may remove an
O atom from the surface and then form CO2 to dissociate from
the surface.
Table 1 Calculated barriers
Barrier (kcal/mol) 1Rh 4Rh O-H 15.1 15.2 C(α)-H 24.7 27.5 C(β)-H 22.7 26.9 C(α)-H (1st) 24.2 16.4 C(α)-H (2nd) 23.2 24.5 C-C 59.8 16.4
16
Table 2 Calculated adsorption energies of intermediate products
Eads (kcal/mol) 1Rh 4Rh CH3CH2O(H)-Ce -10.8 -10.2 CH3CH2O(a)-Ce -44.8 -63.3 Rh-C(a)H2CH2O(a)-Ce -99.5 -106.6 Rh-C(a)H2CHO -65.4 -44.9
Rh-C(a)H2C(a) O-Rh -46.0 -40.5
H(a)-O -101.5 --
C(a)H2-Rh -- --
C(O)-Rh -- 23.4
Our reaction mechanism of dehydrogenation of ethanol on 4Rh/ Ce0.5Zr0.5O2 (111) surface can be summarized as follows:
(i) CH3CH2OH Æ CH3CH2O(a) + H(a)
(ii-a) CH3CH2O(a)Æ CH3CHO + H(a)
(ii-b) CH3CH2O(a)Æ C(a)H2CH2O(a)+H(a)
(iii) C(a)H2CH2O(a) Æ C(a)H2CHO + H(a)
(iv) C(a)H2CHO Æ C(a)H2C(a)O + H(a)
(v) C(a)H2C(a)O Æ C(a)H2 + C(a)O
The second step splits into two since removal of H can be started from C(α)-H or C(β)-H that produce aldehyde and oxametallacycle structure, respectively. The oxametallacycle structure leads to formation of C(a)H2+CO(a) whose energy
barrier requires only 16.4 kcal/mol. If C(a)H2 removes 2 H atoms
adsorbed nearby the C adsorption site, CH4 can be easily formed.
With stem reforming process, H2 is produced by
(vi) CH4 +H2O Æ 3H2 + CO.
(vii) CO + H2O Æ H2 + CO2.
17
Our calculation also indicates that CO(g) may remove an O atom from the surface and this may, in turn, form O vacancy as an additional reactive site on the surface. To treat this problem correctly, one should at least use LDA+U method to take into account a 4f electron that is generated by Ce2O4ÆCe2O3 + O type
of reaction, in other words, Ce4+ obtains one electron in 4f orbital and form Ce3+. It should be interesting to study chemical reactivity of O vacancy or defect site.
2. Dehydrogenation of ethanol on Rh/γ-Al2O3 (110) surface
We first identify adsorption site of Rh on γ-Al2O3 (110) surface.
Figure 1 shows calculated Rh adsorption energies distribution mapped to the top view of the surface and geometry of the slab model of Rh/γ-Al2O3 (110) surface. In left panel of Fig.1 the
adsorption energy is indicated by color green (small) to purple (large) via white.
Figure 1. Left panel: view (2 × 1) of the PES for Rh adsorbed on the clear γ-Al2O3(110) surface. Right panel: The most stable structure of Rh loading.
We examine 6 possible cases for adsorption of ethanol: (i) cleanγ-Al2O3(110), (ii) bridge, (iii) OH, (iv) C(α), (v) C(β) and
(vi) H. (ii) through (vi) are with Rh loading. Figure 2 shows the most probable and chemically interesting geometry of ethanol
18
adsorption. This adsorption can lead to ethanol dehydrogenation pathways. The others may promote dehydration of ethanol to ethylene.
Figure 2. The most the most probable and chemically interesting geometry of ethanol adsorption
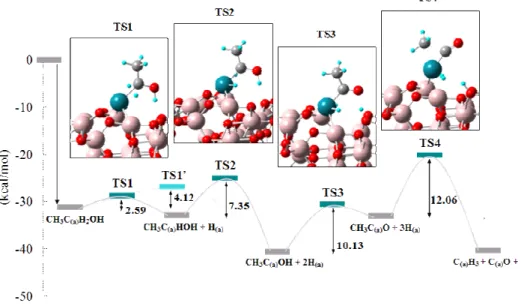
Figure 3. Reaction pathway for ethanol decomposition on Rh/γ-Al2O3(110)
surface
In this configuration, ethanol adsorbed onto a Rh via α-Carbon, two α-hydrogen atoms from ethanol are first eliminated; the barriers for abstraction of the two α-hydrogen atoms are 2.59 an 7.35 kcal/mol. The hydrogenation continues with the loss of one hydrogen from the O-H, forming an intermediate species CH3C(a)O+3H(a), for which the successive barrier is 10.13
19
kcal/mol. Cleavage of the C-C bond occurs at this stage with a dissociation barrier E = 12.06 kcal/mol, to form C(a)H3 + C(a)O
+ 3H(a).
Figure 3 shows a reaction pathway obtained from our calculations. There exist two pathways from CH3C(a)H2OH to
produce CH3C(a)OH+2H(a); one is concerted pathway via TS1’
directly going to the product and another is sequential pathway via intermediate species CH3C(a)HOH + H(a) via two transition
states TS1 and TS2. Our result can be summarized as follows: (i) CH3CH2OH Æ CH3C(a)O + 3H Æ (C-C cleavage) Æ CH3 +
CO + nH
(ii) CH3CHO Æ CH3C(a)O + H Æ (C-C cleavage) Æ CH3 + CO
+ nH
The results agree well with experimental results [9-11].
Transition states may differ because TS1’ and TS2 structure yield zero and two imaginary frequencies. Correct geometries for TS1’ and TS2 should be obtained in the near future. To this end, several transition state searching algorithms[8,12,13] are currently studied.
References:
1. J. P. Perdew, J. A. Chevary, S. H. Vosko, K.A. Jackson, M. R. Pederson, D. J. Singh and C. Fiolhais, Phys. Rev. B, 1992, 46, 6671.
2. J. A. White and D. M. Bird, Phys. Rev. B, 1994, 50, 4954. 3. G. Kresse, and J. Hafner, Phys. Rev. B, 1993, 47, 558.
20
5. G. Kresse and J. Hafner, Phys. Rev. B, 1996, 54, 169. 6. P. E. Blochl, Phys. Rev. B, 1994, 50, 17953
7. G. Kresse and D. Joubert, Phys. Rev. B, 1999, 59, 1758. 8. F. Jensen, Introduction to Computational Chemistry, 2nd. Ed.
Chap. 12, 2007 John Wiley & Sons Ltd. England.
9. M. Dömök, M. Tóth, J. Raskó and A. Erdo˝helyi, Appl. Catal. B, 2007, 69, 262.
10. H.-L. Chen, S.-H. Liu, J.-J. Ho, J. Phys. Chem. B, 2006, 110, 14816.
11. C. Hartnig, J. Grimminger, E. Spohr, Electrochim. Acta, 2007, 52, 2236.
12. http://theory.cm.utexas.edu/vtsttools/
13. A Heyden, A. T. Bell and F. J. Keil, J. Chem. Phys., 2005, 123, 224101.
(三) J. C. Jiang(江志強):
Bio-ethanol is an important renewable energy carrier mainly produced from biomass fermentation. Besides operating conditions, the use of catalysts plays a crucial role in hydrogen production through ethanol reforming. A wide range of catalysts was tested, changing both the active phase (Rh, Pt, Pd, Ru, Ni, Cu, Zn, Fe) and the oxide support (Al2O3, 12%CeO2–Al2O3; CeO2; CeO2–ZrO2;
ZrO2).[1] The reaction pathways and thermodynamics of ethanol
steam reforming have been studied extensively recently.[2–6] It can be seen that hydrogen production varies significantly with different reaction pathways. The selection of proper support for catalyst and the methods of catalyst preparation significantly affect
21
the activity of catalysts. Rh and Ni are so far the best and the most commonly used catalysts for ethanol steam reforming towards hydrogen production. Previous reports [7, 8] have been proven that Cu has the excellent performance for water gas shift reaction. As Rh and Ni are inactive for water gas shift reaction, the development of bimetallic catalysts, alloy catalysts, and double-bed reactors is promising to enhance hydrogen production and long-term catalyst stability. Based on economic point of view, the investigation of the reaction mechanism of ethanol steam reforming (ESR) over the Ni-Cu/α-Al2O3 surface is our endeavor
in the past year. We considered two stages of ESR reaction; first is the ethanol dehydrogenation over the Ni /α-Al2O3 surface, then the
WGS reaction on Cu/α-Al2O3 surface.
In this report, we divide into three parts: the first is “CO oxidation on Cu cluster”; the second is “WGS on Cu/α-Al2O3
surfaces”; and the final is “Ethanol dehydrogenation on α-Al2O3
surface”. The study of “The ethanol dehydrogenation on the Ni /α-Al2O3 surface” has not been completed.
Computational Method
All calculations were performed using spin polarized DFT within the generalized gradient approximation (GGA) as implemented in the Vienna ab initio simulation package. In our calculations, electron-ion interactions were described by ultrasoft pseudo-potentials and the PW91 exchange correlation functional was used. The Monkhorst-Pack scheme was used to generate k-points. The cutoff energy for the plane waves was 300 eV, and the Monkhorst-Pack set of four k points was used. Structural
22
minimizations were performed using a conjugated gradient technique in which the iterative relaxation of atomic positions was stopped when the change in the total energy between successive steps was less than 0.001 eV. For a chemical reaction of given reactants and products, the minimum energy path is found via the NEB method by performing a restrained minimization of a series of images on the 3N-dimension potential energy surface. The harmonic restraints between adjacent NEB images prevent the collapse of all of the NEB images to the given local minima (namely, the reactants or the products) and ensure that the paths found are indeed the minimum energy paths.
1. CO oxidation on Cu cluster
Cu growth on alumina surfaces has been experimentally studied using both native surfaces of α-alumina and thin films of aluminum oxide grown on metallic substrates. The results concerning Cu deposition have been found to be contradictory.[9-11] Their results provided direct evidence for the 3D clustering of copper on the reconstructed face above a coverage of 0.3 ML. Cu clusters form islands of 3-8 Å in height and 20-30 Å in diameter; these islands are randomly distributed on the surface. However, it was not possible to image copper at coverage lower than 0.3 ML; the possibility that small 2D islands of copper are formed prior to the 3D clusters could not be ruled out. Therefore, we considered the investigations both CO oxidation on Cu cluster and on the coverage at 1/3 - 4/3 ML of Cu on alumina. The latter case will be presented at the next part.
23
Figure 1. Potential energy surface for the decomposition of oxygen molecule on Cu cluster.
Figure 2. Potential energy surfaces for CO oxidation with oxygen atom at bridge and hollow sites.
As shown in Figure 1, we can find the decomposition of O2 on
Cu cluster is almost barrierless. The absorbed CO can be oxidized with the O(abs) atom. Figure 2 demonstrates the barrier of
CO oxidation with OB (1.17 eV) is much lower than that with OH
(2.68 eV).
2. WGS on Cu/α-Al2O3 surfaces
Aluminum oxide (Al2O3) is a particularly important substrate for -3.0 -1.5 0.0 1.5 3.0 R e la ti v e E n e rgy ( e V ) Reaction Coordination CO+OH CO+OB
24
catalysis purposes because of both its mechanical and thermal resistance. To date, the most studied phase of Al2O3 is the stable
α phase. This is presumably due to the stability and the less complex structure of this phase, as compared to the metastable aluminas. In this part, WGS reaction via redox, carboxyl and formate mechanisms has been studied on five different systems: bare α-Al2O3 (0001) surface; 1/6 ML Cu/α-Al2O3 surface; 4/3 ML
Cu/α-Al2O3 surface; Cu-3H2O /α-Al2O3 surface and
Cu/Hydroxylated α-Al2O3 surface. In addition, we also examined
the CO oxidation with O2 on Cu/α-Al2O3 at the coverage at 4/3
ML of Cu.
Our calculated results indicated that except Cu/α-Al2O3 catalyst,
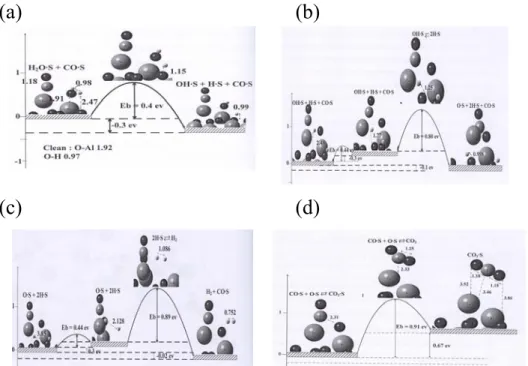
which carboxyl mechanism is the most favorable pathway with higher energy barrier (1.94 eV), redox mechanism is the most favorable of WGS on Cu/α-Al2O3 surfaces. As shown in Figure 3,
The barrier (0.89 eV) of H2 desorption is very close to the barrier
(0.91 eV) of the determined state - CO oxidation to CO2. As the
25
(a) (b)
(c) (d)
Figure 3. WGS reaction potential energy surfaces from NEB calculations (a) H2O(a) → OH(a) + H(a); (b) OH(a) → O(a) + H(a); (c) 2H(a) → H2(g) and (d)
CO(a) + O(a) → CO2(g) on Cu/α-Al2O3 (0001) surface at Cu coverage of 1/6
ML via redox mechanism.
3. Ethanol dehydrogenation on α-Al2O3 surface
The major aim of this study is to find the efficient and economic catalyst system for ethanol steam reforming (ESR). Initially, we planed to study the dehydrogenation of ethanol on Ni/α-Al2O3
surface and WGS reaction on Cu/α-Al2O3 surface to evidence the
Ni-Cu/α-Al2O3 catalyst system has to potential for ethanol steam
reforming and to understand the reaction mechanism of ethanol steam reforming on Ni-Cu/α-Al2O3 catalyst system.
The above result indicated the low coverage of the copper deposition on Al2O3 is a potential catalyst system for WGS
reaction. We were curious about does the ethanol steam reforming on the bare α-Al2O3 surface? The ethanol steam reforming on the
bare α-Al2O3 surface might be via dehydrogenation or dehydration
26
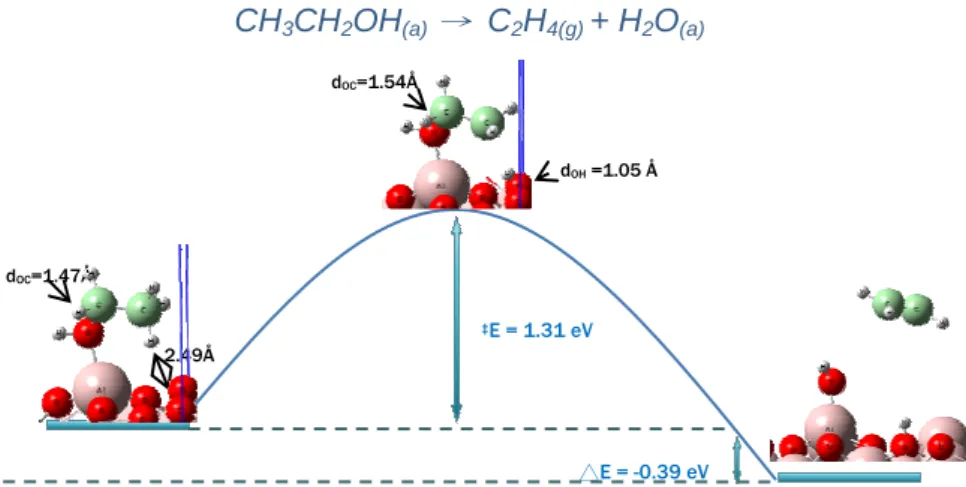
Our results indicated that the dehydrogenation via the O-H scission is reaction with the lowest barrier (0.81 eV), but the further reactions become unfavorable, since the barriers were close to 2 eV, whereas the dehydration is the favorable pathway (figure 4), which is in good agreement
Figure 4. Potential energy diagram from NEB calculation for ethanol dehydration to ethylene on clean ɗ-Al2O3 (0001) surface.
with the experimental observation.[12] Therefore, the bare α-Al2O3
surface is poor catalyst for ethanol steam reforming, it’ll cause the coke formation.
References:
1. Aupretre F, Descorme C, Duprez D., Catal. Commun., 2002, 3, 263.
2. Freni S, Maggio G, Cavallaro S., J Power Sources 1996, 62, 67. CH3CH2OH(a) → C2H4(g) + H2O(a) 2.49Å dOC=1.47Å ‡E = 1.31 eV △E = -0.39 eV dOH =1.05 Å dOC=1.54Å CH3CH2OH + 3H2O ↔ 2CO2 + 6H2 CH3CH2OH ↔ CH3CHO + H2 (2) CH3CHO ↔ CH4 + CO (3) CH4 + H2O ↔ CO + 3H2 (4) dehydration dehydrogenation CH3CH2OH ↔ C2H4 + H2O (5) C2H4 ↔ 2C + 2H2 (6) C2H4 + 2H2O ↔ 2CO + 4H2 (7)
27
3. Ioannides T., J Power Sources, 2001, 92, 17.
4. Benito M, Sanz JL, Isabel R, Padilla R, Arjona R, Daza L., J. Power Sources, 2005, 151, 11.
5. Vaidya PD, Rodrigues AE., Chem. Eng. J., 2006, 117, 39. 6. Fatsikostas AN, Verykios XE., J. Catal., 2004, 225, 439.
7. J. Nakamura, I. Nakamura, T. Uchijima, Y. Kanai, T. Watanabe, M. Saito and T. Fujitani, J. Catal., 1996, 160, 65
8. N. Schumacher, A. Boisena, S. Dahl, A.A. Gokhale, S. Kandoi, L.C.Grabow, J.A. Dumesic, M. Mavrikakis and I. Chorkendorff, J. Catal., 2005, 229, 265.
9. Y. Wu, E. Garfunkel and T. E. Madey, J. Vac. Sci. Technol. A, 1996, 14, 1662.
10. J. G. Chen, M. L. O. Colaianni, W. H. Weinberg and J. T. Yates, Surf. Sci., 1992, 279, 223.
11. F. S. Ohuchi, R. H. French, R. V. Kasowski, J. Appl. Phys., 1987, 62, 2286.
12. C. V. Ovesen, B. S. Clausen, B. S. Hammershoi, G Steffensen, T. Askgaard, I.Chorkendorff, J. T. Norskov, P. B. Rasmussen, P. Stoltze and P. Taylor, J. Catal, 1996, 158, 170.
二、Si-quantum dots:
(一) B. C. Wang(王伯昌):
In the simulations, both deposition and diffusion of adatoms on the substrate surface are considered as elementary processes. In this study, we investigated the diffusion length of adatoms and neglected the adsorptions from the surface. A 100x100 lattice was used as the basic substrate, which can be treated as one step, and
28
this substrate can be further divided into several steps with equal width, including 2 steps (50 atoms per step)、4 steps (25 atoms per step)、5 steps (20 atoms per step)、10 steps (10 atoms per step) and 20 steps (5 atoms per step). The deposition rate is set as 0.7 monolayer per second (ML/sec). The deposition time is one second and therefore the total deposition atoms are only 7000 atoms. Because the thickness in each step is only one monolayer, the SOS model [22-28] can be used as the simulated system without defect. This substrate system can simulate a simple cubic crystal with a regular facet [100]. Periodic boundary condition is applied along the x-axis and y-axis in the model, with the step-flow direction as y-axis.
The growth process is described by random deposition on the substrate with a constant rate. The transition rate for a diffusion process from lattice site i to j is assumed to be
⎟ ⎠ ⎞ ⎜ ⎝ ⎛ = E k T B ij A exp 0 ν ν (1)
The diffusion rate of adatoms is assumed as Arrhenius type, where
0
ν is the atomic vibration frequency which is assigned as
(
)
h T KB 2 0 = ν (2)where T is the substrate temperature andkB is Boltzmann constant.
The activation energy ij A
E is determined by a bond counting scheme with
ij A
E = ES + nEN + Estep (3)
where ES is the surface potential; n and EN are the number of the
nearest neighbors and the binding energy between any two nearest neighbors, respectively. Estep, so-called step-edge barrier, is the
29
anisotropic diffusion (iES barrier) for an atom hopping from the current step to the edges of the upper step. The typical semiconductor parameters [3] is set as ES = 1.0eV, EN = 0.25eV and
Estep = 0.15eV, respectively. By adjusting the step-edge barrier, we
can describe the asymmetric step-edge barrier suggested by Schwoebel et al [29-30].
The diffusion length (R) can be estimated by Einstein diffuse equation in homogeneous diffusion.
R2 = Dt (4)
where D is diffusion coefficient with the unit (length2/Sec) and t is the time elapse between two consecutive atomic deposition events. The diffusion coefficient can be calculated by D = A ⎟
⎠ ⎞ ⎜ ⎝ ⎛− kT EA exp 0 ν
where A= nx
.
ny.
a2, and nx and ny are the average diffusion distancealong x and y axes and a is the lattice constant.
In order to characterize the surface morphology of step-flow growth, two analytical methods are used to discuss the simulation results: step growth coverage (SGC) and step-flow analysis. The SGC can be expressed as
SGC = Nstep / Ntotal (5)
where, Ntotal is total numbers of deposition atoms and Nstep is the
number of atoms flowing across steps boundaries. Step-flow analysis includes two parameters, average step-flow layer (SFL) and step-flow ratio (SFR), to characterize the pattern formed by the adatoms on the step edges. SFL describes the average number of layers per step, formed through the step-flow growth. SFL and SFR are defined as
30
SFR = SFL / step width (7)
where Lx is the width of the subtract in x direction. By combining
the SFL with the width of step, SFR represents average step-flow covering, i.e., the expansion ratio for each step as shown in Eq. (7). Main discoveries
In order to investigate the variation in the diffusion length (R) of adatoms, which induces the change in surface morphology, we studied the temperature and step-width effects, and summarized these two effects with a phase diagram.
1. Temperature effect:
By comparing the diffusion length (R) with half of step width (L/2, L is step width), we can elucidate the relation between temperature effect and surface growth mode. We roughly divide temperature range into three regions including T1 region (300K~500K), T2 region (500K~750K) and T3 region (750K~1000K) according to the growth morphology. In the simulation scheme, the temperature parameter is implemented in the Arrhenius equation which is used to calculate the diffusion rate. When temperature raises, the average kinetic energy of adatoms increases; the diffusion rate and length of adatoms also increase and therefore the adatoms can diffuse to a more stable position with more neighboring adatoms. If temperature is high enough, the adatoms with large R can easily diffuse from the initial deposition position to the step-edge and enhance the step-flow. From the Arrhenius and Einstein diffusion equation
31
(Eq. 4), R is dependent only on temperature and therefore we can investigate the temperature effect on step-flow growth through the relationship between the SGC and R, since R depends only on temperature. The results are listed in Table 1. Since L/2 can be used to characterize the range of homogeneous diffusion, we can further explore the temperature effect through the relationship between R and L/2 with the results of SGC simulation.
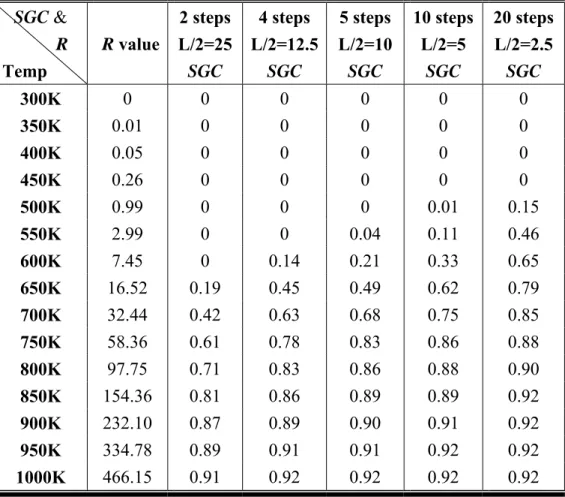
TABLE 1: Temperature dependence of the SGC and R values with various step- widths.
As listed in Table 1, it shows that the SGC values increase as temperature increases. When temperature belongs to T1 region (300K~500K), most of the adatoms stay at the original random deposition site due to lack of enough kinetic energy to diffuse and
SGC & R Temp R value 2 steps L/2=25 SGC 4 steps L/2=12.5 SGC 5 steps L/2=10 SGC 10 steps L/2=5 SGC 20 steps L/2=2.5 SGC 300K 0 0 0 0 0 0 350K 0.01 0 0 0 0 0 400K 0.05 0 0 0 0 0 450K 0.26 0 0 0 0 0 500K 0.99 0 0 0 0.01 0.15 550K 2.99 0 0 0.04 0.11 0.46 600K 7.45 0 0.14 0.21 0.33 0.65 650K 16.52 0.19 0.45 0.49 0.62 0.79 700K 32.44 0.42 0.63 0.68 0.75 0.85 750K 58.36 0.61 0.78 0.83 0.86 0.88 800K 97.75 0.71 0.83 0.86 0.88 0.90 850K 154.36 0.81 0.86 0.89 0.89 0.92 900K 232.10 0.87 0.89 0.90 0.91 0.92 950K 334.78 0.89 0.91 0.91 0.92 0.92 1000K 466.15 0.91 0.92 0.92 0.92 0.92
32
therefore the morphology belongs to random deposition growth. When temperature raises gradually to T2 region (500K~750K), the R of adatoms increases accordingly and homogeneous diffuse appears. The step-flow appears only when R is compatible to L/2 for systems with narrow step-width in T2 region. The step-flow morphology becomes apparent because that around 750K there are over 50% (SGC > 0.5) of adatoms diffusing to the step-edge. When L/2 decreases with temperature fixed the SGC increases. When temperature belongs to T3 region (750K~1000K), R is longer than the largest step-width in our models (50 atoms per step), and the SGC increases substantially over 50%. When temperature reaches 1000K, there are over 90% of adatoms contributing to step-flow growth and the surface morphology is composed entirely by step-flow growth.
The SGC values are almost close to zero when L/2 is larger than R value and the SGC values become substantial if L/2 is equal or smaller to R value. The increasing of the SGC value can be used to depict the onset of step-flow growth. Thus, the growth mode can be characterized according to relation between R and L/2, as shown in the following.
1 ≤
R : Morphology proceeds with random deposition mode;
1<R<L2 : Morphology proceeds with island mode; 2
L
R≥ : Morphology proceeds with step-flow mode.
When R≤1, most of the adatoms stay at the initial random
deposition site. When 1<R<L2, the adatoms tend to diffuse
33
pronounced. But whenR≥L2, the diffusion length can cover the
entire step-width, so the adatoms tend to attach to the step-edge and the step-flow growth become apparent. As a result, the step-flow growth becomes the dominant growth mode. The SGC results of these simulations are plotted in Fig. 4. In T1 region (below 500K), the value of SGC is close to zero and R of adatoms is smaller than L/2 due to low kinetic energy and only few adatoms near the step-edge. As shown in Table 1, diffusion lengths are smaller than 1 when temperature is below 500K. WithR≤1, the adatoms are unable to diffuse on the surface and
this makes the surface morphology mainly composed by random deposition growth. As temperature increases over 500K, the adatoms start to aggregate around the step-edge and the pattern of the step-flow growth emerges.
200 300 400 500 600 700 800 900 1000 1100 0.0 0.2 0.4 0.6 0.8 1.0
Step width -- Step Number
50 atoms -- 2 steps 25 atoms -- 4 steps 20 atoms -- 5 steps 10 atoms -- 10 steps 5 atoms -- 20 steps Step G row th C o ve rage (SG C ) Temperature (K)
Figure 4. Temperature effect of SGC for various step widths with an inverse ES barrier.
2. Step width effect:
34
and L/2 can determine the pattern of surface morphology. Since R is only dependent on temperature (Eq. 4), one can characterize the step-width of the substrate with a transition temperature (Tc)
for the onset of step-flow growth, i.e., when R is equal to the L/2, as shown in the previous section. The relation between the Tc and
L/2 for all simulation models are shown in Table 3. It is found that the model with narrow step-width corresponds to low Tc.
With narrow step-width, the adatoms can easily aggregate to the outer step-edge through homogeneous diffusion, and make the onset of step-flow growth appear even in low temperature. Therefore, Tc is low for the model with narrow step width (Tc=
537K, for step width: 5 atoms). However, with wide step-width, the aggregation through island growth on the terrace competes with the cluster formation around the step-edge and therefore temperature has to increase to allow the adatoms to diffuse far enough to be able to attach the outer step-edge. For example, Tc
is 676K for substrate with 50 atoms as step-width, and Tc is 572K
for substrate with 10 atoms as step-width.
As shown in Figure 5, the SGC decreases as the step width increases at almost all the temperature. It is interesting to note that the step-width effect is not pronounced in T1 and T3 regions. In T2 region, the step-flow growth is strongly influenced by step width. By combining the simulation results in Fig. 5 with Tc in
Table 2, it is found that when temperature is larger than Tc,
step-down mass current appears and the step-flow growth begin. In T2 region, the Tc increases as the step-width increases. When
35
evident and this indicates that the surface growth mode is not influenced by the step-width effect in these temperature regions. The influence of the step-width effect becomes noticeable on surface growth mode when temperature is in T2 region since the transition temperatures of all the studied models in T2 region. It is because that the surface growth pattern is determined by the competition between the island formation and step-flow growth in this temperature region and therefore it is rather sensitive to the variation of step-width. In order to demonstrate the extent of step-flow growth influenced by step-width effect, we compare the SFR with various step widths as shown in Table 2.
5 atoms 10 atoms 20 atoms 25 atoms 50 atoms
0.0 0.2 0.4 0.6 0.8 1.0 S tep G row th C o v e rage ( S G C ) Step Width 300K 400K 500K 600K 650K 700K 800K 900K 1000K
Figure 5. Step-width effect of step growth coverage (SGC) in various temperatures with an iES barrier.
36
TABLE 2. Temperature dependence of the step-flow layer (SFL) (layers) and step-flow ratio (SFR) (%) for various step widths.
3. Phase diagram discussion:
Combining the results of previous two sections, we constructed a phase diagram (see Fig. 6 for details) to explain the surface growth mode. We divided the phase diagram into three different regions according to SGC value: Region I (SGC: 0~0.125), Region II (SGC: 0.125~0.87) and Region III (SGC: 0.87~1). The surface growth mode in Region I belongs to random deposition growth. Judging from simulated morphology shown in Fig. 7 (300K), the deposition growth is the dominant mode in Region 1 and surface growth pattern shows minimal influence by either temperature or step-width effects. In Region III, the surface growth mode belongs to step-flow growth and is not influenced
2 steps 4 steps 5 steps 10 steps 20 steps SFL SF
R
SFL SFR SFL SFR SFL SFR SFL SFR
Layer (%) Layer (%) Layer (%) Layer (%) Layer (%)
300K 0 0 0 0 0 0 0 0 0 0 350K 0 0 0 0 0 0 0 0 0 0 400K 0 0 0 0 0 0 0 0 0 0 450K 0 0 0 0 0 0 0 0 0 0 500K 0 0 0 0 0 0 0.10 1 0.53 11 550K 0 0 0 0 0.56 3 0.80 8 1.61 32 600K 0 0 2.45 10 2.94 15 2.10 21 2.28 46 650K 6.65 13 7.79 31 7.00 35 4.34 43 2.77 55 700K 14.71 30 11.05 44 9.80 49 5.52 55 2.98 60 750K 21.35 50 13.65 55 11.62 58 6.02 60 3.08 62 800K 24.85 43 14.53 58 12.04 60 6.16 63 3.15 63 850K 28.00 56 15.05 60 12.46 62 6.32 63 3.22 64 900K 30.45 61 15.51 62 12.60 63 6.37 64 3.22 64 950K 31.85 62 15.93 64 12.74 64 6.44 64 3.22 64 1000K 31.85 64 16.12 64 12.88 64 6.44 64 3.22 64
37
by either temperature or step-width effects. As a result, we can conclude that the surface growth mode is not affected by step-width effect when temperature belongs to T1 and T3 regions.
Figure 6. Temperature-step width diagram for surface growth mode with SGC in color scale (2D diagram). The regions are separated by black dot lines. Region I belongs to random deposition growth and Region III is dominated by step-flow growth. The surface growth mode of region II represents the transition from random deposition growth to step-flow growth and is strongly influenced by the temperature and step width. The black dots below the black curve represent the Tc point.
300K 650K 1000K 2- step 4- step region region region region I region II region III
38 5- step 10- step 20- step
Figure 7. Top view of the simulated morphology with an iES barrier for various step-widths and temperatures.
Comparatively, the SGC varies at Region II as shown in Figure 6. The Region II represents the transition from random deposition growth to step-flow growth. The black curve in Region II represents the SGC = 0.5. The black dots below the black curve represent the Tc points. The results show that Tc increases as
step-width increases. The black curve of SGC rises slowly as step-width increases. Generally speaking, by increasing temperature or decreasing step-width, the surface morphology is dominated by step-edge aggregation and this in turns makes the step-flow growth apparent.
39
TABLE 3: Step-width effect on the transition temperature (Tc). steps Temp 2 steps L/2=25 4 steps L/2=12.5 5 steps L/2=10 10 steps L/2=5 20 steps L/2=2.5 Tc 676K 628K 614K 572K 537K Conclusion
We successfully analyzed the influence of temperature and step-width on the surface growth pattern of a semiconductor-like uniform-spacing stepped model with inverse Ehrlich-Schwoebel (iES) barrier. The relation between diffusion length (R) and half of step-width (L/2) is constructed to estimate the Tc in order to
predict the growth mode on the surface. A step width-temperature diagram was employed to characterize the surface growth mode into three regions, i.e., random deposition growth, step-flow growth and transition between these two growth modes, according to the step growth coverage and Tc. It is found that the step-width
effect has great influence on surface growth mode in the transition region. Our results not only shed a light on understanding the surface morphology controlled by the temperature and substrate topology, but also provide a simple way to predict the surface growth mode, which is crucial for the thin film growth process. References:
1. H. Minoda, Thin Solid Film, 2003, 424, 40.
2. A. V. Latyshev, A. L. Aseev, A. B. Krasilnikov, S. I. Stenin, Surf. Sci., 1989, 212, 157.
3. J. Mysliveček, C. Schelling, G. Springholz, F. Schäffler, B. Voigtländer, P. Smilauer, Materials Science and Engineering B, 2002, 89, 410.
40
4. J. Mysliveček, C. Schelling, F. Schäffler, G. Springholz, P. Smilauer, J. Krug, B. Voigtlander, Surf. Sci., 2002, 520, 193. 5. B. Voigtländer, T. Weber, P. Smilauer, D. E. Wolf, Phys. Rev.
Lett., 1997, 78, 2164.
6. W. K. Burton, N. Cabrera, F. C. Frank, Trans. R. Soc. A, 1951, 243, 299.
7. T. Maroutian, L, Douillard, H. Ernst, J. Phys. Rev. B, 2001, 64, 165401.
8. B. J. Gibbons, S. Schaepe, J. P. Pelz, Surf. Sci., 2006, 600, 2417.
9. H. Omi, T. Ogino, Thin Solid Films, 2000, 380, 15.
10. Z. M. Wang, L. Däweritz, K. H. Ploog, Surf. Sci., 2000, 459, L482-L486.
11. P. Tejedor, F. E. Allegretti, P. Smilauer, B. A. Joyce, Surf. Sci., 1998, 40, 82.
12. M. A. K. Zilani, H. Xu, X.-S. Wang, A. T. S. Wee, Appl. Phys. Lett., 2006, 88, 023121.
13. R. L. Schwoebel, E. J. Shipsey, J. Chem. Phys., 1966, 37, 3682.
14. G. S. Bales, A. Zangwill, Phys. Rev. B, 1990, 41, 5500.
15. D. Vilone, C. Castellano, P. Politi, Surf. Sci., 2005, 588, L227-L232.
16. J. M. Pomeroy, J. Jacobsen, C. C. Hill, B. H. Cooper, J. P. Sethna, Phys. Rev. B, 2002, 66, 235412.
17. M. Krishnamurthy, M. Wassermeier, D. R. M. Williams, P. M. Petroff, Appl. Phys. Lett., 1993, 62, 1922.
41 1999, 59, 2341.
19. F. Nita, A. Pimpinelli, Phys. Rev. Lett., 2005, 95, 106104. 20. T. Frisch, A. Verga, Phys. Rev. Lett., 2005, 94, 226102. 21. H. Omi, Y. Homma, Phy. Rev. Lett., 2005, 95, 216101.
22. J. D. Weeks, G. H. Gilmer, K. A. Jackson, J. Chem. Phys., 1976, 65, 712.
23. C. Olesky, Surf. Sci., 2004, 549, 246.
24. D. B. Abraham, V. Mustonen, A. J. Wood, J. Phys. A: Math. Gen., 2004, 37, L233.
25. H. J. W. Zandvliet, R. V. Moere, B. Poelsema, Phys. Rev. B, 2003, 68, 073404.
26. S. Dieluweit, H. Ibach, M. Giesen, T. L. Einstein, Phys. Rev. B, 2003, 67, 121410(R).
27. S. C. Park, J. M. Park, Phys. Rev. E, 2003, 67, 010103(R). 28. S. C. Park, J. M. Park, D. Kim, Phys. Rev. E, 2002, 65,
036108.
29. R. L. Schwoebel, E. J. Shipsey, J. Appl. Phys., 1969, 40, 614. 30. K. Kyuno, G. Ehrlich, Surf. Sci., 1997, 394, L179.
三、InN/TiO2 related calculations:
(一) M. C. Lin(H. T. Chen 陳欣聰):
Density Functional Study on the Electronic Properties of the InN/TiO2 Solar Cell Using the Linker Molecules –OY(O)O–, Y=B,
P:
In order to explain the robust inorganic linkers (such as –OY(O)O–, Y=B, P) for semiconductor quantum dot TiO2 solar
42
package to study the electronic structures and densities of states (DOS) of the modifiers InN/TiO2 using the linker molecules. The
calculations were performed using DFT and a plane-wave basis set with the ultra-soft Vanderbilt pseudopotentials (US-PP). The exchange-correlation functions were treated with the generalized gradient approximation (GGA) of the Perdew-Wang (PW91) functional. The Brillouin zone was sampled with the Monkhorst - Pack grid. The calculations were carried out using (4×4×1) Monkhorst-Pack mesh k-points. Also, we used a 600 eV cut-off energy, which allows convergence to 0.01 eV in the total energy.
The computed lattice parameters for the anatase (101) surface are a = 3.785 Å, c = 10.239, and the internal coordinate, c = 0.201, while those for the rutile (110) surface are a = 4.593 Å, c = 2.933, and c = 0.296. Those parameters are in good agreement with the experimental values as well as with other theoretical values. The calculated band gaps are 2.2 and 1.8 eV for the anatase and rutile surfaces, respectively, which are significantly smaller than the experimental values (3.2 eV for anatase and 3.0 eV for rutile) due to the DFT calculations. Therefore, the scissors operators of 1.0 and 1.2 eV for the anatase and rutile surface were applied to obtain results consistent with the experimental values, as well as for the following calculations.
First we calculated the structures and adsorption energies of –OY(O)O–, Y=B, P adsorbed on TiO2 anatase surface. Our
results show that the bonding energy of –OB(O)O– on TiO2 (56.9
kcal/mol) is stronger than that of –OP(O)O– on TiO2 (29.2
43
OY(O)O–TiO2, Y=B, P. It was found the binding energies of
(InN)x adsorbed on –OB(O)O–TiO2 are larger than those of (InN)x
on –OP(O)O–TiO2. The predicted energies are 69.2~79.9 kcal/mol
for –OB(O)O–TiO2, whereas they are 52.4~62.9 kcal/mol
for –OP(O)O–TiO2. In addition, we calculated the electronic
properties for those structural models.
As shown in Figure 1, the adsorbed –OY(O)O–, Y=B, P cause the reduction of the band gap from 3.2 eV to 2.7 eV for anatase surface to provide the possibility of photoexcitation at the 2.7 eV (459 nm) within the UV/Vis light region. The band gap lowering and red shift of the absorption edge are found to increase as the number of InN increases. The density of states (DOS) are shown in Figure 2. By analyzing the density of states (DOS), the presence of the –OB(O)O– density of state localizes slightly above the upper edge of the valence band, while the –OP(O)O– density of states localizes below the upper edge of the valence band as well as the overlap of the InN and the –OB(O)O– in the valence band is more significant than that of the InN and the –OP(O)O–.
Figure 1. Predicted band gaps of (InN)x-OY(O)O-TiO2 anatase
-1 0 1 2 3 1.0 1.5 2.0 2.5 3.0 3.5 B a nd Ga p (e V)
The number of (InN)x, x=0~3
OB(O)O OP(O)O
(InN)x-OY(O)O-anatase TiO2,
Y=B,P
(InN)x, x=0~3
Clear TiO2 anatase
44 -20 -15 -10 -5 0 5 0 10 DO S Energy (eV) total DOS TiO2 BO3 In 3N3 -20 -15 -10 -5 0 5 0 10 DOS Energy (eV) total DOS TiO2 PO3 In 3N3
Figure 2. Predicted densities of states of (InN)3 - OY(O)O - TiO2 anatase with
Y=B and P.
Besides, the Bader charge analyses show that more electron density is transferred from TiO2 to the –OB(O)O– linker, than to
the –OP(O)O– linker.
In conclusion, based on the above result, we can conclude that the –OB(O)O– is an efficient chemical bond to link InN and TiO2. More discussion on the –OP(O)O– linker is given below.
(二) J. S. Lin(林志興):
To establish better understanding of the significant different effect of different anchoring groups, i.e. H3PO3 vs H3BO3, on the
solar energy conversion of InN/TiO2 solar cell design1 we began to
investigate the different stable structural modes of InN-XO32-
( X=B and P) adsorbed on both TiO2 anatase (101) and TiO2 rutile
(110) surfaces and their corresponding electronic properties to rationalize the main reasons to cause the significant different effect of different anchoring groups on the photoexcitation within the UV/Vis region and the electron injection from the photoexcited electronic states to the unoccupied electronic states around the
45
lowest conduction bands of InN-XO32- ( X=B and P) adsorbed on
both TiO2 anatase (101) and TiO2 rutile (110)surfaces.
We first calculated the structural models of dissociated H3PO3,
i.e. H3PO3 Æ 2H++HPO32-, adsorbed on both TiO2 anatase (101)
and TiO2 rutile (110) surfaces. Our calculated results indicated that
the most stable structural mode of both 2H+ and HPO32- adsorbed
on TiO2 anatase (101) surface is through 1) the bonding between
surface 5-fold coordinated of Ti, i.e. Ticn5, and two oxygens within
adsorbed HPO32- 2) the bonding between the adsorbed 2H+ and
surface 2-fold coordinated O, i.e. Ocn2., and 3) the very weak
bonding between the third oxygen within adsorbed HPO32- and
adsorbed 2H+, that is -(Ocn2)2-(H)2-OHP(O)2-(Ticn2)2-. However,
we found that the most stable structural mode of dissociated H3PO3 adsorbed on TiO2 rutile (110) surface is through 1) the
bonding between surface Ticn5 and two oxygens within adsorbed
HPO32- and 2) the bonding between the adsorbed 2H+ and surface
Ocn2, that is, -(Ocn2)2(H)2POH(O)2-(Ticn2)2. These two structural
models are shown below, respectively.
46
We then move on to investigate the electronic properties of these two structural models in order to establish the energy diagram to qualitatively rationalize both photoexcitation and electron injection process for possible interfacial electron transfer between adsorbed HPO32- and TiO2 surfaces.2 To elaborate this in
detail, we calculate the PDOS for adsorbed HPO32- and that for
both surface and bulk layer for the TiO2 surfaces as shown in the
figure below.
As you will see from the Fig. on the left above the adsorbed HPO32- will cause the appearance of the new occupied electronic
states between the band gaps arisen from the clear TiO2 anatase
(101) surface. Apparently, the adsorbed HPO32- will cause the
reduction of the band gap from 3.2 eV to 2.48 eV to provide the possibility of photoexcitation at the 2.48 eV (~500 nm) within the UV/Vis adsorption region. However, if we compare our calculated PDOS of the TiO2 anatase (101) surface layer with those of
adsorbed HPO32- we immediately found that there are no suitable
energy matches between those lower unoccupied electronic states of adsorbed HPO32- and the unoccupied electronic states around
47
surface and bulk layers. As regard to the structural model of HPO32- adsorbed on TiO2 rutile (110) surface we again found the
appearance of the new occupied electronic states between the band gaps arisen from the clear TiO2 rutile (110) surface. Apparently,
the adsorbed HPO32- will cause the reduction of the band gap from
3.0 eV to 2.4 eV to provide the possibility of photoexcitation at the 2.40 eV (~516 nm) within the UV/Vis adsorption region. Additionally, there are no suitable energy matches between the lower unoccupied electronic states of adsorbed HPO32- and the
unoccupied electronic states around the lower conduction band edges of the TiO2 rutile (110) surface and bulk layers. In summary,
our both structural models of HPO32- adsorbed on both TiO2
anatase (101) and TiO2 rutile (110) surfaces will possibly provide
the sensible structural modes for being used to effectively convert light into the photoexcited states of adsorbed InN on both TiO2
anatase (101) and TiO2 rutile (110) surfaces but unlikely provide a
feasible interfacial electron pathway for electron injection through the HPO32-/TiO2 interface.
We then further calculated the different structural modes of InN adsorbed on both H3PO3 anchored TiO2 anatase (101) and
rutile (110) surfaces leading to InN-PO32- adsorbed onto both TiO2
anatase (101) and rutile (110) surfaces to see the effect of this anchoring group, i.e. H3PO3, on both photoexcitation and electron
injection processes involved for converting light into the electricity in the InN/TiO2 sensitized solar cell system. The
following structural modes of InN-PO32- adsorbed on TiO2 anatase
48
structural mode is the InN-PO32- side-on adsorption structure, i.e.
-O3P-NIn-OPO2-, through the bonding between In within InN and
O within PO32-.
Regarding to the structural modes of InN-PO32- adsorbed on
TiO2 rutile (110) surface the following structural modes as shown
below are investigated. The most stable structural mode is the end-on structure of adsorbed InN-PO32- on TiO2 rutile (110)
surface as shown on the left below.
Now we investigate the electronic properties of the most stable structural mode of InN-PO32- adsorbed on the TiO2 anatase
(101) surface, i.e. the side-on structure of InN-PO32- adsorbed on
the TiO2 anatase (101) surface, as shown below. From our
calculated PDOS of adsorbed InN-PO32- we can observe the
appearance of the new states due to the adsorption of InN-PO32-
within the bandgap originated from the clean TiO2 anatase (101)
49
eV to provide the possibility of photoexcitation at the 2.02eV (~613 nm) within the UV/Vis adsorption region. However, there are no corresponding unoccupied electronic states due to the adsorbed InN-PO32 around the conduction band edge. Therefore,
by comparing the PDOS of adsorbed InN-PO32 with that of TiO2
anatase (101) surface and bulk layers we found there are no suitable energies match to provide the feasible interfacial electron pathway for electron injection through the interface between InN-PO32- and TiO2 anatase (101) surface.
In addition, we compare the electronic properties of the most stable structural mode of InN adsorbed (side-on) on the TiO2 (101)
anatase surface with that of the most stable structural mode of InN-PO32- adsorbed (side-on) on the TiO2 anatase (101) surface as
shown above in order to understand the effect of the anchoring group, i.e. H3PO3, on the electronic states governing the variation
50
of the bandgap and the extent of overlap of the unoccupied electronic states around the band edges of the conduction bands between the adsorbate, i.e. adsorbed InN and adsorbed InN-PO32-,
and the TiO2 surfaces. We first found that both stable structural
modes of InN adsorbed (side-on) on TiO2 anatase (101) surface
and InN-PO32- adsorbed (side-on) on TiO2 anatase (101) surface
have very similar bandgaps: 2.04 eV vs 2.02 eV. It indicates that both structural modes provide very similar photoexcitation at the 2.40 eV (~516 nm) within the UV/Vis adsorption region. We also found that both structural modes of InN adsorbed (side-on) on TiO2 anatase (101) surface and InN-PO32- adsorbed (side-on) on
TiO2 anatase (101) surface have quite different distributions of
unoccupied electronic states around the conduction band edges. For the InN adsorbed (side-on) on TiO2 anatase (101) surface the
unoccupied electronic states around the conduction band edges have a very strong overlap among adsorbed InN, TiO2 anatase (101)
surface and TiO2 anatase (101) bulk. Consequently, as soon as the
photoexcitation proceeds, this photoexcited electron will be easily injected into the TiO2 anatase (101) surface. It was then further
leaded to the TiO2 anatase (101) bulk to effectively and rapidly
transfer the photoinduced electrons. But for the InN-PO3
2-adsorbed (side-on) on TiO2 anatase (101) surface there are
negligible overlap of the unoccupied electronic states around the conduction band edges among the adsorbed InN-PO32-, TiO2
anatase (101) surface and TiO2 anatase (101) bulk. Therefore, the
photoexcited electron will not be injected into the TiO2 anatase
51 Main discoveries and Conclusions
To elaborate the different electronic properties between InN adsorbed (side-on) on TiO2 anatase (101) surface and InN-PO3
2-adsorbed (side-on) on TiO2 anatase (101) surface we further
analyze the electronic density of InN adsorbed (side-on) on TiO2
anatase (101) surface and InN- PO32- adsorbed on TiO2 anatase
(101) surface. Based on our calculated electron density of the lower conduction bands of InN adsorbed (side-on) on TiO2 anatase
(101) surface as shown below we found that there is a strong overlap between the πcharacteristic from adsorbed InN and that from Ticn5. to give rise to the effective channel for electron
injection from adsorbed InN to TiO2 anatase (101) surface.
However, this kind of overlap between PO32- and Ticn5 doesn’t
occur to the InN-PO32- adsorbed (side-on) on TiO2 anatase (101)
surface. Rather than there is a strong overlap between the σ characteristic from adsorbed InN and that from PO32-.
Consequently, this system will not provide the feasible channel for electron injection through the InN-PO32- to TiO2 anatase (101)
surface. Therefore, the significant different bonding nature within the interface of both InN adsorbed (side-on) on TiO2 anatase (101)
surface and InN-PO32- adsorbed (side-on) on TiO2 anatase (101)
surface, i.e. πcharacteristic vs σ characteristic, is the main reason for causing the significant different solar energy conversion.