Development and Application of a Vibration Isolation System with
Adaptive Stiffness Considering Potential Energy
Chi-Jen Chen
a, Tzu-Kang Lin *
ba
Student Graduate, Department of Civil Engineering, National Chiao Tung University;
bAssistant
Professor Department, of Civil Engineering, National Chiao Tung University
ABSTRACT
In recent years, a study of a semi-active isolation system named the Leverage-type Stiffness Controllable Isolation System (LSCIS) was proposed. The main concept of the LSCIS is to adjust the stiffness in the isolator for the fundamental period of the superstructure by a simple leverage mechanism. Although great performance has been achieved with the support of the least input energy method (LIEM) in far-field earthquakes, some results still reveal that the proposed system is not suitable for application in near-fault strong ground motion. To overcome this problem, two algorithms that consider the potential energy effect in the semi-active structural control system are proposed in this study. The optimal weightings between the potential and kinetic energy are first determined through a series of near-fault earthquake simulations. The proposed algorithms are then developed with the combination of the potential energy (Ep) and the kinetic energy (Ep) as the control objective to reduce the structural displacement responses efficiently. In order to demonstrate the performance of the proposed algorithm, a two-degree-of-freedom structure is used as a benchmark in both numerical simulation and experimental verification. Numerical results have shown that the dynamic response of the structure can be effectively alleviated by the proposed algorithm under both far-field and near-fault earthquakes, while the structural responses by the LIEM may be worse than the pure passive control. The feasibility of implementing the proposed system has also been experimentally verified.
Keywords: Potential energy, Semi-active control, near-fault earthquake
1. INTRODUCTION
Major disastrous earthquakes often result in significant casualties. These events caused most of the large-scale buildings, school buildings, bridges, and other structures to collapse. In order to avoid loss of life and financial losses due to earthquakes, researches have been conducted to reduce the input energy to buildings and alleviating the structural displacement, velocity and acceleration responses induced.
The development of structural control systems has been ongoing for some time. Up to date, the control systems can be mainly categorized into passive control, active control, and semi-active control. Reliability of control effectiveness and merits such as low control energy can be reliably achieved by passive control. For example, an Added damping and stiffness (ADAS) device was developed by Tehranizadeh in 2001 [1]. This device consists of multiple X type medium carbon steel plates aligned to form connectors, installed between the top of braces and the lower edge of floor panels to effectively reduce energy. Some related studies on passive control [2-4] also showed that structural response can be alleviated by installing a damping system on the structure.
Active control in combination with a corresponding control algorithm often produces better results than passive control. For example, Tritchkov, Michealov, and Sarkani developed a sliding device with retractable control in 1999 [5]. This device is mainly placed in the bearing pad with connected transverse springs and controlled by moving the retractable device. Battista et al. proposed a dynamic fluid control device in 2008 [6]. The configuration involves placing multiple parallel connecting tubes on the top of the structure and a rotating device is installed below to adjust the direction of the device. By adjusting the tube to be in line with the direction of excitation, the response of the structure can be attenuated. Passive control has the advantage of low control energy. However, the control effectiveness in most application cases is not as good as active control. Although active control has better performance, more control energy is required. Recently, since semi-active control possesses the merits of both active and passive controls with better control effectiveness
*[email protected]; phone 886-03-571-2121-54919
Yang and Agrawal added a friction damping device in the vibration isolation layer in 2002 [7]. This device uses two metal plates to clamp the friction layer, and the two metal plates are electrified to generated positive force. A vibration isolation layer consisting of a friction pendulum system (FPS) and Magnetorheological (MR) damper was proposed Kim and Roschke in 2006 [8]. In combination with control laws based on genetic algorithms, the proposed system can effectively attenuate the displacement response. Lu et al. reported a semi-active vibration isolation system containing dampers with resettable stiffness (RVSD) in 2009 [9]. Results demonstrated the effectiveness of this system in displacement control. Moreover, Lin and Lu in 2010 developed a semi-active device based on friction control [10]. In this device, gears and brakes are installed in the vibration isolation layer, and frictional force is generated by the braking device to reduce responses. A semi-active damping system with tuned mass dampers (SA-TMD) was proposed by Chung et al. in 2013 [11]. The response of the base structure can be reduced by this system through phase control. Compared with traditional TMD control, the SA-TMD can reduce the system reaction in a more effective manner.
A semi-active piezoelectric ceramic transducer (PZT) with variable stiffness and laid a circuit on the PZT was proposed by Clark in 1999 [12]. Under normal electric circuits, the PZT has low stiffness but the stiffness of PZT can be noticeably increased by using parallel circuits. Clarke employed a heuristic control algorithm to design the circuits, thus modifying the stiffness. Erramouspe et al. proposed a configuration with variable stiffness in 2007 [13]. The system contains a frame with a column in the middle, the top of which is connected to the frame. When the sensor receives the signal of seismic activities and triggers the servo motor, the column in the middle will acquire stiffness due to deformation, thus generating a restoring force opposite to the direction of movement. A semi-active vibration isolation system with variable stiffness and damping control was developed by Lin, Matsuhisa, and Utsuno in 2008 [14]. The double-layer structure was composed of the top and bottom sections where the top section is a brace with a MR damper, and the base section contains a MR damper and a connecting rod linking to the top of the superstructure. Variation of the stiffness is achieved through damping stroke while FFT analysis is employed to control the two dampers, avoiding the occurrence of structure resonance. A vibration isolation layer using a magnetorheological elastomer (MRE) was made by Du et al. in 2011, and the stiffness of the material changes under different electric currents [15]. Experimental results reveal that a good control effect over acceleration can be achieved by the semi-active configuration. A semi-active vibration isolation mechanism named leverage-type stiffness controllable isolation system (LSCIS) was first proposed by Lu, Lin, and Yeh in 2010 [16]. The system instantaneously changes the stiffness of the isolation layer by moving the pivot point of the lever arm, thus achieving control of the structure. Lu et al. further derived a control algorithm for the semi-active vibration isolation system based on the least input energy method (LIEM) in 2012 [17].
Based on the previous research, satisfactory performance can be expected by utilizing the proposed stiffness-variable isolation system. Experimental study also shows that the displacement and acceleration can be effectively alleviated. However, as extreme displacement on the isolation layer is occasionally observed for near-fault earthquakes with pulse-like velocity excitation, the isolation system may malfunction or fail. As a result, a new control algorithm that considers the optimal energy weighting between the kinetic and potential energy is proposed. The remainder of this paper is organized as follows. The basic theory of the adopted LSCIS and the theoretical derivation of the proposed minimal energy weighting (MEW) method are first introduced in Section 2. Numerical simulation including the optimization of the MEW parameters and the performance evaluation by various types of earthquake is then described in Section 3. Experimental verification of the proposed system on a shaking table test is carried out in Section 4. Finally, a summary is given and conclusions are drawn.
2. THE LEVERAGE-TYPE STIFFNESS CONTROLLABLE ISOLATION SYSTEM
The mathematical model of the Leverage-type Stiffness Controllable Isolation System (LSCIS) adopted in this study is shown in Figure 1. As indicated, ms and mb are used to represent the mass of the superstructure and the isolation layer, respectively. cs and ks denote the corresponding damping coefficient and stiffness of the superstructure. x t is the g( ) ground acceleration, and x ts( ) and x tb( ) are the relative displacement of the superstructure and the isolation layer. The
4--1-0- XH\t/
Figure 1. The mathematical model of LSCIS.
The controllable time-variable stiffness k tr( ), which can be adjusted between 0.2kr0 and 1.5kr0, is further divided into
the uncontrollable part kr0 and the time-variable stiffness k tr( ) as
0
( )
( )
r r r
k t
k
Dk t
. (1)By using the Lagrange equations of motion, the LSCIS shown in Figure 1 can be derived numerically. The equation of motion can be rewritten by the state space method, which is commonly used in automatic control theory, as
d r g
(t) =
z(t) +
z(t)Δk (t) +
x (t)
z
A
BD
E
. (2)Where z(t) is the state vector; A is the system matrix; B is the support matrix;E is the excitation matrix; the details of each matrix are expressed as
1 1
M C
M K
A
I
0
. s b s bx (t)
x (t)
(t) =
x (t)
x (t)
z
.0
1 /
0
0
bm
B
.1
1
0
0
E
(3)The M, C, and K matrices, representing the mass, damping, and stiffness of the isolated structure, can be expressed as
0
0
s bm
m
M
. 0 s s s s rk
k
k
k
k
K
. s s s sc
c
c
c
C
.D
d
0
0
0 1
(4)and the discreet time response can be derived as
r
[k 1]
[k]
[k]Δk [k]
[k]
z
A z
dB D z
d dE
dx
g . (5) where 1 1(
- )
(
- )
t d d d d de
AA
B
A
A I B
E
A
A I E
. (6)The discrete space equation is expressed in equation (5), where Ad,Bd,and Edare the discrete form of
A
,B
, andE
.[k1]
z is the state space response in time step [k1]. As shown in equation (5), is determined by the structural response
[ ]k
z , x k , and g[ ] Δk [ ]r k . z[ ]k can be obtained from the previous time step [k1]; x k represents the ground g[ ] acceleration. The relationship between Δk (t)r and x (t) can be written as p
p r 2 r0 p
2Lx [k]
k [k]
k
(0.5L x [k])
. (7)As shown in Equation (7), a controllable itemk (t)r in the isolation layer can be generated by properly manipulating the leverage pointx (t)p of the LSCIS with leverage length L.
3. THE PROPOSED MINIMAL ENERGY WEIGHTING METHOD
Based on the previous study, the response of the whole structure can be effectively alleviated by the LIEM method under most earthquakes [16-17]. However, an extremely large displacement of the isolation layer may occur under some typical near-fault earthquakes. To solve this issue, a new control algorithm named the minimal energy weighting method (MEW) is proposed. Through the proposed MEW method, the combination between the potential energy and kinetic energy under earthquake excitation can be minimized by an optimal isolation stiffness.
In order to solve the optimal stiffness increment Δk [ ]r k , Equation (5) can be rewritten as
1
[k 1]
[k]
[k]
[k]
[k]
z
A z
dk
rB z
dE
dx
g . (8) where 1d
d dB
B D
. (9)The kinetic energy Ek
k 1
, the potential energy of the superstructure and theisolation layer Ep,sup
k 1
+Ep,iso
k 1
can be expressed as
2
k 1 r 2 r 31
E
k 1 =
a k
k k
a
k
k k
a k
2
. (10) where
T T T
1 1d 2 2 1da k
z
k
B
D MD B z
k
. (11)
T T T
2 1d 2 2 d d g 2 1d ga
k
z
k
B
D MD
A z
k
E
x k
+ DMD B z
k x k
. (12)
T T T
T
3 d d g 2 2 d d g1
a k
k
x
k
k
x
k
2
z
A
E
D MD
A z
E
. (13)
21
0
0
0
1 1
0 1
0
0
D
,
D
. (14)
2 2 p,sup p,iso s r r01
1
E
k 1
E
k 1
(k ) (str. _ disp.)
( K
K ) (iso. _ disp.)
2
2
.
2
1,sup 1,iso r 2,sup 2,iso r 3,sup 3,iso
1
b
k
b
k
k k
+ b
k
b
k
k k
b
k
b
k
2
(15)Where the matrix’s first raw is represented by the subscript T. The matrix’s last raw is represented by the subscript L.
2 1,iso 1dL
b
[k] = 0.5(
B
z
[k])
. (16)2,iso 1dL dL dL g
3,iso
b
[k] = constant
. (18)
2 2
1,sup 1dT 1dL 1dT 1dLb
[k] = 0.5Ks (
B
z
[k])
(
B
z
[k])
2
B
z
[k]
B
z
[k]
. (19)
2,sup 1dL r dL dL g d T dTb
[k] =
B
z
[k] K 2
A z
[k]
E
x [k]
A z
[k]
E z
[k]
.
1dT[k] K 2
r d T[k]
dTx [k]
g d L[k]
dL[k]
B
z
A z
E
A z
E z
. (20) 3,supb
[k] = constant
. (21)The proposed performance index for energy evaluation can be described as
2
k r p p,sup p p,isor
J k 1 = E
k 1 +
Δk k
QE
E
k 1
QE
E
k 1
2
. (22)Where R is the restriction parameter of the pivot point; QEp is the weighting for potential energy, and the term kr0+ k r
is simplified as kr0 in the potential terms.
In order to derive the optimal Δkr,opt
k for the minimal performance index J k 1
, Equation (22) is differentiated with parameter Δk kr
and set as zero.
1
r
2
rd J k 1
a k
R
k k
a
k
0
d
k k
. (23)The optimal stiffness increment Δkr,opt
k can be solved as
2 p 2,str p 2,iso
r 1 p 2,str p 2,isoa
QE
b
QE
b
k k
a
R
QE
b
QE
b
. (24)4. NUMERICAL EVALUATION OF CONTROL EFFICIENCY
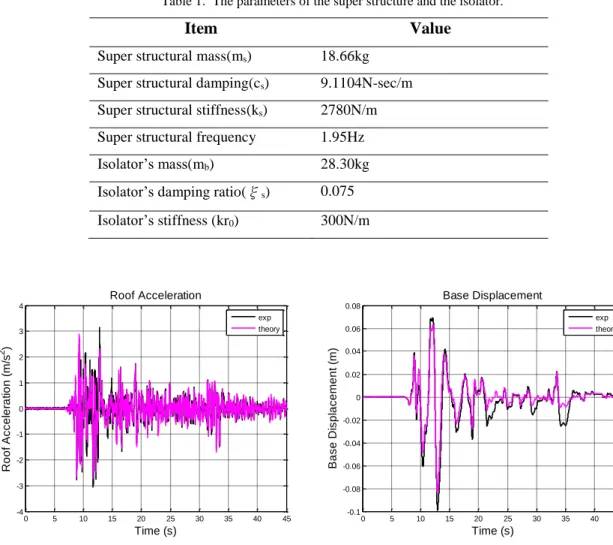
4.1 Model IdentificationThe specimens adopted in this study can be divided into two parts: the superstructure and the vibration isolation layer, which weigh 18.66kgs and 28.30kgs, respectively. To obtain the actual structural parameters, signals of 100gal white-noise was utilized as input excitation, and the identified parameters are presented in Table 1. As indicated, the stiffness of the isolation layer and the superstructure are 300N/m and 2780N/m, respectively as the isolation layer damping ratio is 0.075. The 1940 El Centro earthquake of PGA 300gal were adopted to verify the identified model by comparing the numerical results with experimental outcomes in Figure 2. Although the relative maximum value in some experimental responses exceeded the theoretical value, the identified parameters are consistent with the actual condition in general.
Table 1. The parameters of the super structure and the isolator.
Item
Value
Super structural mass(ms) 18.66kg
Super structural damping(cs) 9.1104N-sec/m
Super structural stiffness(ks) 2780N/m
Super structural frequency 1.95Hz Isolator’s mass(mb) 28.30kg
Isolator’s damping ratio(ξs) 0.075
Isolator’s stiffness (kr0) 300N/m
(a)The super strctural Accleration (b)The isolator Accleration Figure 2. The identification of numerical results and the experimental outcomes.
4.2 Weighting Optimization
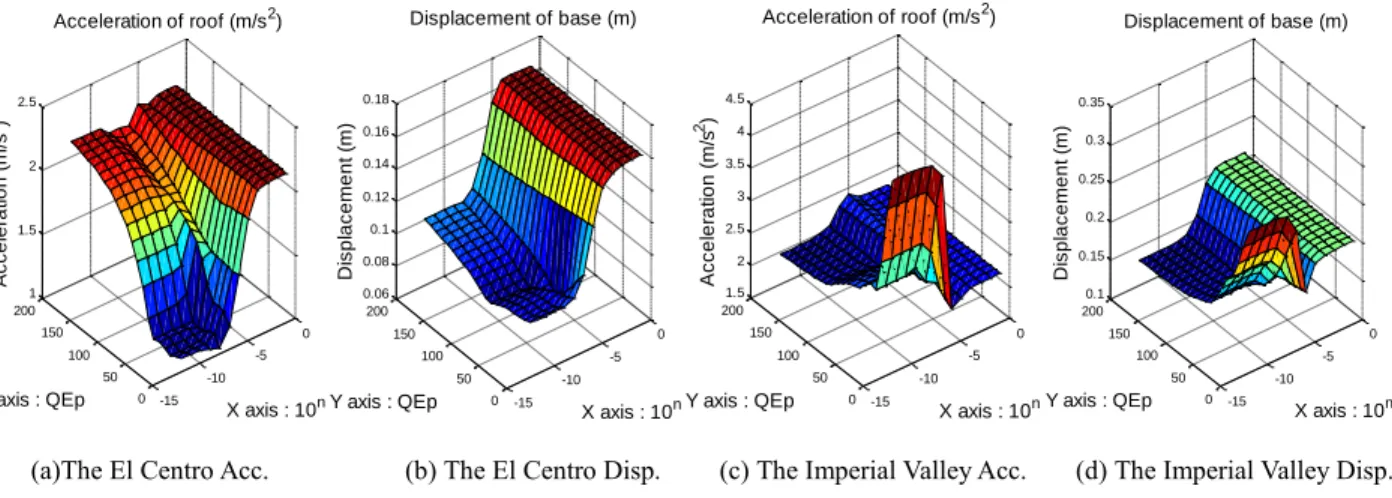
The optimal parameters R and QEp are then searched by utilizing the El Centro and Imperial Valley earthquake records as the ground input. The 3D and contour of the displacement and acceleration of the structure corresponding to the relative R
and QEp are simulated to determine the optimal combination where R is located between 10-12 and 100, and QEp is searched
between 0 and 200.
The simulated structural response under the El Centro earthquake of PGA 300gal is shown in Figure 3 (a)(b). The minimum displacement can be achieved by the setting of 10-8 (R) and 30 (QEp). The displacement is enlarged when R approaches
100. In the meantime, the acceleration response is enhanced dramatically with the increase of R and QEp.
0 5 10 15 20 25 30 35 40 45 -4 -3 -2 -1 0 1 2 3 4 Time (s) R o o f A c c e le ra ti o n ( m /s 2) Roof Acceleration exp theory 0 5 10 15 20 25 30 35 40 45 -0.1 -0.08 -0.06 -0.04 -0.02 0 0.02 0.04 0.06 0.08 Time (s) B a s e D is p la c e m e n t (m ) Base Displacement exp theory
(a)The El Centro Acc. (b) The El Centro Disp. (c) The Imperial Valley Acc. (d) The Imperial Valley Disp. Figure 3. The parameters comparison in 3D.
Figure 3(c-d) shows the numerical simulation under the Imperial Valley record of PGA 200gal. As indicated, the displacement is exaggerated when QEp approaches 0 while R is smaller than 10-7. The displacement response is
significantly lower than the LIEM control law (QEp=0、R=10-8 ) when R is chosen as 30. Moreover, the minimum displacement can be achieved with the combination of QEp=180 and R=10-8. Following the trend in the figure, more
acceleration can be expected with the decrease of QEp and R. The minimum acceleration of the superstructure can be reached with the setting of QEp=0 and R=10-6. As a similar result can be obtained by the combination of QEp=180 and
R=10-8, where the minimum displacement can also be achieved, the optimal parameters are chosen as QEp=180 and
R=10-8 .
Based on the simulation results, the optimal parameter of R is selected as 10-8 , and QEp can be determined in accordance
with different earthquake characteristics; QEp=180 is applicable to earthquakes with excessively large displacements caused by large velocity impulse. In the meantime, QEp=30 is a generally applicable parameter for all earthquakes as similar responses to those of LIEM can be achieved. Although the results obtained using QEp=30 are not better than those using a QEp of 180 under earthquakes with large velocity impulse, superior response can still be expected when compared to those using the LIEM control law.
4.3 Structural Response under Earthquakes
The numerical simulation of various control algorithms including the passive, LIEM, QEp=30, and QEp=180 under different earthquake excitations is compared. The pivot point of the LSCIS is fixed in the center for the passive control case, and the corresponding parameters of LIEM control are chosen as QEp=0 and R=10-8. The QEp is determined as 30
and 180, respectively for the proposed MEW method while parameter R is selected as 10-8. The 1940 El Centro, Imperial
Valley, and the TCU-068NS earthquake records are used as the excitation in the simulation.
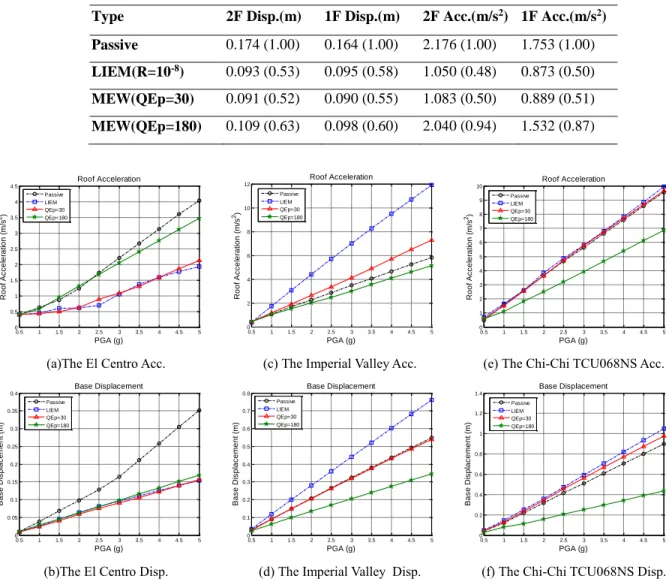
The acceleration of the superstructure under El Centro earthquakes of different PGA values is shown in Figure 4(a). The generic QEp=30 control algorithm performs the most efficiently for the far-field earthquakes. Similar response can be observed at PGA 250 gal, 450 gal, and 500 gal compared to the LIEM control algorithm while good control effectiveness is achieved at PGA 300gal and 400gal. Regarding the QEp=180 control algorithm, although larger response is found at PGA 150gal and 200 gal when compared to the passive control algorithm, however; the responses at 250 gal and 500 gal are smaller than those of the passive control algorithm. The displacement of the isolation layer under El Centro earthquake of different magnitudes is shown in Figure 4(b). The QEp=30 and QEp=180 control algorithms both exhibit better control effects under all PGA values when compared to the LIEM control algorithm. Details of the structural response are listed in Table 2. For example, the maximum accelerations of the superstructure under passive, LIEM, QEp=30, and QEp=180 control algorithms under the EL Centro earthquake of PGA 300gal are 2.176m/s2 (100%), 1.050m/s2 (48%), 1.038m/s2
(50%) and 2.040m/s2 (94%), respectively. The maximum displacements of the isolation layer under passive, LIEM,
QEp=30 and QEp=180 control algorithms are 0.164m (100%), 0.095m (58%), 0.090m (55%), and 0.098m (60%), respectively. -15 -10 -5 0 0 50 100 150 200 1 1.5 2 2.5 X axis : 10n Acceleration of roof (m/s2) Y axis : QEp A c c e le ra ti o n ( m /s 2) -15 -10 -5 0 0 50 100 150 200 0.06 0.08 0.1 0.12 0.14 0.16 0.18 X axis : 10n Displacement of base (m) Y axis : QEp D is p la c e m e n t (m ) -15 -10 -5 0 0 50 100 150 200 1.5 2 2.5 3 3.5 4 4.5 X axis : 10n Acceleration of roof (m/s2) Y axis : QEp A c c e le ra ti o n ( m /s 2) -15 -10 -5 0 0 50 100 150 200 0.1 0.15 0.2 0.25 0.3 0.35 X axis : 10n Displacement of base (m) Y axis : QEp D is p la c e m e n t (m )
Table 2. El Centro 300gal numerical results
Type 2F Disp.(m) 1F Disp.(m) 2F Acc.(m/s2) 1F Acc.(m/s2)
Passive 0.174 (1.00) 0.164 (1.00) 2.176 (1.00) 1.753 (1.00)
LIEM(R=10-8) 0.093 (0.53) 0.095 (0.58) 1.050 (0.48) 0.873 (0.50)
MEW(QEp=30) 0.091 (0.52) 0.090 (0.55) 1.083 (0.50) 0.889 (0.51)
MEW(QEp=180) 0.109 (0.63) 0.098 (0.60) 2.040 (0.94) 1.532 (0.87)
(a)The El Centro Acc. (c) The Imperial Valley Acc. (e) The Chi-Chi TCU068NS Acc.
(b)The El Centro Disp. (d) The Imperial Valley Disp. (f) The Chi-Chi TCU068NS Disp. Figure 4. The numerical maximums in the superstructure and isolator with different excitations.
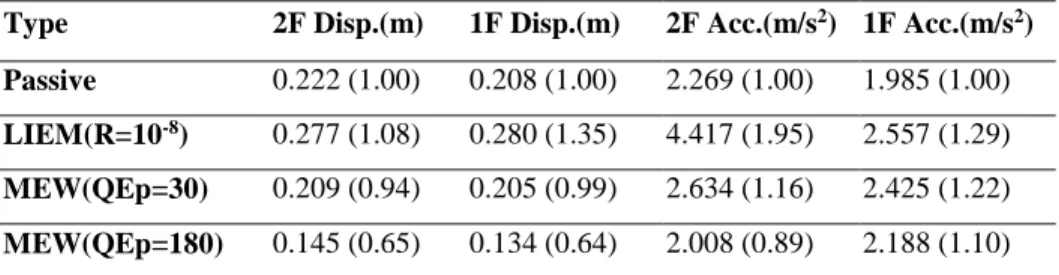
The acceleration of the superstructure under Imperial Valley earthquakes of different magnitudes is shown in Figure 4(c). The responses under the QEp=180 control algorithm are noticeably smaller at PGA above 200gal compared to those under the passive control algorithm. Although both the LIEM and QEp=30 control algorithms result in larger responses under all PGAs compared to the passive control algorithm, for earthquakes above 150gal, the extent of response enlargement for QEp=30 is noticeably smaller than for the LIEM control algorithm. The displacement of the isolation layer under Imperial Valley earthquakes of various magnitudes is shown in Figure 4(d). The QEp=180 control algorithm has the best control effectiveness for earthquakes above 200gal, significantly better than LIEM. For example, the maximum accelerations of the superstructure for passive, LIEM, QEp=30 and QEp=180 control algorithms under PGA 200 gal shown in Table 3 are 2.269m/s2 (100%), 4.417m/s2 (195%), 2.634m/s2 (116%) and 2.008 m/s2 (89%), respectively. The maximum displacements
of the isolation layer under passive, LIEM, QEp=30 and QEp=180 control algorithms are 0.208m(100%), 0.280m(135%), 0.205m(99%) and 0.134m(64%), respectively. 0.5 1 1.5 2 2.5 3 3.5 4 4.5 5 0 0.5 1 1.5 2 2.5 3 3.5 4 4.5 PGA (g) R o o f A c c e le ra ti o n ( m /s 2) Roof Acceleration Passive LIEM QEp=30 QEp=180 0.5 1 1.5 2 2.5 3 3.5 4 4.5 5 0 2 4 6 8 10 12 PGA (g) R o o f A c c e le ra ti o n ( m /s 2) Roof Acceleration Passive LIEM QEp=30 QEp=180 0.5 1 1.5 2 2.5 3 3.5 4 4.5 5 0 1 2 3 4 5 6 7 8 9 10 PGA (g) R o o f A c c e le ra ti o n ( m /s 2) Roof Acceleration Passive LIEM QEp=30 QEp=180 0.5 1 1.5 2 2.5 3 3.5 4 4.5 5 0 0.05 0.1 0.15 0.2 0.25 0.3 0.35 0.4 PGA (g) B a s e D is p la c e m e n t (m ) Base Displacement Passive LIEM QEp=30 QEp=180 0.5 1 1.5 2 2.5 3 3.5 4 4.5 5 0 0.1 0.2 0.3 0.4 0.5 0.6 0.7 0.8 PGA (g) B a s e D is p la c e m e n t (m ) Base Displacement Passive LIEM QEp=30 QEp=180 0.5 1 1.5 2 2.5 3 3.5 4 4.5 5 0 0.2 0.4 0.6 0.8 1 1.2 1.4 PGA (g) B a s e D is p la c e m e n t (m ) Base Displacement Passive LIEM QEp=30 QEp=180
Table 3. Imperial Valley200gal numerical results.
Type 2F Disp.(m) 1F Disp.(m) 2F Acc.(m/s2) 1F Acc.(m/s2)
Passive 0.222 (1.00) 0.208 (1.00) 2.269 (1.00) 1.985 (1.00)
LIEM(R=10-8) 0.277 (1.08) 0.280 (1.35) 4.417 (1.95) 2.557 (1.29)
MEW(QEp=30) 0.209 (0.94) 0.205 (0.99) 2.634 (1.16) 2.425 (1.22)
MEW(QEp=180) 0.145 (0.65) 0.134 (0.64) 2.008 (0.89) 2.188 (1.10)
As the main objective of the proposed algorithm is to control the displacement of the vibration isolation layer under near-fault earthquakes, the TCU-068NS earthquakes are adopted to verify the control algorithms. Figures 4(e) and (f) present the acceleration of the superstructure and displacement of the isolation layer under earthquakes of various PGAs. The QEp=180 control algorithm, which is specifically designed for near-fault earthquakes, yields the smallest response under different PGAs. For earthquakes above 200 gal, the QEp=180 control algorithm can significantly attenuate the displacement of the isolation layer. As shown in Table 4, the maximum accelerations of the superstructure under passive, LIEM, QEp=30 and QEp=180 control algorithms under TCU-068NS earthquakes of PGA 200 gal are 3.659 m/s2 (100%),
3.815 m/s2 (104%), 3.627 m/s2 (99%) and 2.512 m/s2 (69%), respectively. The maximum displacements of the isolation
layer under passive, LIEM, QEp=30 and QEp=180 control algorithms are 0.317m(100%), 0.359m(113%), 0.341m(107%) and 0.159m(50%), respectively.
Table 4. Chi-Chi TCU068NS 200gal numerical results.
Type 2F Disp.(m) 1F Disp.(m) 2F Acc.(m/s2) 1F Acc.(m/s2)
Passive 0.340 (1.00) 0.317 (1.00) 3.659 (1.00) 1.753 (1.00)
LIEM(R=10-8) 0.367 (1.08) 0.359 (1.13) 3.815 (1.04) 3.778 (1.24)
MEW(QEp=30) 0.346 (1.02) 0.341 (1.07) 3.627 (0.99) 3.482 (1.15)
MEW(QEp=180) 0.172 (0.51) 0.159 (0.50) 2.512 (0.69) 2.632 (0.87)
5. EXPERIMENTAL VERIFICATION
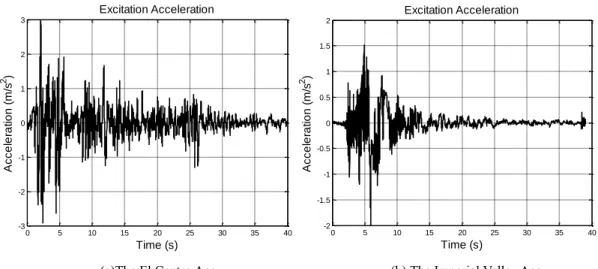
In order to verify the performance of the two proposed MEW algorithms, a series of experiments was carried out through shaking table tests. Due to the limitation of a maximum stroke of 12cm, some near-fault earthquakes of extreme ground displacement could not be reproduced. Thus, the El Centro and Imperial Valley earthquake records were used as the ground excitation in the experiments. As shown in Figure 5, the experimental hardware included the control system, the specimen, and the LSCIS mechanism. Sensors such as a linear variable differential transformer (LVDT) (±300mm and ±100mm), velocity meter (±100kine), and acceleration meter (±2G) were deployed to measure the structural response.
(a)The El Centro Acc. (b) The Imperial Valley Acc. Figure 5. The inputs for the experimental verification.
5.1 Comparison of control performance
In order to verify the performance of the proposed methods, experimental results under El Centro 300gal and Imperial Valley 200gal earthquakes using the aforementioned system parameters in combination with different control algorithms are compared. The results of the four control algorithms, namely passive, LIEM, QEp=30 and QEp=180, under El Centro PGA 300gal earthquakes are first compared in Table 5. The maximum displacements of the isolation layer under passive, LIEM, QEp=30and QEp=180control algorithms are 0.101m/s2 (100%), 0.071m/s (70.17%), 0.070m/s (69.27%), and
0.073m/s (72.75%), respectively. The experimental result indicates that the displacement responses of the isolation layer are well controlled under LIEM, QEp=30and QEp=180control algorithms, and the minimum displacement of the isolation layer can be achieved by the generic QEp=30 control algorithm. Although the displacement of the isolation layer under the near-fault type QEp=180 control algorithm is slightly larger than LIEM, the difference in terms of percentage is not significant. Moreover, the acceleration responses are presented in Table 5. The maximum accelerations of the superstructure under passive, LIEM, QEp=30 and QEp=180 control algorithms are 1.917m/s2 (100%), 1.295m/s2 (67.55%),
0.989m/s2 (51.61%), and 1.815m/s2 (94.68%), respectively. Among the four methods, the QEp=30 control algorithm has
the best control effect over the acceleration of the superstructure, with approximately 10% advantage than the LIEM. The control effect of the QEp=180 control algorithm is similar to that of passive control since the near-fault type QEp=180 is specifically designed for near-fault earthquakes.
Table 5. El Centro200gal experimental results.
Type 2F Disp.(m) 1F Disp.(m) 2F Acc.(m/s2) 1F Acc.(m/s2)
Passive 0.104 (1.00) 0.101 (1.00) 1.917 (1.00) 1.585 (1.00)
LIEM(R=10-8) 0.069 (0.66) 0.071 (0.70) 1.295 (0.68) 0.805 (0.51)
MEW(QEp=30) 0.069 (0.66) 0.070 (0.69) 0.989 (0.52) 1.000 (0.63)
MEW(QEp=180) 0.080 (0.77) 0.073 (0.73) 1.815 (0.95) 1.435 (0.91)
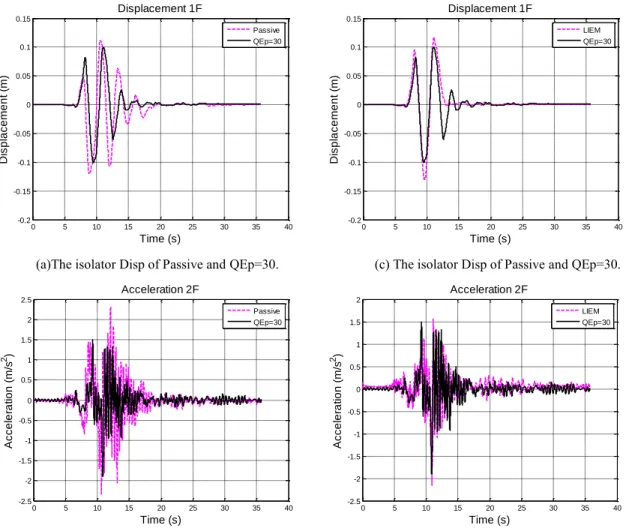
The displacements of the isolation layer for passive, LIEM, QEp=30 and QEp=180 control algorithms under the Imperial Valley 200 gal earthquake are compared in Table 6. The maximum displacements of the isolation layer under passive, LIEM, QEp=30 and QEp=180 control algorithms are 0.119m (100%), 0.131m (109.55%), 0.102m (85.34%), and 0.085m (71.36%), respectively. The displacement responses under QEp=30 and QEp=180 are presented in Figure 6(a) (b) and Figure 7(a) (b). The peak values under and are less than those under passive and LIEM control algorithms where the displacement response of the isolation layer is significantly enlarged. The exhibits the best control effect for near-fault earthquakes with a 39% improvement than the LIEM. Moreover, acceleration responses are as shown in Table 6. The
0 5 10 15 20 25 30 35 40 -3 -2 -1 0 1 2 3 Excitation Acceleration Time (s) A c c e le ra ti o n ( m /s 2) 0 5 10 15 20 25 30 35 40 -2 -1.5 -1 -0.5 0 0.5 1 1.5 2 Excitation Acceleration Time (s) A c c e le ra ti o n ( m /s 2)
2.332m/s2 (100%), 2.161m/s2 (92.68%), 1.899m/s2 (81.43%) and 1.771m/s2 (75.94%), respectively. The acceleration
response under QEp=30 is presented in Figure 6(c) and (d), and that under QEp=180 is presented in Figure 7(c) and (d). As indicated, the acceleration response for the peak ground excitation, which occurs at 10 seconds, under QEp=30 and QEp=180 control algorithms are both less than those under the passive and LIEM algorithms. Compared to the LIEM, the acceleration response under the generic QEp=30 control algorithm can be reduced at least 10% more. The QEp=180 algorithm, which is specifically designed for near-fault earthquakes, yields a maximum acceleration 17% lower than the LIEM.
(a)The isolator Disp of Passive and QEp=30. (c) The isolator Disp of Passive and QEp=30.
(b)The superstrctural Acc of Passive and QEp=30. (d) The superstrctural Acc of Passive and QEp=30. Figure 6. The QEp=30 experimantal results.
Table 6. Imperial Valley200gal experimental results.
Type 2F Disp.(m) 1F Disp.(m) 2F Acc.(m/s2) 1F Acc.(m/s2)
Passive 0.125 (1.00) 0.119 (1.00) 2.332 (1.00) 1.931 (1.00) LIEM(R=10-8) 0.134 (1.07) 0.131 (1.10) 2.161 (0.93) 1.592 (0.82) MEW(QEp=30) 0.108 (0.86) 0.102 (0.85) 1.899 (0.81) 1.111 (0.58) MEW(QEp=180) 0.097 (0.78) 0.085 (0.71) 1.771 (0.76) 1.751 (0.81) 0 5 10 15 20 25 30 35 40 -0.2 -0.15 -0.1 -0.05 0 0.05 0.1 0.15 Time (s) D is p la c e m e n t (m ) Displacement 1F Passive QEp=30 0 5 10 15 20 25 30 35 40 -0.2 -0.15 -0.1 -0.05 0 0.05 0.1 0.15 Time (s) D is p la c e m e n t (m ) Displacement 1F LIEM QEp=30 0 5 10 15 20 25 30 35 40 -2.5 -2 -1.5 -1 -0.5 0 0.5 1 1.5 2 2.5 Time (s) A c c e le ra ti o n ( m /s 2) Acceleration 2F Passive QEp=30 0 5 10 15 20 25 30 35 40 -2.5 -2 -1.5 -1 -0.5 0 0.5 1 1.5 2 Time (s) A c c e le ra ti o n ( m /s 2) Acceleration 2F LIEM QEp=30
(a)The isolator Disp of Passive and QEp=180. (c) The isolator Disp of Passive and QEp=180.
(b)The superstrctural Acc of Passive and QEp=180. (d) The superstrctural Acc of Passive and QEp=180. Figure 7. The QEp=180 experimantal results.
5.2 Comparison between experimental results and theoretical analysis
To verify the practical performance of the developed control system, the impulse-like Imperial Valley earthquake record of PGA 200 gal is adopted as the ground excitation, and the consistency between theoretical and experimental results under each control algorithm is examined.
The response under generic type QEp=30 is shown in Figure 8. The experimental displacement response is achieved well with the theoretical tendency. Due to the errors in system identification, the maximum theoretical value is slightly larger than the experimental result. Meanwhile, noticeable error can be observed in the experimental acceleration response of the superstructure. This error may be attributed to the accelerometer being interfered by the servo motor during the experiment. The response under near-fault type QEp=180 is presented in Figure 8. The main trends from the experiment and the theoretical analysis are consistent, and the experimental displacement and acceleration responses match well with the theoretical values. For the two peaks of displacement at 11 seconds and 13 seconds, the experimental results for both the superstructure and isolation layer can be accurately predicted by the theoretical models.
0 5 10 15 20 25 30 35 40 -0.2 -0.15 -0.1 -0.05 0 0.05 0.1 0.15 Time (s) D is p la c e m e n t (m ) Displacement 1F Passive QEp=180 0 5 10 15 20 25 30 35 40 -0.2 -0.15 -0.1 -0.05 0 0.05 0.1 0.15 Time (s) D is p la c e m e n t (m ) Displacement 1F LIEM QEp=180 0 5 10 15 20 25 30 35 40 -2.5 -2 -1.5 -1 -0.5 0 0.5 1 1.5 2 2.5 Time (s) A c c e le ra ti o n ( m /s 2) Acceleration 2F Passive QEp=180 0 5 10 15 20 25 30 35 40 -2.5 -2 -1.5 -1 -0.5 0 0.5 1 1.5 2 Time (s) A c c e le ra ti o n ( m /s 2 ) Acceleration 2F LIEM QEp=180
(a)The isolator Disp of QEp=30. (c) The isolator Disp of QEp=180.
(b)The superstrctural Acc of QEp=30. (d) The superstrctural Acc of QEp=180. Figure 8. Comparison between experimental results and theoretical analysis.
6. SUMMARY AND CONCLUSION
In order to solve the enlarged displacement of the isolation layer caused by near-fault earthquakes, adaptive stiffness control algorithms that consider both the potential and kinetic energy of the structure are studied. Based on the optimal weightings between the kinetic energy and potential energy, two MEW control algorithms including the generic type QEp=30 and the near-fault type QEp=180 were proposed. Through the proposed control algorithms, a more comprehensive consideration of the energy aspect can be achieved.
Theoretical simulation indicates that the generic control algorithm QEp=30 has similar effect as the original LIEM method under far-field earthquakes. The acceleration of superstructure and displacement of the isolation layer can be effectively attenuated. Although slight enlargement on displacement and acceleration is observed; however, the responses can still be suppressed more than that of the LIEM control. For the QEp=180 control algorithm, which is proposed specifically for near-fault earthquakes, theoretical analysis shows that the QEp=180 control algorithm can effectively reduce the acceleration of the superstructure with even better performance in controlling the displacement response of the isolation layer. Moreover, a better control effect than the passive control algorithm can also be expected for far-field earthquakes Experimental verification of the proposed MEW algorithms are then carried out. Both the QEp=30 and QEp=180 control algorithms produce good results under the impulse-like earthquake, and all responses are better than those under the passive control algorithm. The displacement and acceleration responses under these two algorithms are also alleviated effectively
0 5 10 15 20 25 30 35 40 45 -0.2 -0.15 -0.1 -0.05 0 0.05 0.1 0.15 Displacement 1F Time (s) D is p la c e m e n t (m ) Theory Experiment 0 5 10 15 20 25 30 35 40 45 50 -0.1 -0.08 -0.06 -0.04 -0.02 0 0.02 0.04 0.06 0.08 0.1 Displacement 1F Time (s) D is p la c e m e n t (m ) Theory Experiment 0 5 10 15 20 25 30 35 40 45 -2 -1.5 -1 -0.5 0 0.5 1 1.5 Acceleration 2F Time (s) A c c e le ra ti o n ( m /s 2) Theory Experiment 0 10 20 30 40 50 60 70 -2 -1.5 -1 -0.5 0 0.5 1 1.5 2 Acceleration 2F Time (s) A c c e le ra ti o n ( m /s 2 ) Theory Experiment
than the LIEM, which particularly shows enlargement on the displacement. The displacement of the isolation layer can be reduced to 85.32% and 71.33% for the QEp=30 and QEp=180 algorithms, respectively.
For the excessively large displacement of the isolation layer associated with conventional vibration isolation systems under near-fault earthquakes, two control algorithms are developed in this study. Experimental verification has shown that the proposed control algorithms can effectively attenuate the displacement of the isolation layer and the acceleration response. It is expected that the proposed system can be implemented practically in the near future.
REFERENCES
[1] M. Tehranizadeh“Passive energy dissipation device for typical steel frame building in Iran.” Engineering Structures Volume 23, Issue 6, June 2001, Pages 643–655(2001)
[2] Y. Tamura, K. Fujii, T. Ohtsuki, T. Wakahara, R. Kohsaka “Effectiveness of tuned liquid dampers under wind excitation .” Engineering Structures Volume 17, Issue 9, November 1995, Pages 609–621(1995)
[3] P. Martinelli, M. G. Mulas “An innovative passive control technique for industrial precast frames.” Engineering Structures Volume 32, Issue 4, April 2010, Pages 1123–1132(2010)
[4] O. E. Ozbulut, S. Hurlebaus “Evaluation of the performance of a sliding-type base isolation system with a NiTi shape memory alloy device considering temperature effects.” Engineering Structures Volume 32, Issue 1, January 2010, Pages 298-249(2010)
[5] V. Tritchkov, G. Michaelov, S. Sarkani “Vibration control of structures using adjustable slippage elements.” Engineering Structures Volume 22, Issue 12, December 2000, Pages 1620–1631(2000)
[6] R. C. Battista, E. M. L. Carvalhob, R. de Almeida Souza“Hybrid fluid-dynamic control devices to attenuate slender structures oscillations.” Engineering Structures Volume 30, Issue 12, December 2008, Pages 3513– 3522(2008)
[7] J. N. Yang, A. K. Agrawal “Semi-active hybrid control systems for nonlinear buildings against near-field earthquakes.” Engineering Structures Volume 24, Issue 3, March 2002, Pages 271–280(2002)
[8] H. S. Kim, P. N. Roschke “Design of fuzzy logic controller for smart base isolation system using genetic algorithm.” Engineering Structures Volume 28, Issue 1, January 2006, Pages 84–96(2006)
[9] L. Y. Lu, G. L. Lin,“Improvement of near-fault seismic isolation using a resettable variable stiffness damper.” Engineering Structures Volume 31, Issue 9, September 2009, Pages 2097–2114(2009)
[10] C. C. Lin, L. Y. Lu, G. L. Lin, T. W Yang “Vibration control of seismic structures using semi-active friction multiple tuned mass dampers.” Engineering Structures Volume 32, Issue 10, October 2010, Pages 3404– 3417(2010)
[11] L. L. Chung, Y. A. Lai, C. S. Walter Yang, K. H. Lien, L. Y. Wu“Semi-active tuned mass dampers with phase control.” Journal of Sound and Vibration Volume 332, Issue 15, 22 July 2013, Pages 3610–3625(2013) [12] W. W. Clark,“Semi-active vibration control with piezoelectric materials as variable-stiffness actuators”SPIE
Vol.3672 , March 1999, Passive Piezoceramic Treatments(1999)
[13] J. Erramouspe, P. D. Kiousis, R. Christenson, T. Vincent“A resetting stiffness dynamic controller and its bench-scale implementation.” Engineering Structures Volume 29, Issue 10, October 2007, Pages 2602–2610(2007) [14] Y. Liu, H. Matsuhisa, H. Utsuno,“Semi-active vibration isolation system with variable stiffness and damping
control.” Journal of Sound and Vibration Volume 313, Issues 1–2, 3 June 2008, Pages 16–28(2008) [15] H. Du, W. Li, N. Zhang “Semi-active variable stiffness vibration control of vehicle seat suspension using an
MR elastomer isolator”IOP SCIENCE Smart Materials and Structures Volume 20 Number 10,October 2011,No.105003(2011)
[16] L. Y. Lu, T. K. Lin, S. W. Yeh, “Experiment and analysis of a leverage-type stiffness controllable isolation system for seismic engineering” Earthquake Engineering and Structural Dynamics, Volume 39, Issue 15, pages 1711-1736 (2010).
[17] L. Y. Lu, S. Y. Chu, S. W. Yeh, L. L. Chung,“Seismic test of least-input-energy control with ground velocity feedback for variable-stiffness isolation systems.” Journal of Sound and Vibration Volume 331, Issue 4, 13 February 2012, Pages 767–784(2012).