行政院國家科學委員會專題研究計畫 成果報告
震動夯實造成之土壤應力及密度變化
研究成果報告(精簡版)
計 畫 類 別 : 個別型 計 畫 編 號 : NSC 97-2221-E-009-124- 執 行 期 間 : 97 年 08 月 01 日至 98 年 10 月 31 日 執 行 單 位 : 國立交通大學土木工程學系(所) 計 畫 主 持 人 : 方永壽 報 告 附 件 : 出席國際會議研究心得報告及發表論文 處 理 方 式 : 本計畫可公開查詢中 華 民 國 98 年 12 月 29 日
行政院國家科學委員會補助專題研究計畫
■ 成 果 報 告
□期中進度報告
震動夯實造成之土壤應力及密度變化
計畫類別:■ 個別型計畫 □ 整合型計畫
計畫編號:NSC 97-2221-E-009-124-
執行期間:97 年 08 月 01 日至 98 年 10 月 31 日
計畫主持人: 方永壽 教授
計畫參與人員: 許仕達 碩士班研究生
成果報告類型(依經費核定清單規定繳交):□精簡報告 ■完整報告
本成果報告包括以下應繳交之附件:
□赴國外出差或研習心得報告一份
□赴大陸地區出差或研習心得報告一份
■出席國際學術會議心得報告及發表之論文各一份
□國際合作研究計畫國外研究報告書一份
處理方式:除產學合作研究計畫、提升產業技術及人才培育研究計畫、
列管計畫及下列情形者外,得立即公開查詢
□涉及專利或其他智慧財產權,□一年□二年後可公開查詢
執行單位: 國立交通大學土木工程學系
震動夯實造成之土壤應力及密度變化
摘要
本研究以實驗方法探討點震動夯實造成疏鬆乾砂回填土之地表沉陷、密度變化及土壓力變 化。本研究以氣乾渥太華砂作為回填土,回填土高1.5 公尺。量測於鬆砂相對密度(Dr = 34%) 表面進行單點振動夯實造成之砂土密度及土壓力變化。本研究利用國立交通大學模型擋土 牆設備來探討經過7 秒、20 秒、46 秒、及 123 秒的地表振動夯實對地表沉陷、砂土密度及 土壓力造成的變化。依據實驗結果,本研究獲得以下幾項結論。(1) 在鬆砂的回填土中,土 壤內部的垂直與水平土壓力可以分別用σv = γz 與 Jaky 公式估算。(2) 在無凝聚性土壤表面 受夯實的受力情況可模擬成方形鋼樁承受振動式打樁機的貫入模式。在夯實過程中,土層 發生地表沉陷,直到樁底的極限承載力qp與振動夯實應力σcyc達到平衡。(3) 隨著夯實時間 的增加,相對密度等高線(Dr = 36%)會往深處發展,並且土壤內部之最大相對密度 Dr,max, 也會隨著夯實時間的增加而增大。(4) 隨著夯實時間的增加,土體殘餘的最大垂直與最大水 平應力變化(夯實後測得的應力減去初始未夯實測得之應力)也跟著增加。這是因為隨著 夯實時間增加,夯實能量也持續傳遞至土壤內部。(5) 夯實後移走夯實機,土壤內部可測得 夯實造成之殘餘應力。最大的垂直應力Δσv 位置,隨著夯實時間的增加,此位置會從深度 250 mm 稍微向下移動至 350 mm 的位置。 關鍵字:夯實、土壤壓力、模型測試、沉陷、砂、相對密度Variation of Earth Pressure and Soil Density due to Vibratory
Compaction
Abstract
This report studied the change of surface settlement, soil density, and earth pressures due to vibratory compaction at a point. Dry Ottawa sand was used as the backfill material. The height of backfill was 1.5 m. The variation of soil density and earth pressure due to the vibratory compaction on the surface of the loose sand (Dr = 34 %) was measured. The instrumented model retaining-wall at National Chiao Tung University was used to investigate the variation of the soil density and earth pressures after 7, 20, 46 and 123 seconds of vibratory compaction. Based on the test results, the following conclusions were drawn. (1) For a loose backfill, the vertical and horizontal earth pressures in the soil mass can be properly estimated with the equation σv = γz and Jaky’s equation, respectively. (2) The compaction of a cohesionless soil with a vibratory compactor can be simulated with the penetration of a square steel pile driven with a vibratory pile hammer. In the compaction process, the soils under the compacting plate settled until the ultimate tip resistance qp and the cyclic compacting stress σcyc reached an equilibrium. (3) The depth of the relative density contour (Dr = 36 %) increased with increasing time of compaction. The peak relative density in the soil also increased with increasing time of compaction. (4) It was obvious that the peak Δσv (3.60, 3.99, 4.44, 4.96, kN/m2) and Δσh (1.93, 2.41, 3.16, 3.32 kN/m2) increased with increasing compaction time. This is because, with increasing compaction time, more compaction energy was transmitted to the soil. (5) After the removal of the compactor, residual stresses in the soil mass were measured due to the vibratory compaction. The point of peak Δσv, as the compaction time increased, moved downward slightly from the depth of 250 mm to the depth of 350 mm.
Table of Contents
Abstract (in Chinese)………..I Abstract………..II Table of Contents……….III 1. Introduction... 1 1.1 Objectives of Study………. 1 2. Literature Review………... 3 3. Experimental Apparatus………...………... 8 3.1 Soil Bin………... 8
3.2 Soil Pressure Transducers (SPTs)………. 8
3.3 Data Acquisition System……….……….. 8
3.4 Vibratory Soil Compactor………..………... 9
4. Backfill and Interface Characteristics………..………..………….. 12
4.1 Backfill Properties……….. 12
4.2 Reduction of Wall Friction……….. 12
5. Variation of Soil Density due to Compaction……….…….. 14
5.1 Soil Density and Stress Measurements………. 14
5.2 Pilot Tests……….. 14
5.3 Density Change due to Compaction………. 15
6. Variation of Earth Pressure due to Compaction………..……….…………... 23
6.1 Testing Procedure……….. 23
6.2 Change of Vertical Earth Pressure due to Compaction………. 23
6.3 Change of Horizontal Earth Pressure due to Compaction……… 24
6.4 Mechanism of Soils under Compaction………...…………. 24
7. Conclusions………...………... 34
8. References………...………...……….. 34
9. 計劃成果自評可供推廣之研發成果資料表……….. 36 10. 出席國際學術會議心得報告及發表論文
1. INTRODUCTION
In this study, the effects of the vibratory compaction on the surface of a cohesionless soil mass are investigated. To achieve a dense backfill in the field, the vibratory compactor is commonly used to densify the backfill. With a horizontal ground level, the geostatic vertical stress σv before compaction can be estimated from its effective overburden pressure σv = γz. The horizontal earth pressure σh before compaction can be estimated from the Jaky’s (1944) equation σh = Koγz. However, after the vibratory compaction, how to estimate the change of soil density due to compaction? How to determine the variation of earth pressure in the backfill due to compaction? In this study, experiments were conducted with the NCTU model retaining wall facilities to investigate the change of soil density and earth pressures due to vibratory compaction at a point.
1.1 Objective of Study
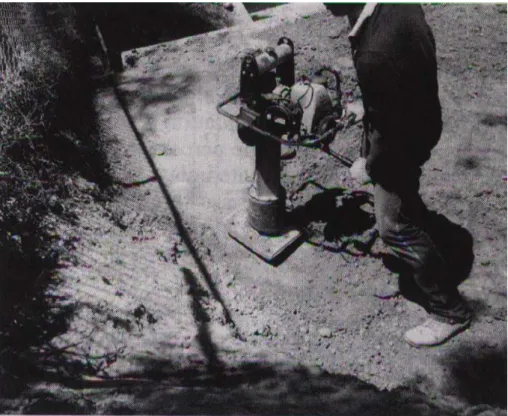
In most specifications for earthworks, the contractor is required that the backfill be compacted to 90-95 % of its maximum dry unit weight (γd,max) determined by the Standard Proctor test. Compaction is considered as an artificial densification of an earth mass. It is a particular kind of soil stabilization and one of the oldest methods for improving existing soil or man-placed fills. The objective of the compaction operation is to improve the engineering properties of soil, such as increasing the fill’s bearing capacity or reducing settlement. For granular soils, achieving a relative density of 70-75 % is generally recommended (see the NAVFAC Design Manual) (US Navy, 1982) by vibratory compaction. Therefore, in most cases, the backfill encountered in the field would be dense soil. As indicated in Fig. 1, hand tampers or vibratory compaction equipment are commonly used to densify the backfill.
To analyze the residual lateral earth pressure induced by soil compaction, several methods of analysis have been proposed by Rowe (1954), Broms (1971), Duncan and Seed (1986), Peck and Mesri (1987) and other researchers. Duncan et al. (1991) used the analytical procedures proposed by Duncan and Seed (1986) to develop earth pressure charts and tables that can be used to estimate residual earth pressure due to compaction. However, little information regarding the mechanism of soils under compaction has been reported. This study presents experimental data to investigate the surface settlement, change of soil density, and earth pressures in the soil mass induced by the vibratory compaction. The mechanism of soils under vibratory compaction is proposed. The National Chiao Tung University (NCTU) retaining wall facility was modified to investigate the soil density and earth pressure changes after compaction. The vertical and horizontal stresses in the soil mass were measured with the soil pressure transducers (SPTs)
2. LITERATURE
REVIEW
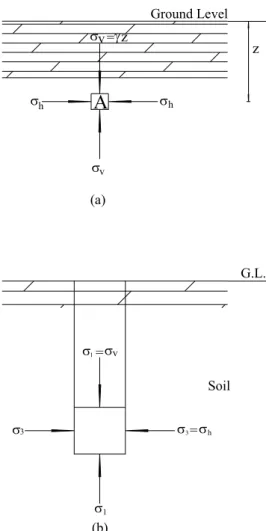
The coefficient at-rest Ko is referred to the condition where no lateral yielding occurs, under the condition of constrained lateral deformation. As shown in Fig. 2(a), the overburden pressure σv compresses the soil element A formed in a horizontal sedimentary deposit. During the formation of the deposit, the element is consolidated under this vertical pressure. The vertical stress produces a lateral deformation against surrounding soils due to the Poisson’s ratio effect. However, based on the definition and the field observation, over the geological period, the horizontal strain is kept to zero. It is concluded that the surrounding soil resists the lateral deformation with a developed lateral stress σh. A stable stress state will develop in which σh and
σv become stresses acting on the vertical and horizontal planes as shown in Fig. 2(b). Jaky (1948) proposed a simplified equation to estimate coefficient of earth pressure at-rest.
φ sin 1− = o K (1)
To determine stresses at certain point beneath the surface, Holl (1940) advanced the integration technique of the elastic solution developed by Boussinesq (1883). Considering a point A (z in depth) beneath the corner of a rectangle rectangular load (L in length and B in width), Holl proposed two equations to estimate the vertical normal stress σz and the horizontal normal stress σx.
(2)
(3)
where, q0 = load per unit area; R1= L2+z2 ; R2 = B2+z2 ; and R3 = L2+B2 +z2 .
Duncan and Seed (1986) presented an analytical procedure for the calculation of peak and residual compaction-induced stresses either in the free field or acting against vertical non-yielding structures. This procedure employs a hysteretic Ko -loading model (Fig. 3) to track the vertical and lateral stresses for a lift of backfill as it is placed, and as overlying lifts are subsequently placed and compacted. In this model, it is assumed that the effect of compaction
⎥ ⎥ ⎦ ⎤ ⎢ ⎢ ⎣ ⎡ ⎜ ⎜ ⎝ ⎛ ⎟⎟ ⎠ ⎞ + + = − 2 2 2 1 3 3 1 1 1 tan 2 R R R LBz zR LB qo z π σ ⎥ ⎦ ⎤ ⎢ ⎣ ⎡ − = − 3 2 1 3 1 tan 2 R R LBz zR LB qo x π σ
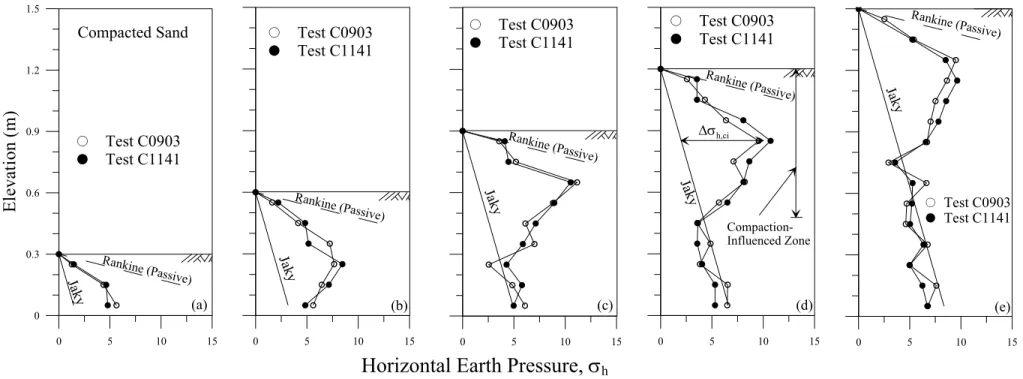
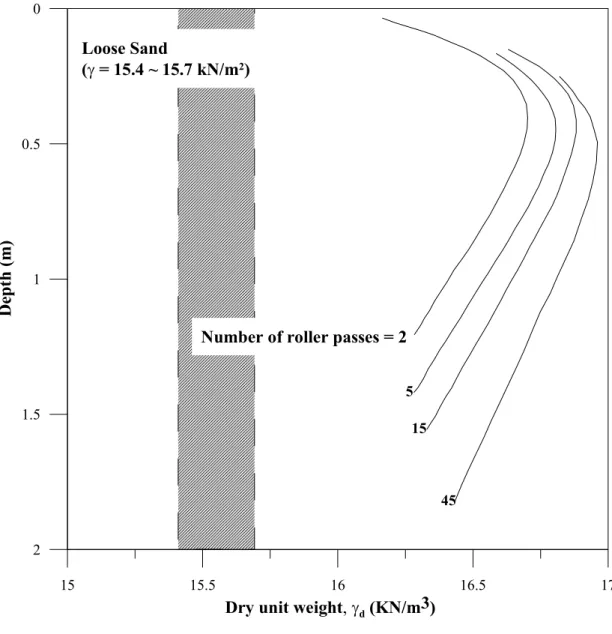
compaction, the lateral stress measured near the top of backfill is almost identical to the passive earth pressure estimated with Rankine theory (Fig. 4). The compaction-influenced zone rises with rising compaction surface. Below the compaction-influenced zone, the horizontal stresses converge to the earth pressure at-rest, as indicated in Fig. 4(e). D’Appolonia, et al. (1969) reported that the variation in the unit weight of compaction with depth for a poorly graded sand for which compaction was achieved by a vibratory drum rolleris is as shown in Fig. 5. In Fig. 5 at any given depth, the dry unit weight of compaction increases with the number of roller passes. However, the rate of increase in unit weight of soil gradually decreases after about 15 passes. Another fact from Fig. 5 is the distribution of dry unit weight with depth for any given number of roller pass. The dry unit weight and hence the relative density, Dr, reach maximum values at a depth of about 0.5 m and gradually decreases at lesser depths. This decrease occurs because of the lack of confining pressure near the surface of the fill.
Fig. 2. Development of in-situ stresses (after Chen, 2003) σ σ σ σ σ σ σ σ γ h h v v G.L. (a) Soil 1 1 3 3 (b) = z z v σ σh = = A Ground Level MPLP R RMUP RMLP ESS CMUP 1 Virgin Unloading Virgin Loading β σh Ko-line (σh = Ko vσ ) σ K1-line ( h = K1 vσ) K1,φ
Fig. 4. Distribution of horizontal earth pressure after compaction (after Chen, 2003)
Horizontal Earth Pressure, σ
h2
0 5 10 15
Rankine (Passive)
Ja ky (b) + Test C0903 , Test C1141 0 5 10 15 Rankine (Passive) Ja ky (c) + Test C0903 , Test C1141 0 5 10 15 Rankine (Passive) Ja ky Compaction-Influenced Zone (d) + Test C0903 , Test C1141 Δσh,ci 0 5 10 15
Rankine (Passive)
Ja ky (e) + Test C0903 , Test C1141 0 5 10 15 0 0.3 0.6 0.9 1.2 1.5 E lev at io n ( m ) Rankine (Passive) Ja ky Compacted Sand + Test C0903 , Test C1141 (a)
Number of roller passes = 2 5
15
45
15 15.5 16 16.5 17
Dry unit weight, γd (KN/m3)
2 1.5 1 0.5 0 Dept h ( m ) Loose Sand (γ = 15.4 ~ 15.7 kN/m2)
Fig. 5. Vibratory compaction of a sand - variation of dry unit weight with number of roller passes; thickness of lift = 2.45 m (after D’Appolonia, et al., 1969)
3. EXPERIMENTAL
APPARATUS
To investigate the effects of vibratory compaction on the vertical and horizontal stresses in a cohesionless soil mass, an instrumented model retaining wall facility at National Chiao Tung University (NCTU) was used. The NCTU non-yielding retaining wall facilities consist of three components: (1) the soil bin, (2) soil pressure transducers, and (3) the data acquisition system (Chen and Fang, 2002). Details of the vibratory soil compactor employed in all experiments are also introduced.
3.1 Soil Bin
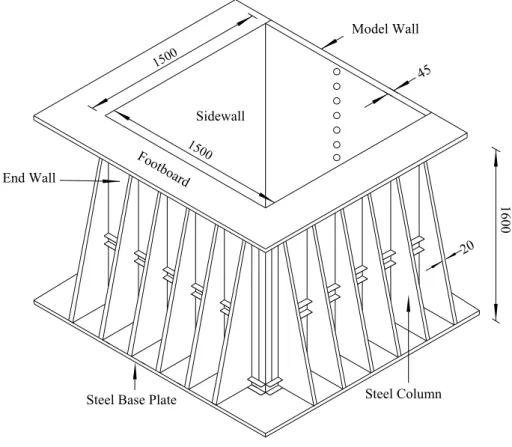
The soil bin was made of steel plates with inside dimensions of 1500 mm in length, 1500 mm in width, and 1600 mm in height as illustrated in Fig. 6. The sidewalls and end-wall of the soil bin were made of 35 mm-thick steel plates. Vertical steel columns and horizontal steel beams were used to increase the stiffness of the soil bin. The bottom of the soil bin was covered with a layer of SAFETY WALK to provide adequate friction between the soil and the base of the bin.
To achieve an at-rest condition, the wall material should be nearly rigid. As a result, a solid steel plate with a Young’s modulus of 210 GPa was chosen as the wall material. To avoid the lateral deformation of the box, twenty-four 20 mm-thick steel columns were welded vertically on the outside of the box. In addition, twelve C-shaped steel beams were welded horizontally around the box to further increase the stiffness of the box. Assuming a 1.5 m-thick cohesionless backfill with a unit weight = 17.1 kN/m3, and an internal friction angle = 41o was pluviated into the box. The estimated deflection of the model wall would be only 1.22 × 10⁻³ mm. Therefore, it can be concluded that the lateral deformation of the model wall is negligible.
3.2 Soil Pressure Transducers (SPTs)
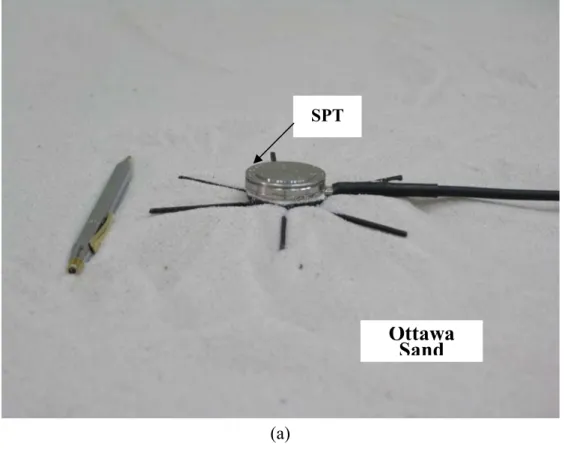
To investigate the development of stresses in the backfill, a series of soil pressure transducers (Kyowa BE-2KCM17, capacity = 98.1 kN/m2) were embedded in the cohesionless soil mass. The transducers were used to measure the variation of vertical and horizontal earth pressure after the filling and compaction of the backfill. The soil pressure transducers buried in the backfill were strain-gage-type transducers as shown in Fig. 7. The five radial extensions attached to the transducers were used to prevent possible rotation of the transducer due to vibratory compaction. The effective diameter of the transducer was 22 mm and its thickness was 6 mm.
3.3 Data Acquisition System
A data acquisition system was used to collect and store the considerable amount of data generated during the tests. The data acquisition system was composed of the following three
parts: (1) dynamic strain amplifiers (Kyowa: DPM601A and DPM711B); (2) AD/DA card (NI BNC-2090); and (3) Personal Computer. The analog signals from the sensors were filtered and amplified by the dynamic strain amplifiers (Kyowa DPM601A and DPM711B). Then, the analog test data were digitized by an A/D-D/A card. Finally, the digital data were transmitted to the personal computer for storage and analysis.
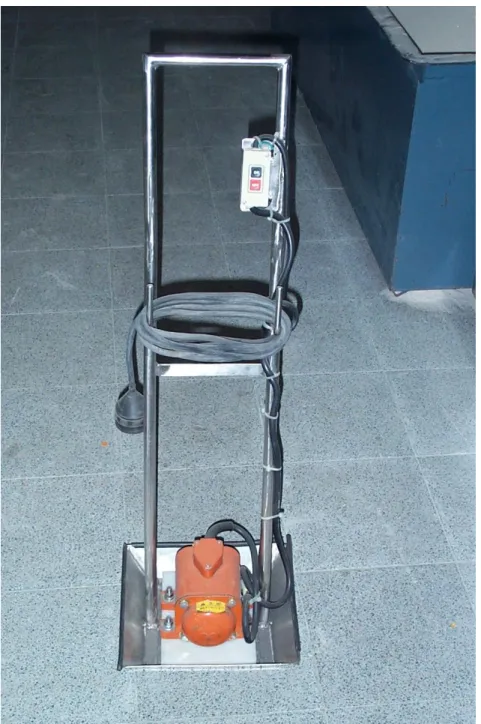
3.4 Vibratory Soil Compactor
To simulate compaction of backfill in the field, a vibratory soil compactor was used. The eccentric motor (Mikasa, KJ75-2P) was selected to be the source of vibration. The eccentric force generated by the motor could be controlled by adjusting the number of eccentric plates attached to the motor. For this study, sixteen eccentric plates (8+8) were used. The vibratory soil compactor with the base area of 225 mm × 225 mm was illustrated in Fig. 8. The eccentric motor was fixed on the steel compaction plate of the compactor. The height of the handle is 1.0 m, and the total mass of the compactor was 12.1 kg (0.119kN). Chen (2003) reported the peak cyclic vertical force (static and dynamic) measured with a load cell placed under the base plate of the vibratory compactor was 1.767kN, and the frequency of vibration was 44 Hz. With the 225 mm × 225 mm compaction plate, the peak cyclic normal stress σcyc applied on the surface of soil was 34.9 kN/m2. It should be mentioned that the distribution of contact pressure between the foundation of the vibratory compactor and the cohesionless soil varies with the stiffness of the footing. If the footing was perfectly rigid, the static contact pressure on the footing increases from zero at the edge to a maximum at the center.
1600
Unit : mm
1500 1500 45 20 SidewallSteel Base Plate Steel Column
End Wall Footboard
Model Wall
Fig. 6. NCTU non-yielding soil bin (after Chen, 2003)
4. BACKFILL
AND
INTERFACE
CHARACTERISTICS
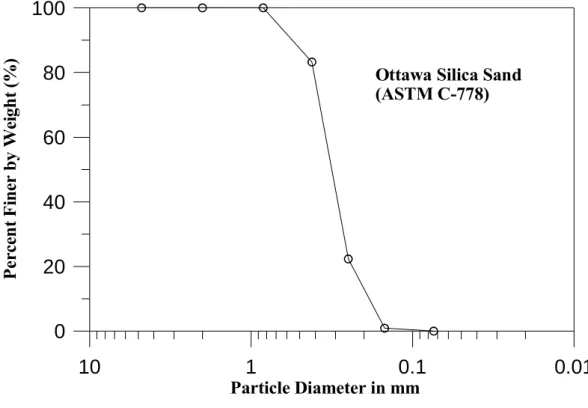
4.1 Backfill PropertiesAir-dry Ottawa silica sand (ASTM C-778) was used as the backfill material for all experiments. Grain-size distribution of the backfill is shown in Fig. 9. To establish the relationship between unit weight of backfill γ and its internal friction angle φ, direct shear tests were conducted. Chang (2000) established the relationship between the internal friction angle φ and unit weight γ of Ottawa sand. It was found that soil strength increases with increasing soil density. For the air-pluviated backfill, the empirical relationship between soil unit weight γ and φ angle was described as follows
φ = 6.43γ - 68.99 (4) where φ = angle of internal friction of soil (degree); γ = unit weight of soil (kN/m3); Eq. (2) is applicable for γ = 15.45 ~ 17.4 kN/m3 only. For compacted backfill, the following relationship can be formulated.
φ = 7.25γ - 79.55 (5) Eq. (3) is applicable for γ = 15.8 ~ 17.05 kN/m3 only.
4.2 Reduction of Wall Friction
To decrease the boundary effect for earth pressure tests, the shear stress between the backfill and wall should be minimized to nearly frictionless. To reduce the friction between wall and soil, a lubrication fabricated layer with plastic sheets was furnished for all earth pressure experiments. Two types of plastic sheeting, one thick (0.152 mm-thick) and two thin (0.009 mm-thick) plastic sheets, were adopted to reduce the interface friction. All plastic sheets were hung vertically on each sidewall before the backfill was deposited. The measured friction angle with this method was about 7.5°.
10
1
0.1
0.01
Particle Diameter in mm0
20
40
60
80
100
P ercen t F in er b y W ei gh t ( % )Ottawa Silica Sand (ASTM C-778)
5. VARIATION OF SOIL DENSITY DUE TO COMPACTION
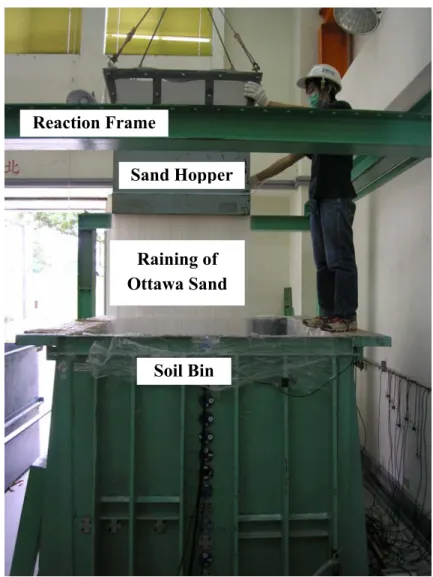
5.1 Soil Density and Stress MeasurementsTo achieve a uniform soil density in the backfill, Ottawa sand was deposited by air-pluviation method into the soil bin. Air-pluviation of the Ottawa sand into soil bin is shown in Fig. 10. Das (1994) suggested that the relative density of 15~50 % is defined as a loose condition. Ho (1999) established the relationship among slot opening, drop height, and soil density. The drop height of 1.0 m and hopper slot-opening of 15 mm were selected to achieve the loose backfill (Dr = 34%) for testing in this study. The soil density cup, as illustrated in Fig. 11. were used to observe the distribution of the fill density in the soil bin. Based on the observations, the mean relative density was Dr = 34.1 % with a standard deviation of 2.4%.
Fig. 12 (a) shows the locations of SPTs in the soil mass to measure σv and Fig. 12 (b) illustrates the locations of SPTs in the soil mass to measure σh. The installations of SPTs to measure σv and σh are shown in Fig. 13 (a) and Fig. 13 (b), respectively.
5.2 Pilot Tests
To establish the program for testing, pilot tests were executed. The testing procedures of point compaction were introduced as follows: (1) Before compaction, the loose backfill (Dr = 34 %) was filled with the air-pluviation method. (2) After the entire loose backfill had been filled, the vibratory compactor was placed at the center of the soil bin. (3) The soil mass was compacted for 5 seconds first, then the compactor was removed to measure the surface settlement profile. (4) Compacting the backfill, remove the compactor and measuring the surface settlement at t = 10, 20, 40, 80, 160, 320 and 640 seconds. It should be noted that the cross-section monitored in this study was perpendicular to the model wall and located at the center of the soil bin.
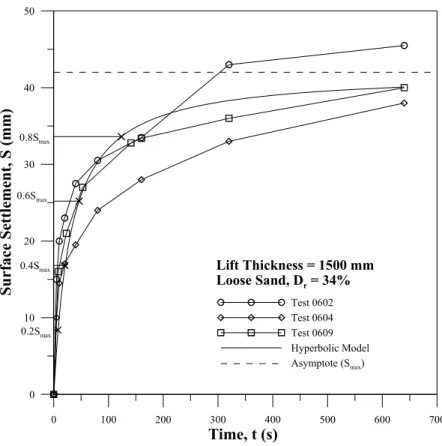
Fig. 14 shows the measured surface settlement versus the compaction time. It was found that the surface settlement increased rapidly after first 20 seconds of compaction. The rate of surface settlement increased slowly with increasing time of compaction. Based on the test data, a hyperbolic relationship function of the surface settlement versus the compaction time can be established as shown in Fig. 14. In this figure, the data points obtained from different tests indicated that the test results were quite reproducible. Based on the test results, the hyperbolic model was established to estimate the surface settlement S (mm) as a function of compaction time t (sec). The relationship can be expressed as:
(6)
The asymptote of the hyperbolic model was Smax = 42 mm. The corresponding compaction time to reach 0.2Smax, 0.4Smax, 0.6Smax, 0.8Smax were assumed as 7.7, 20.6, 46.3, and 123.5 seconds,
t t St 0238 . 0 7348 . 0 ) ( = +
respctively. The effects of compaction on the fill after 7, 20, 46 and 123 seconds of compaction were discussed in the following sections.
5.3 Density Change due to Compaction
To investigate the change of soil relative density induced by vibratory compaction, many soil density cups were embedded in the backfill to measure the localdensities at different locations. To constitute the contours of density change, density cups were buried closely in the soil mass at different elevations as shown in Fig. 15. The soil density cups were dug out from the soil mass and their weights were measured carefully after reaching the required compaction time. The contours of the relative density after 7, 20, 46, and 123 seconds of compaction can be illustrated as Fig. 16~19.
Before compaction, the backfill has a uniform relative density of 34 %. In Fig. 16, it is obvious that the soil density became quite dense (Dr = 51 %) under the vibratory compactor, and the soil density decreased gradually with the increasing distance from the compactor. The relative density increased from 34 % to 51 % right below the compactor. This indicates that the effects of vibratory compaction on the soil density were quite obvious. As the compaction time increased to 20, 46, and 123 seconds, more compaction energy was transmitted to the soils. In Fig. 16 to Fig. 19, the depth of the Dr = 36 % contour increased with increasing time of compaction. The relationship between maximum relative density and compaction time was shown in Fig. 20. It was observed that the peak relative density in the soil was increased with increasing time of compaction.
Fig. 10. Pluviation of the Ottawa sand into soil bin
Fig. 11. Soil-density cup
Sand Hopper
Raining of Ottawa Sand
Soil Bin Reaction Frame
Unit : mm
1500 35
45
Depth
Steel Base Plate Ottawa Sand Ste el C olum n Side-View +0 Model Wall 50 100 200 200 200 200 200 200 150 1500 SPT (a) Unit : mm 1500 35 45 Depth
Steel Base Plate Ottawa Sand Ste el C olum n Side-View +0 Model Wall 50 100 200 200 200 200 200 200 150 1500 SPT
(a)
(b)
Fig. 13. SPTs placed in soil bin to measure σv and σh
Ottawa
Sand
SPTOttawa
Sand
SPT0 100 200 300 400 500 600 700 Time, t (s) 0 10 20 30 40 50 Surface S et tlem ent, S (mm) Test 0602 Test 0604 Test 0609 Hyperbolic Model Asymptote (Smax) Lift Thickness = 1500 mm Loose Sand, Dr = 34% 0.2Smax 0.4Smax 0.6Smax 0.8Smax
Fig. 14. Hyperbolic model to estimate surface settlement S as a function of compaction time
1500 35
45
Steel Base Plate Ottawa Sand Ste el C olum n Side-View Model Wall Soil compactor 225 Motor 100200 400 600 100 100 200 200 200 300 100 200 400 600 150 150 300 300 600 600 50 300 Depth +0 1500 Density Cup
Distance from Model Wall, d (mm) De pth (mm) 36 40 44 48 52 56 60 64 68 48 44 40 36 225 mm
(Width of Compaction Plate)
Test 0615
Lift Thickness = 1500 mm Distribution of Dr (%)
t = 7 s
Fig. 16. Distribution of relative density after 7 s of point compaction
Distance from Model Wall, d (mm)
Depth (mm) 36 40 44 48 52 56 60 64 68 60 56 52 48 44 40 36 225 mm (Width of Compaction Plate)
Test 0616
Lift Thickness = 1500 mm Distribution of Dr (%)
t = 20 s Dr,max = 61 %
Distance from Model Wall, d (mm) Depth (mm) 36 40 44 48 52 56 60 64 68 64 6056 5248 44 40 36 225 mm
(Width of Compaction Plate)
Test 0623
Lift Thickness = 1500 mm Distribution of Dr (%)
t = 46 s Dr,max = 68 %
Fig. 18. Distribution of relative density after 46 s of point compaction
Depth (mm) 36 40 44 48 52 56 60 64 68 68 64 60 56 52 48 44 40 36 225 mm (Width of Compaction Plate)
Test 0625
Lift Thickness = 1500 mm Distribution of Dr (%)
t = 123 s Dr,max = 70 %
0 25 50 75 100 125 Compaction time, t (s) 30 40 50 60 70 80 Dr, m ax (% ) Ottawa Sand Lift Thickness = 1500 mm Loose Sand, Dr = 34 %
6. VARIATION OF EARTH PRESSURE DUE TO COMPACTION
6.1 Testing ProcedureThe testing procedure to investigate the change of vertical earth pressure, are introduced as follows: (1) before compaction, the loose backfill (Dr = 34 %, γ = 15.6 kN/m3, and φ = 31°) was prepared with the air-pluviation method. With the filling of the Ottawa sand, the SPTs were placed at the desired locations. Fig. 21 (a) and (b) illustrated the locations of SPTs to measure σv and σh, respectively; (2) after the 1.5m-thick loose backfill had been filled, the vibratory compactor was placed at the center of the soil bin; (3) the soil mass was compacted for t = 7 seconds, and then the compactor was removed. In the range of 5 to 10 seconds after the compacter removed, the vertical and horizontal earth pressures in the soil mass were monitored by SPTs placed in the backfill; (4) repeat step 3 for t = 20, 46, and 123 seconds.
Fig. 22 (a) shows the distribution of vertical earth pressure under the compactor after compaction. Before compaction, the vertical overburden pressure can be properly estimated with the equation σv = γz. The vertical earth pressure increased after 7 seconds of compaction. After 123 seconds of compaction, soil unit weight at the depth of 100mm increased from 15.6 to 16.5 kN/m3. Fig. 22 (b) represents the distribution of horizontal earth pressure under the compactor after compaction. Before compaction, the horizontal earth pressures measured were in good agreement with Jaky’s quation. After compaction, the vibratory compaction induced extra residual horizontal stress. And the lateral stress measured near the top of the backfill was close to the passive earth pressure estimated by Rankine’s theory. It is obvious from Fig. 22 (a) and (b) that the compaction-influenced zone extended from the compacted surface to the depth of approximately 600 mm. Based on the test results, the zone for measuring earth pressure was determined to be from z = 0 to 600 mm.
6.2 Change of Vertical Earth Pressure due to Compaction
To observe the change of vertical earth pressure after compaction, SPTs were buried in the soil mass at different elevations as shown in Fig. 23. Fig. 24 to Fig. 27 showed the contours of Δσv after 7, 20, 46 and 123 seconds of compaction, respectively. The peak Δσv increased with increasing compaction time due to more compaction energy transmitted to the soil. After the removal of the compactor, the residual stress in the soil mass was induced by the vibratory compaction. The point of peak Δσv, as the compaction time increased, has moved downward slightly from the depth of 250 mm to the depth of 350 mm.
compactor is less than 0.5 kN/m2.
6.3 Change of Horizontal Earth Pressure due to Compaction
To measure the horizontal earth pressure after compaction, SPTs were buried closely in the soil mass at different elevations at the same cross-section as shown in Fig. 29. Fig. 30 showed contours of the horizontal earth pressure Δσh after 7 seconds of the compaction. The contours of
Δσh after 20, 46, and 123 seconds of compaction were presented in Fig. 31, Fig. 32, and Fig. 33. It was found that the peak Δσh (1.93, 2.41, 3.16, 3.32 kN/m2) increased with increasing compaction time. This is because more compaction energy was transmitted to the soil. The peak
Δσh occurred at the depth of 200 mm and the peak Δσh zone expanded transversely with the increasing compaction time.
As compared with the elastic solution, Fig. 34 showed the distribution of Δσh due to a static surface loading q acting on the surface of soil. It was found that the surcharge influenced zone was approximately 300 mm. In Fig. 33 and Fig. 34, two high-stress zones can be observed under the surface loading area.
6.4 Mechanism of Soils under Compaction
The compaction of a cohesionless soil with a vibratory compactor can be simulated with the penetration of a square steel pile driven with a vibratory pile driver as indicated in Fig. 35. The ultimate point resistance Qp in a homogeneous soil can be calculated using the following equation,
(7)
where, Qp = point bearing capacity; Ap = area of pile tip; qp = unit point resistance; q’ = effective vertical stress at the level of the pile tip; Nq* = the bearing capacity factor.
For example, after the 123 seconds of vibratory compaction, the measured surface settlement was 40.3 mm. So the overburden pressure at the base of the compactor q’ = 0.62 kN/m2. Before compaction, the soil unit weight of density was 15.6 kN/m2 and the soil friction angle was 31°. Forφ = 31°, Meyerhof (1976) suggested that the bearing capacity factor Nq* = 60. The ultimate point resistance qp at 123 seconds of compaction is estimated with Eq. (7) was 37.44 kN/m2. By repeating the technique mentioned above, the ultimate load qp after 7, 20, and 46 seconds of compaction could be estimated as 19.66, 27.14, and 32.92 kN/m2, respectively. As the compaction time increasing, the ultimate point resistance qp increased gradually to the cyclic compacting stress σcyc = 34.9 kN/m2 applied on the surface of soil. It is suggested that in the vibratory compaction process, the soil mass will settle until the ultimate load qp and the cyclic compacting stress σcyc reached an equilibrium.
* ' q p p p p A q A q N Q = =
Unit : mm
1500
35 45
Steel Base Plate Ottawa Sand Stee l C olum n Side-View Model Wall 225 100 100 100 100 300 400
Soil compactor Motor
Depth +0 1500 SPT 50 100 (a) Unit : mm 1500 35 45
Steel Base Plate Ottawa Sand Ste el C olum n Side-View Model Wall 225 100 100 100 100 200 200
Soil compactor Motor
Depth
+0
1500
50
0 5 10 15 20 25 30
Vertical Earth Pressure, σV (kN/m2) 1500 1200 900 600 300 0 Depth (mm) t = 0 s (Loose Sand) t = 7 s t = 20 s t = 46 s t = 123 s σv = γz (γ = 15.6 kN/m2) σv = γz (γ = 16.5 kN/m2) Lift Thickness = 1500 mm Loose Sand γ = 15.6 kN/m3 Dr = 34% φ = 31o (a) 0 5 10 15 20 25 30
Horizontal Earth Pressure, σh (kN/m2) 1500 1200 900 600 300 0 De pth (m m) t = 0 s (Loose Sand) t = 7 s t = 20 s t = 46 s t = 123 s Rankin e (Passive) R an kin e (A ctive ) Test 0709 Lift Thickness = 1500 mm Loose Sand γ = 15.6 kN/m3 Dr = 34% φ = 31o Ja ky (b)
Unit : mm
1500
35 45
Steel Base Plate Ottawa Sand S te el C olum n Side-View Model Wall 225 50
Soil compactor Motor
Depth +0 1500 100 100 100 100 100 100 300 500 200 400 600 100 200 400 SPT
Fig. 23. Locations of SPTs to measure Δσv
De pt h ( m m ) 0.5 1 1.5 2 2.5 3 3.5 4 4.5 1.5 2.0 1.0 0.5 2.5 3.0 3.5 Ottawa Sand Lift Thickness = 1500 mm Distribution of Δσv (kN/m2) t = 7 s The Peak Δσv= 3.60 kN/m2 225 mm (Width of Compaction Plate)
Distance from Model Wall, d (mm) Depth (mm) 0.5 1 1.5 2 2.5 3 3.5 4 4.5 1.5 2.0 1.0 0.5 2.5 3.0 3.5 4.0 Ottawa Sand Lift Thickness = 1500 mm Distribution of Δσv (kN/m2) t = 20 s The Peak Δσv= 3.99 kN/m2 225 mm (Width of Compaction Plate)
Fig. 25. Distribution of Δσv after 20 s of compaction
Distance from Model Wall, d (mm)
Depth (m m) 0.5 1 1.5 2 2.5 3 3.5 4 4.5 1.5 2.0 1.0 0.5 2.5 3.0 3.5 4.0 Ottawa Sand Lift Thickness = 1500 mm Distribution of Δσv (kN/m2) t = 46 s The Peak Δσv= 4.44 kN/m2 225 mm (Width of Compaction Plate)
Distance from Model Wall, d (mm) Depth (mm) 0.5 1 1.5 2 2.5 3 3.5 4 4.5 1.5 2.0 1.0 0.5 2.5 3.0 3.5 4.0 4.5 Ottawa Sand Lift Thickness = 1500 mm Distribution of Δσv (kN/m2) t = 123 s The Peak Δσv= 4.96 kN/m2 225 mm (Width of Compaction Plate)
Unit : mm
1500
35 45
Steel Base Plate Ottawa Sand Ste el C olum n Side-View Model Wall 225 50
Soil compactor Motor
Depth +0 1500 100 100 100 100 100 100 300 500 200 400 600 100 200 400 SPT
Fig. 29. Location of SPT to measure Δσh
Distance from Model Wall, d (mm)
De pt h (mm) 0.5 1 1.5 2 2.5 3 1.5 1.0 0.5 225 mm (Width of Compaction Plate)
Ottawa Sand
Lift Thickness = 1500 mm Distribution of Δσh (kN/m2)
t = 7 s
The Peak Δσh= 1.93 kN/m2
Distance from Model Wall, d (mm) D ept h ( mm) 0.5 1 1.5 2 2.5 3 1.5 2.0 1.0 0.5 225 mm (Width of Compaction Plate)
Ottawa Sand
Lift Thickness = 1500 mm Distribution of Δσh (kN/m2)
t = 20 s
The Peak Δσh= 2.41 kN/m2
Fig. 31. Distribution of Δσh after 20 s of compaction
Depth (mm) 0.5 1 1.5 2 2.5 3 1.5 2.0 1.0 0.5 2.5 3.0 225 mm (Width of Compaction Plate)
Ottawa Sand
Lift Thickness = 1500 mm Distribution of Δσh (kN/m2)
t = 46 s
Distance from Model Wall, d (mm) De pt h (mm) 0.5 1 1.5 2 2.5 3 1.5 2.0 1.0 0.5 2.5 3.0 3.0 225 mm (Width of Compaction Plate)
Ottawa Sand
Lift Thickness = 1500 mm Distribution of Δσh (kN/m2)
t = 123 s
The Peak Δσh= 3.32 kN/m2
Fig. 33. Distribution of Δσh after 123 s of compaction
Fig. 34. Horizontal earth pressure due to the surface loading q by Holl’s elastic equation
G.L. B = 225 mm 40 mm qp q' Loose sand D = 34%
Vibratory pile driver
r
Square steel pile
7. CONCLUSIONS
Based on the vertical and horizontal earth pressure for loose sand and the surface settlement, change of soil density and earth pressures after the vibratory compaction at a point, the following conclusions were drawn.
1. For a loose backfill, the vertical and horizontal earth pressures in the soil mass can be properly estimated with the equation σv = γz and Jaky’s equation, respectively.
2. The compaction of a cohesionless soil with a vibratory compactor can be simulated with the penetration of a square steel pile driven with a vibratory pile hammer. In the compaction process, the soils under the compacting plate settled until the ultimate tip resistance qp and the cyclic compacting stress σcyc reached an equilibrium.
3. The depth of the relative density contour (Dr = 36 %) increased with increasing time of compaction. The peak relative density in the soil also increased with increasing time of compaction.
4. It was obvious that the peak Δσv (3.60, 3.99, 4.44, 4.96, kN/m2) and Δσh (1.93, 2.41, 3.16, 3.32 kN/m2) increased with increasing compaction time. This is because, with increasing compaction time, more compaction energy was transmitted to the soil.
5. After the removal of the compactor, residual stresses in the soil mass were measured due to the vibratory compaction. The point of peak Δσv, as the compaction time increased, moved downward slightly from the depth of 250 mm to the depth of 350 mm.
8. REFERENCES
1. Boussinesq, V. J., (1883), “Application des Potential a L’Etude de L’Equilibre et due Mouvenent des Solides Elastiques,” Gauthier-Villars, Paris.
2. Broms, B. (1971). “Lateral earth pressures due to compaction of cohesionless soils.” Proc., 4th Int. Conf. Soil Mech., Budapest, 373-384.
3. Chang, S.Y. (2000). “Effect of backfill density on active earth pressure.” Master of Engineering Thesis, Dept. of Civil Engineering, National Chiao Tung University, Hsinchu, Taiwan.
4. Chen, T. J. and Fang, Y. S. (2002). “A new facility for measurement of earth pressure at rest”. Geotechnical Engineering Journal, SEAGES, Vol. 33. No. 3, December, pp.153-159. 5. Chen (2003). “Earth pressure due to vibratory compaction.” Ph.D. dissertation, Department
of Civil Engineering, National Chiao Tung University, Hsinchu, Taiwan.
6. D’ Appolonia, D.J., Whitman, R.V., and D’ Appolonia, E.D. (1969). “Sand Compaction with Vibrator Rollers,” Journal of the Soil Mechanics and Foundation Divison, ASCE, Vol. 95, No. SM1, 263 – 284.
7. Das, B. M. (1994). “Principal of geotechnical engineering.” PWS Publishing Company, Boston.
8. Duncan, J. M., and Seed, R. B., (1986), “Compaction-Induced Earth Pressures under Ko-Conditions,“ Journal of Geotechnical Engineering, ASCE, Vol. 112, No. 1, pp. 1-22. 9. Duncan, J. M., Williams, G. W., Sehn, A. L., and Seed, R. B. (1991). “Estimation earth
pressures due to compaction.” Journal of Geotechnical Engineering, ASCE, 117(12), 1833-1847.
10. Ho, Y. C., (1999), “Effects of Backfill Compaction on Passive Earth Pressure,” Master of Engineering Thesis, National Chaio Tung University, Hsinchu, Taiwan.
11. Holl, D. L., (1940). “Stress transmission in earths.” Proc. High. Res. Board, Vol.20, pp.709-721.
12. Hou, P. H. (2006). “Design and Construction of NCTU KA Model Retaining Wall.” Master of Engineering Thesis, Dept. of Civil Engineering, National Chiao Tung University, Hsinchu, Taiwan.
13. Jaky, J. (1944). “The coefficient of earth pressure at rest.” Journal for Society of Hungarian Architects and Engineers, Budapest, Hungary, Oct., 355-358.
14. Jaky, J., (1948), “Pressure in Soils,” Proceedings, 2nd International Conference on Soil Mechanics and Foundation Engineering, 1, 103-107.
15. Meyerhof, G. G. (1976). “Bearing Capacity and Settlement of Pile Foundations,” Journal of the Geotechnical Engineering Divison, American Society of Civil Engineers, Vol. 102, No. GT3, pp. 197–228.
16. NAVFAC. (1982). Foundations and earth retaining structures design manual, Dept. of Navy, DM 7.2, Alexandria, Va.
17. Peck, R. B., and Mesri, G. (1987). Discussion of “Compacted-induced earth pressures under Ko-conditions.” Journal of Geotechnical Engineering, ASCE, 113(11), 1406-1408.
18. Rowe, P. W., (1954), “A Stress Strain Theory for Cohesionless Soil with Applications to Earth Pressures At Rest and Moving Walls,” Geotechnique, Vol. 4, pp. 70-88.
9. 計劃成果自評:
本研究旨在探討震動夯實所引致之土體密度及應力變化。為了模擬現地回填土夯實過程, 利用國立交通大學模型擋土牆設備進行試驗。本研究以氣乾渥太華砂作為回填土,回填土 高1.5 m,量測鬆砂在初始相對密度 Dr = 34 %時地表震動夯實對砂土密度與土壓力之影 響。並針對歷時 7 秒、20 秒、46 秒及 123 秒之地表震動夯實造成之土壤密度及應力進行量 測分析。依據實驗結果,本研究獲得以下結論。(1) 於鬆砂回填土中,土體之垂直及水平 有效應力分別可以σv = γz 與 Jaky 公式估算。(2) 非凝聚性土壤中,因地表夯實所引致之土 體受力情況可用方形鋼椿受震動打樁的模式加以模擬。夯實過程中,地表隨之沉陷,直至 樁底極限承載力 qp與震動夯實應力σcyc達到平衡。(3) 隨夯實時間增加,相對密度等高線 Dr = 36 %漸往深處發展,且土壤之最大相對密度Dr,max亦隨夯實時間增加而提高。(4) 夯 實時間越長,土體中殘餘之最大垂直及最大水平應力變化越大。此乃因為隨夯實時間增加, 夯實能量亦持續傳遞至土體內部。(5) 夯實後移除夯實機,可量得土體內部因夯實所引致 之殘餘應力。夯實時間漸增,最大垂直應力Δσv位置自深度250 mm 漸向下移動至 350 mm 處。本研究內容與計劃書完全相符。 本研究獲得數項創新發現,且具實用價值,充分達成計劃目標。將於近期內投稿至國 際知名期刊。參與研究的碩士班研究生籍此機會,習得大型基礎模型實驗與資料擷取之操 作,以及嚴謹審慎之實驗方法與獨立思考的能力,獲益匪淺。可供推廣之研發成果資料表
□ 可申請專利 □ 可技術移轉 日期:98 年 10 月 31 日國科會補助計畫
計畫名稱:震動夯實造成之土壤應力及密度變化 計畫主持人:方永壽 教授 計畫編號:NSC 97-2221-E-009-124- 學門領域:土木水利工程技術/創作名稱
發明人/創作人
中文: 本研究利用國立交通大學模型擋土牆設備探討震動夯實所引 致之土體密度及應力變化。本研究以氣乾渥太華砂作為回填土進行 夯實,回填土高1.5 m,量測在相對密度Dr = 34 %時地表震動夯實 對砂土密度與土壓力之影響。依實驗結果可獲得以下結論。(1)鬆砂 之垂直及水平有效應力分別可以σv = γz 與 Jaky 公式估算。(2)非凝 聚性土壤因地表夯實所引致之土體受力情況,可用方形鋼椿受震動 打樁的模式加以模擬。 (3)夯實時間增加,相對密度等高線Dr= 36 %漸往深處發展,且土壤之最大相對密度Dr,max亦隨夯實時間增加而 提高。(4)夯實時間增加,夯實能量持續傳遞至土體,故土體中殘餘 之最大垂直及最大水平應力變化越大。(5)夯實時間漸增,最大垂直 應力Δσv位置自深度250 mm 漸向下移動至 350 mm 處。技術說明
英文: This report studied the change of soil density and earth pressuresdue to vibratory compaction. Air-dry Ottawa sand was used as the backfill material. The height of backfill of Dr = 34 % was 1.5 m. Based on the test results, the following conclusions were drawn. (1) For a loose backfill, the vertical and horizontal earth pressures in the soil mass can be properly estimated with the equation σv = γz and Jaky’s equation, respectively. (2) The compaction of a cohesionless soil with a vibratory compactor can be simulated with the penetration of a square steel pile driven with a vibratory pile hammer. (3) The depth of the contour of Dr = 36 % and peak Dr increased with increasing compaction time. (4) The peak Δσv and Δσh increased with increasing compaction time. This is because, with increasing compaction time, more compaction energy was transmitted to the soil. (5) The point of peak Δσv, as the compaction time increased, moved downward slightly from the depth of 250 mm to the depth of 350 mm.
推廣及運用的價值
本研究屬於基礎學術性研究,一年計劃完成,所獲研究成果將有助於國內外基礎工程設計規劃之參考。
行政院國家科學委員會補助參與國際學術會議報告
專題研究計畫補助編號:NSC 97-2221-E-009-124- 報告人: 方永壽教授 服務機構: 國立交通大學土木工程系所 職稱: 教授 會議名稱: 海峽兩岸軌道交通建設與環境工程高級技術論壇 舉辦地點: 杭州、中國 舉辦時間: 2008 年 11 月 4 日~ 7 日 支持單位: 中國土木工程學會 香港工程師學會岩土分部 台灣財團法人地工技術研究發展基金會 主辦單位: 同濟大學土木工程學院 上海申通地鐵集團有限公司 上海隧道工程股份有限公司 上海市土木工程學會 上海市土木工程學會地下工程專業委員會 中國土木工程學會隧道與地下工程分會 中國土木工程學會城市軌道交通技術推廣委員會 北京交通大學土木建築工程學院 天津大學建築工程學院 東南大學岩土工程研究所 浙江省土木建築學會 浙江大學建築工程學院 浙江省建築業行業協會地下工程分會 杭州市地鐵集團有限公司 浙江科技學院建築工程學院 攜回資料: 研討會論文集 1 冊(論文集封面頁如下) 國科會專題研究計畫補助編號:NSC 97-2221-E-009-124-一、參加會議經過 與世界各國相比,中國大陸城市軌道交通建設设起步較晚,但是發展 迅速。近年大陸各大城市相繼掀起興建捷運(地鐵)系統的高潮。據初步統 計,至2010 年為止,大陸各城市軌道交通的建設規劃總長度已超過 1,400 公里。 1.1 研討會緣起 為了交流大陸、台灣及香港在軌道交通建設(包含捷運、高速鐵路及 磁浮交通建设)的規劃、設計及施工安全控制、營運與管理等方面所累積 的寶貴經驗、以及所遭遇的問題。上海同濟大學土木工程學院、浙江大學 城市學院等12 個單位經共同研究,聯合發起主辦「城市軌道交通建设與 環境境工程」高级技術論壇。 本次論壇是繼 2002 年 11 月在杭州舉辦的首屆「城市地鐵建設和環境 岩土工程」高级技術論壇之後的第二屆盛會。上一屆論壇,曾邀请了海峽 兩岸的院士、學者、及著名資深大地/捷運工程專家,探討捷運工程的規 劃、設計、施工、營運與管理諸多面所累積的相關技術和理論成果,獲得 了豐碩的成果。2008 年的技術論壇是海峡兩岸眾多地工名家討論捷運(地 鐵)建設的第二次盛會。 1.2 研討會主題 本次論壇共分為下列10 個討論議題,發表經審查、具重要性的論文, 以促進海峽兩岸軌道工程學術界與工業界的跨領域交流,分述如下: 1. 特邀報告 2. 專論 3. 軌道交通線網站點規劃設計研究 4. 軌道交通建設政策法規及技術標準研究 5. 軌道交通風險管控與工程安全 6. 隧道施工控制與變形分析 7. 深開挖設計與施工 8. 軌道交通沿線近接施工影響研究 9. 列車減振減噪技術 10. 相關討論及其他
1.3 台灣與會者名單: 姓 名 職 稱 莫若楫 亞新工程顧問公司 董事長 黃南輝 亞新工程顧問公司 顧問 歐晉德 台灣高鐵公司 執行長 謝致德 台灣高鐵公司 副總經理 李建中 台灣世曦工程顧問公司 董事長 楊漢生 台灣世曦工程顧問公司 資深協理 周功台 台灣世曦工程顧問公司 經理 胡邵敏 三力技術工程顧問公司 首席資深顧問 鍾毓東 地工技術研究發展基金會 董事長 方永壽 交通大學工學院 院長 俞清瀚 富國技術工程公司 董事長 蘇鼎鈞 亞新工程顧問公司 經理 康思敏 亞新工程顧問公司 正工程師 陳晉源 中華民國道路協會 常務理事 李碧霞 地工技術研究發展基金會 執行祕書 廖美嬌 地工技術研究發展基金會 助理祕書 下圖為台灣與會者與研討會主辦人史佩棟教授在會場的合影。
1.4 知名學者專題報告 主辦單位邀請海峽兩岸三地數位知名的大地工程學者發表專題演 講,例如於2008 年 11 月 5 日上午邀請中國中科院資深院士孫鈞報告「地 下鐵道工程施工及營運中的安全管理及風險整治」,台灣高鐵公司執行長 歐晉德博士報告「台灣高速鐵路營運策略與目標」,香港岩土工程學會主 席何毅良先生報告「香港鐵路網路拓展的歷程與挑戰」。三位大師級學者 的報告果然內容精采,與會者收穫甚為豐富。 二、與會心得 2.1 主持會議 報告人方永壽教授很榮幸的被大會指定為 2008 年 11 月 6 日(星期三) 上午08:30 ~ 10:10 第一場研討的主持人,共同主持人為上海同濟大學地下 建設與工程系的束昱主任,主持工作進行的非常順利,下圖為主持人與共 同主持人在會場的合照。 2.2 報告人發表論文 報告人於 2008 年 11 月 6 日(星期四)下午 1:30 發表論文,報告人發表 的論文題目是:「台北捷運板橋線通風井破鏡工程事故與復舊」。論文藉由 台北捷運板橋線CP262 標通風井破鏡工程意外事故,說明於都市軟弱土 層中進行地下隧道施工,可能的意外發生原因及復舊方式。於軟弱地盤中 施作潛盾隧道,因施工前地質調查作業不詳實、地盤改良施工品質不佳, 或地盤改良體存在水路等均可能造成意外事故發生,特別是在高地下水壓
三、考察參觀活動 主辦單位安排與會者於 2008 年 11 月 7 日(星期五)工程參觀,參觀主 題為目前全世界最長的跨海大橋:「杭州灣大橋工程」。 如下圖所示,杭州灣跨海大橋北起嘉興市,跨越寬闊的杭州灣海域, 止於寧波市,大橋於2003 年開工建設,2008 年奧運會前建成通車。大橋 建成後,可縮短寧波至上海間的陸路距離120 餘公里。
如下圖所示,大橋全長 36 公里,是目前世界上最長的跨海大橋。若 以時速90 公里駕車通過,過橋需時 24 分鐘。報告人當天僅乘車快速通過, 且天候雨霧濛濛,視線欠佳,但是大家仍然可以感覺受此跨海大橋的工程 浩大與雄偉。 可惜大橋中途的海中觀景平台尚未完工,無法停車一窺跨海大橋的全 貌,有些遺憾。 四、特別活動 可能是應大陸官方的要求,主辦單位安排全體台灣與會者於 2008 年 11 月 6 日上午 11:00,至會場新僑飯店 17 樓天風閣餐廳,接受杭州市人 大常委會副主任及民革杭州市委主任委員陳重華女士(名片如下)的午宴 招待。在場參加特別活動的人士還有杭州市台辦領導數人,都是認真的執 行他們的工作。
五、附錄: 會議議程 ۞ 会议议程 (二稿) 日期 时间 主持人 致辞 / 报告 / 演讲人 开幕式 9:00~ 10:20 史佩栋 孙钧、张雁、莫若楫、何毅良、张苗根、赵如龙、市领导 (每人6 分钟) 影视短片:国产盾构掘进机产业化发展进程 11 月 5 日 上 午 第二场 10:30~ 12:00 孙 钧 张 雁 王振信:盾构施工对环境的影响 莫若楫:铁路及城轨建设设计施工发包办法实务研讨 应名洪:上海市轨道交通网络建设与运营管理(每人30 分钟) 第一场 1:30~ 3:30 朱合华 周文波 孙 钧:地下铁道工程施工及运营中的安全管理与风险整 治 欧晋德:台湾高速铁路营运策略及目标 张 雁:5·12 汶川大地震后震区城市轨道交通建设调研 胡邵敏:台湾城市捷运工程新挑战 (每人 30 分钟) 下 午 第二场 3:45~ 5:15 胡邵敏 黄宏伟 周文波:我国软土盾构法隧道施工技术综述 何毅良:香港铁路网络拓展的历程与挑战 朱合华:数字化技术在城市隧道施工安全控制中的应用研 究 (每人30 分钟) 第一场 8:30~ 10:10 方永寿 王元丰 黄宏伟:上海轨道交通网络化建设风险研究 傅德明:上海地铁多线换乘枢纽站工程 锺毓东:台北捷运沿线禁限建管理制度与实例 梅志荣:汶川地震区交通工程破坏特征和恢复重建对策研 究 俞清翰:轨道建设沿线近接施工影响测试与限建范围检讨 (每人20 分钟) 11 月 6 日 上 午 第二场 10:20~ 12:00 何毅良 夏建中 苏鼎钧:地下工程风险管理之咨询平台 王元丰:轨道交通标准对我国城市经济的影响 桂业琨:上海轨道交通7#线风井无人沉箱施工技术 高大钊:地铁勘察规范中基床系数测定方法的溯源分析与 建议 冯爱军:中国城市轨道交通发展调查问卷分析 (每人20 分钟)
第一场 1:30~ 4:10 锺毓东 冯爱军 方永寿:台北捷运板桥线通风井破镜工程事故与复旧 陈汉丰:香港岩土工程监测技术的发展 谢致德:台湾高速铁路营运阶段噪音防制管理研究 康思敏:冲击力传递装置在捷运工程上的应用 尹学军:钢弹簧深置板技术的应用及其最新发展 俞暄平:上海市轨道交通4 号线事故与修复 沈林冲:杭州地铁深基坑工程的实践与认识 金国龙:基于地铁隧道的列车振动荷载确定方法研究 (每人20 分钟) 下 午 闭幕式 4:25~ 5:15 李良杰 傅德明 李建中(大会学术总结)、史佩栋(闭幕词) 议程如有变更,请注意大会通知。
2008 海峡两岸城市轨道交通建设与环境工程高级技术论坛
台北捷运板桥线通风井破镜工程意外事故与复旧
方永寿
1、朱旭
2、黄文庆
1、陈沧江
3 1交通大学土木工程系 2台北市政府捷运工程局 3中兴工程顾问公司轨道工程二部摘要
本文藉由台北捷运板桥线CP262标通风井破镜工程意外事故,说明于都市软弱土层中进 行地下隧道施工,可能的意外发生原因及复旧方式。 于软弱地盘中施作潜盾隧道,因施工前 地质调查作业不详实、地盘改良施工质量不佳 ,或地盘改良体存在水路等均可能造成意外事 故发生,特别是在高地下水压下,地盘改良作业及质量扮演重要角色,大地工程师应特别注 意。同时亦应考虑其他如双重镜面、柔性镜面等工法,或隔舱、冻结工法及弃壳等措施,应 用多重防堵地下水设计,方可有效的阻隔地下水对于潜盾机出发段及到达段的危害。关键词:
台北捷运、困难案例、软弱地盘、意外事故、潜盾隧道。一、前言
在 软 弱 地 盘 施 作 隧 道 工 程 , 一 般 以 明 挖 覆 盖 工 法(Cut&Cover Method) 及 潜 盾 工 法(Shield Tunnelling Method)为主,为因应明挖覆盖工法对施工环境的冲击,及潜盾隧道费 用昂贵的困扰,亦有设计者将原来以岩盘为对象的新奥隧道工法(New Austrian Tunnelling Method,简称NATM工法)应用在软弱地盘上。以台北都会区捷运系统隧道工程为例,考虑 经 济 性 与 安 全 性 , 除 较 浅 的 隧 道 采 明 挖 覆 盖 工 法 外 , 其 余 多 采 潜 盾 工 法 施 作 , 仅 在 新 店 线 CH221标部分隧道采用NATM工法。由于施作地下工程深受土层变异性影响,风险性很高, 因此有必要从过去失败案例中吸取经验,记取教训,并深切的检讨改进,才能在施工时将风 险降至最低。 有鉴于此,大地工程学会及台北捷运局,在中兴工程顾问社及顾 问公司的协助 下,将历年来捷运建设所累积的大量成果,结合学界相关领域专才,并广伸触角联合捷运工 程相关的政府单位、顾问公司及营造厂等,着手进行捷运工程中有关大地工程设计与施 工成 果的汇整与统计分析工作,期望经由设计与施工成果的具体汇整,不仅可传承捷运工程长期 以来累积的宝贵工程经验,供未来设计与施工参考,更重要的是经由困难案例的设计、施工 与解决方案的搜集汇整,可于大地工程人员在面临各种困难地质或施工环境时,提供一完整 且直接的解决方案,减少工程人员误判或因未采取有效措施造成严重灾变及损失。 本文藉由台 北捷运板 桥 线CP262标通风井A破镜工程的意外事故,说明于都市软弱土层 中进行地下隧道施工,可能的意外发生原因及复旧方式,藉由案例的阐述及检讨,作为工程 界于软弱地盘隧道施工的借镜及参考,以减少尔后意外事故的发生机率。
二、工程概述
如图1所示,台北捷运板桥线CP262标工程横跨台北县、市,以上、下行两条潜盾隧道穿 越新店溪河床 下方,东 端以通风井B与CP261标衔结,西侧转辙段则与CP263标的江子翠车 站相连,除转辙段及通风井A采明挖覆盖工法外,其余均采潜盾隧道工法施作。本工程采用2 部长度7.68 m,外径6.24 m的土压平衡式潜盾机施工,自转辙段往台北市方向发进,到达通 风井A后,再整修发进穿越新店溪河床下方,到达CP261标通风井B为止。上、下行隧道总长 3,842 m,隧道衬砌以内径5.6 m,厚度0.25 m,长度1.0 m的预铸混凝土环片组立而成。因 须穿越平均河水深度11.1 m的新店溪下方,考虑抗浮及安全需求,隧道采最小覆土深度12.1 m 的设计,线形在通风井A处最深(潜盾机覆土深度达27.3 m),两侧坡度分别为2.8 %及0.3 %。 通风井A距新店溪行水区约340 m,为长23.5 m,宽23 m的结构物,以厚度l.2 m,深度55 m,方永壽等:台北捷运板桥线 CP262 标通风井破镜工程意外事故与复旧 贯入砾石层内3 m的连续壁作为挡土设施。为防止开挖与构筑期间,开挖区内的土壤受底层 水压作用,而发生地盘砂涌现象,于进行开挖作业时,利用深井排水以降低地下水压。 Pan-chiao City Crossover Ventilation Shaft A Ventilation Shaft B Da-han Creek Hsin-Tien Cree k Tam-shu i River Taipei City N Lot CP262 To BL5 Station Down-track Bored Tunnel Up-track Bored Tunnel To BL4 Station Accident Location Hsin-chuang City Hwa-chiang Bridge (Cut-and-Cover Tunnel) 圖1 台北捷運板橋線CP262標工程範圍 图1 台北捷运板桥线CP262标工程范围 圖2 工址地質剖面 Ventilation Shaft A SM CL CL SM GM CL EL.103.0 EL.101.5 EL.89.0 EL.84.0 EL.69.0 EL.64.0 EL.61.0 EL.54.0 EL.49.0 Shield No.2 CJG Up-Track Tunnel
Ching-mei Gravel Layer SM/ML CL/ML Diaphragm Wall Base Slab SM 3 4 5 6 3 2 1 1A Ground Level Pizometric level for sublayer 5 Pizometric level for sublayer 3 Pizometric level for Ching-mei Gravel Layer 图2 工址地质剖面
2.1 地层概况
2008 海峡两岸城市轨道交通建设与环境工程高级技术论坛
2.2 破镜前的镜面处理措施
潜 盾 隧 道 破 镜 施 工 为 一 高 风 险 工项,为预防潜盾机到达过程中发生 意 外 事 故 , 承 商 于 事 前 采 取 三 项 措 施: 1.到达段的地盘改良 一 般 普 遍 被 采 用 的 地 盘 改 良 工 法 为 二 重 管 高 压 喷 射 灌 浆(JSG) 工 法 , 有效 深 度约25 m。当改良深度 更大时,喷射压力必须加大以克服地 下水压,并冲击土壤,使注入的浆液 与土壤可以充分混合或置换,以形成 强度较高的地盘。本工程到达段镜面 的改良深度超过35 m,考虑JSG工法 于 此 深 度 下 所 形 成 的 地 盘 改 良 体 成 效堪虑,承商改用喷射能量更大的三 重管高压喷射灌浆(CJG)工法施作, 其与JSG工法最大不同在于,CJG工 法以40 MPa超高压水及空气作为喷 射媒介切割土壤,JSG工法则仅使用 20 MPa压力的水泥砂浆及空气。 如 图3 所 示 , 本 工 程 到 达 段 的 CJG地盘改良体,包含上、下行隧道 各5排、40支CJG桩,以三角形重迭 配置,改良体桩径1.8 m,桩心距1.54 m(重迭约为0.26 m),形成一个长度 6.27 m的地盘改良区。考虑潜盾机长 度7.68 m,改良区无法将潜盾机完整包围,故于CJG改良区后方,另增设长约3 m的CW1地 盘改良体,改良范围总长为9.27 m。 表1 工址地質參數Soil Layer Soil Type and Classification Soil Properties Topsoil and Sublayer 6 Silty clay
(CL/ML) N = 1-6, w = 23-28%, e = 0.6-0.8
Sublayer 5 Silty sand
(SM)
N = 6-16, w = 18-30%,e = 0.5-0.8 Gs = 2.71-2.75,k = 5.0x10⁻⁴ cm/sec
Sublayer 4 Silty clay
(CL)
N = 6-10, w = 18-45% ,e = 0.6-1.2, wL = 42-49
wp = 22-27, Gs = 2.74 , k = 1.0x10⁻⁶ cm/sec
Sublayer 3 Silty sand or sandy silt (SM)
N = 13-35,w = 15-28% , e = 0.4-0.8 Gs = 2.70-2.74 , k = 1.0x10⁻⁴ cm/sec
Sublayer 2 Silty clay
(CL)
N = 20-22, w = 34% , e = 0.83, wL = 40-45
wp = 13-16, Gs = 2.71-2.74
Sublayer 1 Silty sand or sandy silt (SM/ML)
N = 22-46, w = 21-28% , e = 0.4-0.8 Gs = 2.70-2.74 k = 2.5x10⁻⁴ cm/sec
Sublayer 1A Clayey silt
(CL) k =6.5x10 -6 cm/sec 圖3 通風井到達段地盤改良 Additional CJG ( 1.8 m ) Inner Wall Diaphragm Wall Ventilation Shaft A Additional CW1 Grouting Down -Track Tunnel Up -Track Tunnel CJG ( 1.8 m ) 0 5 m Scale
方永壽等:台北捷运板桥线 CP262 标通风井破镜工程意外事故与复旧 为确保改良体的施工质量,于施工期间及完成后,均进行各项检验措施,以验证其改良 效果,检验项目包括施 工中灌浆管垂直精度、施工完成后无围压缩强度与现场透水试验等, 试验结果均合乎规范要求。 2.到达段镜面试水及止水作业 在完成上、下行隧道到达段的地盘改良作业后,为确认止水效果,需分阶段进行镜面试 水。镜面试水作业系于镜面各处施以水平方向钻孔,钻入改良区内预定深度后,打开各钻孔 阀门,观察是否发生漏水现象。 当上行隧道镜面进行第一次试水时(钻孔仅贯穿连续壁),最大出水量为70 l/min,并含有 少量砂。经分析认定,应是连续壁与CJG地盘改良体的界面产生隙缝所造成,故随后于该处 进行OH灌浆。灌浆完成后再进行第二次试水,钻孔深入改良体内3.1 m,结果发现仍有漏水 现象,最大流量增为170 l/min,经研商后,承商于原CJG改良体与通风井连续壁交界处,再 增设一排CJG改良桩,完工后,并进行第三及第四次试水,此时不再有漏水现象发生。 3.盾尾间隙止水灌浆作业 在潜盾机掘进至到达段的地盘改良区前方,为防止当潜盾机逐渐进入地盘改良区内时, 地下水随着潜盾机的盾尾间隙(15 mm)渗入改良区内,故除了进行背填灌浆外,亦利用潜盾 机内部所装设的灌浆孔,注入CWl药液材料,二次填充潜盾机的盾尾间隙。此外,在潜盾机 进入地盘改良区后,为防止 潜盾机的背填灌浆区与CJG地盘改良区界面处形成孔隙,另再分 数次实施CW1药液灌浆,以填塞两者的界面孔隙。为能完全封住潜盾机后方水路,潜盾机到 达镜面前方时,亦于已组装完成的环片,自背填灌浆孔实施背填灌浆及CWl药液灌浆。 在各项止水措施完成及试水确认后,承商即进行连续壁到达端镜面的破除及相关试水作 业。本工程的镜面破除作业分二阶段施作,第一阶段于潜盾机到达连续壁前停机后进行,因 此时改良体已受潜盾机刮削及挤压等扰动,为确认改良体的止水效果,故需再次试水。 在确 认已无漏水状况后,先破除连续壁厚度的2/3(0.8 m)。于进行第二阶段的连续壁破除作业前(即 破除连续壁剩余1/3厚度,0.4 m),因改良体已受第一阶段连续壁破除作业时的震动所扰动, 故需再次进行试水确认止水效果,试水作业如此繁复,充分反映镜面破除的危险性。