©2009
Landes
Bioscience.
Do
not
distribute.
Platonin is a photosensitizer used for photodynamic therapy. In this study, we tested the effect of platonin on human leukemic cells. Treatment with platonin in the dark markedly reduced cell membrane integrity, and induced significant G0/G1 arrest of a panel of human leukemic cell lines, including U937, HL-60, K562, NB4 and THP-1. Development of hypodiploid cells was not evident in these cell lines within 24 h, but was noted in U937, HL-60 and NB4 cells after 24 h. No myeloid differentiation of these cells was noted after five-day treatment. Intriguingly, exposure of monoblastic U937 cells to platonin caused changes characteristic of autophagy, including appearance of cytoplasmic membranous vacuoles and formation of acidic vesicular organelles (AVO) in more than 95% of cells. The platonin-induced autophagy was accompa-nied by localization of microtubule-associated protein 1 light chain 3 to autophagosomes. Pretreatment with pancaspase inhibitor Z-VAD-fmk abrogated the platonin-induced hypodiploidity, but had no effect on growth inhibition and formation of AVO, indicating a caspase-independent autophagy-associated cell death. Pretreatment of cells with 3-methyladenine attenuated platonin-mediated growth inhibition and formation of AVO. Platonin augmented the expres-sion of BNIP3 in both U937 and K562 cells, whereas had an opposite effect on phosphorylation of mTOR downstream molecule p70S6K. Platonin, at the condition inducing autophagy, induced the mitochondrial membrane permeation. These results suggest that the platonin is capable of inhibiting growth as well as inducing cell death, mainly autophagy-associated, in leukemic cells via a mitochondria-mediated and caspase-independent pathway. A markedly less viability inhibition was noted to human monocytes, the normal counterpart of these myeloid leukemic cells. Platonin, other than a photodynamic agent, may offer significant promise as a therapeutic agent against leukemia.
Introduction
The photosensitizing dye platonin (a trithiazole pentamethine cyanine) is an inhibitor of nuclear factor-κB (NFκB) with various pharmacological and immunomodulatory activities. When platonin was administered to mice, peritoneal macrophages exhibited greatly enhanced Fc receptor-mediated phagocytic and superoxide-gener-ating capacities.1 It was reported that platonin suppressed the
immunoglobulin production of human peripheral blood lympho-cytes stimulated by Staphylococcus aureus Cowan I or pokeweed mitogen.2 In rats, platonin promoted recovery from delayed bone
healing induced by dexamethasone, although this was only achieved in combination with other agents.3 In both in vitro work and animal
models, we have demonstrated an inhibitory effect of platonin on NFκB activation and thereby reduced pyrogen expression in endo-toxemia-induced fever.4-7 Our in vitro study also shows that platonin
modulated differentiation and maturation of human dendritic cells toward a tolerogenic phenotype.8 Clearly, growing evidence
demon-strates that platonin possesses NFκB inhibitory activity and may modulate NFκB-mediated bioactivities, including cell viability and differentiation.
Besides NFκB inhibitory activity, platonin exhibits broad phar-macological effects on radical-scavenging,9 remission of juvenile
rheumatoid arthritis10 and polyarteritis nodosa.11 It has also been
reported that a needle-type immunotherapeutic system incorporating laser light and platonin in combination with ethanol injection can inhibit cancer growth in murine deep-seated organs.12
NFκB has been reported activated in various types of cancer cells13-15 and involved in the processing of apoptosis and autophagy.
In apoptosis (type I programmed cell death), NFκB suppressed the apoptosis of cancer cells after treatments with TNFα,16 whereas
inhibition of NFκB potentiated therapy-induced apoptosis.17 In
Ewing sarcoma cells, NFκB activation inhibited the TNFα-induced autophagic cell death (type II programmed cell death).18,19 Taken
together, inhibition of NFκB might be a promising therapy, as primary or adjuvant, against cancer.
To test the hypothesis that an NFκB inhibitor like platonin may induce death of cancer cells, we performed preliminary experiments
Research Paper
Platonin induces autophagy-associated cell death
in human leukemia cells
Yu-Jen Chen,1,2,7 Wei-Pang Huang,5 Yuh-Cheng Yang,2,3,8 Chin-Pin Lin,2 Seu-Hwa Chen,6 Ming-Ling Hsu,2 Yu-Ju Tseng,2
Hui-Ru Shieh,2 Yu-Yawn Chen9 and Jie-Jen Lee4,10,*
1Department of Radiation Oncology; 2Department of Medical Research; 3Department of Gynecology and Obstetrics; and 4Division of General Surgery; Department of Surgery;
Mackay Memorial Hospital; Taipei Taiwan; 5Department of Life Science and Institute of Zoology; National Taiwan University; Taipei, Taiwan; 6Department of Pharmacology; Taipei
Medical University; Taipei, Taiwan; 7Graduate Institute of Sport Coaching Science; Chinese Culture University; Taipei, Taiwan; 8Mackay Medicine; Nursing and Management
College; Taipei, Taiwan; 9Department and Graduate School of Physical Education; National Taiwan College of Physical Education; Taichung, Taiwan; 10Graduate Institute of
Pharmacology; Taipei Medical University; Taipei, Taiwan
Key words: platonin, leukemia, autophagy, BNIP3, caspase
*Correspondence to: Jie-Jen Lee; Department of Surgery; Mackay Memorial Hospital; 92 Chung San North Road; Section 2; Taipei 104 Taiwan; Tel.: +886.2.28094661; Fax: +886.2.28096180; Email: [email protected]
Submitted: 02/21/08; Revised: 10/20/08; Accepted: 11/06/08 Previously published online as an Autophagy E-publication: http://www.landesbioscience.com/journals/autophagy/article/7360
©2009
Landes
Bioscience.
Do
not
distribute.
undergoing apoptosis, was not evident in all the tested cell lines after 24 h of treatment. In U937, HL-60 and NB4 cells, it shows evident hypodiploid changes at 48 h (Table 1).
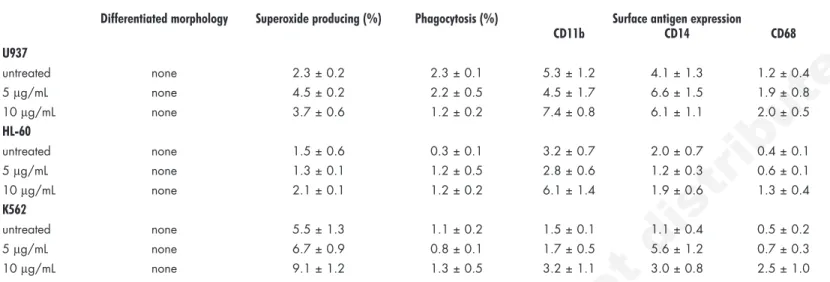
Platonin did not induce differentiation of leukemia cells. Since
cells arrested at G0/G1 phase accompanied by growth inhibition, especially in leukemia cells, may proceed to differentiation, we next examined the possible effect of platonin on cell differentiation. As shown in Table 2, no myeloid differentiation of leukemic cells was noted in terms of morphological changes, cytoplasmic superoxide production, phagocytotic ability and surface antigen expression (CD11b, CD14 and CD68) after 5-day treatment. In our previous studies on inducing differentiation of leukemic cell lines, this sustained period of time is indeed a maximal time for maintenance of drug level and exponential growth of cells.20,21
12-O-tetradecanoylphorbol-13-acetate (TPA), a differentiation inducer stimulating monocyte/ macrophage lineage development, was used as a positive control for validating this experiment. A population of U937 cells treated with TPA showed evidence of monocyte differentiation, including morpho-logical changes, 85.4% of cells with NBT reduction activity, 46.8% of cells with phagocytosed yeast cells, 89.8% of cells expressing surface CD11b marker, 81.6% of cells being CD14-positive, and 52.7% of cells with CD68 marker (data not shown). These results indicate that platonin did not induce differentiation of leukemia cells.
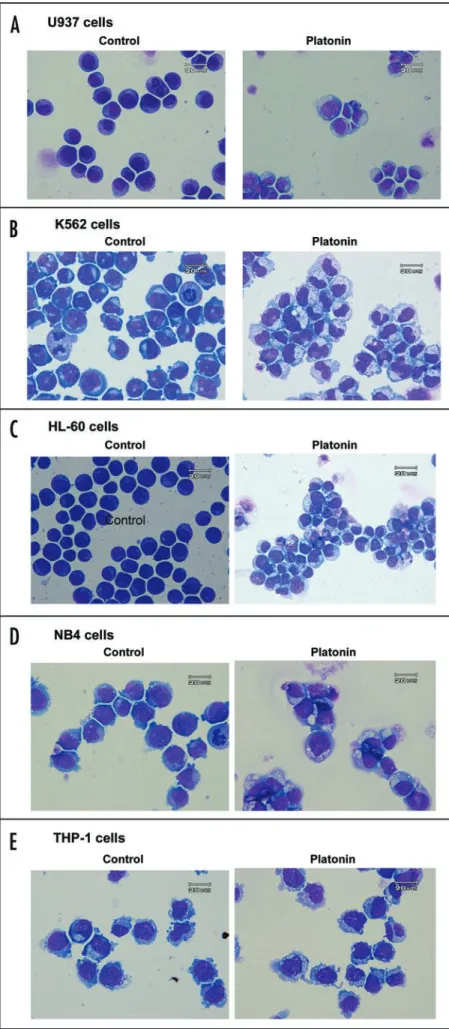
Platonin induced autophagy in leukemia cells. By observation
under a light microscope, all five leukemic cell lines treated with and found that platonin inhibited the DNA-binding activity of
NFκB (data not shown) and inhibited the growth of various human leukemia cell lines accompanied by development of extensive cyto-plasmic vacuoles, which could be seen even under a light microscope. In this study we tried to clarify the mode of cell death induced by platonin in leukemia cells and to investigate the possible mechanism. Our data show that platonin inhibited the growth of all five human leukemia cell lines and strongly induced autophagy-associated cell death via a mechanism involving mitochondrial dysfunction, activa-tion of BNIP3, but not regulaactiva-tion of p70S6K phosphorylaactiva-tion, one of the mTOR downstream molecules.
Results
Platonin reduced cytoplasmic membrane integrity and affected cell cycle distribution of human leukemia cell lines. To analyze
the effect of platonin on human leukemia cells, we first examined the cytoplasmic membrane integrity and cell cycle distribution. Treatment with platonin (5–10 μg/mL for 1–3 days) markedly reduced cytoplasmic membrane integrity of a panel of human leukemic cell lines, including U937, HL-60, K562, NB4 and THP-1, in a dose- and time-dependent manner (Table 1).
In cell cycle analysis, platonin resulted in a significant G0/G1 phase arrest in all five leukemic cell lines. The percentage of cells at G0/G1 phase increased approximately 2- to 2.5-fold in treated cells (Table 1). Development of hypodiploid cells, a character of cells
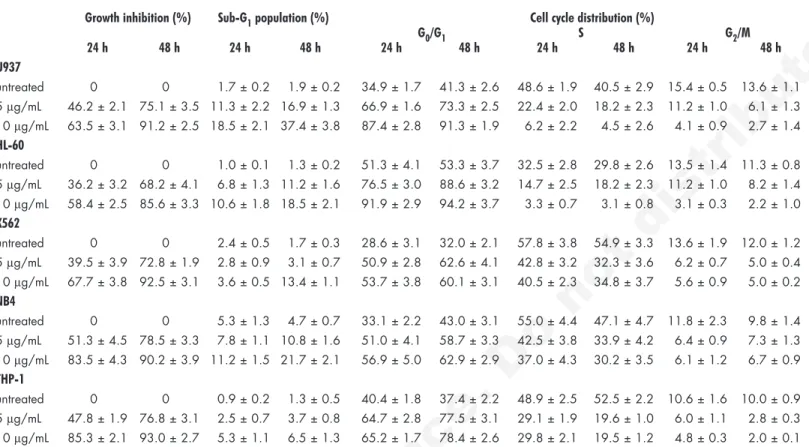
Table 1 Effect of platonin on cytoplasmic membrane integrity, hypodiploid population and cell cycle distribution in
human leukemic cell lines
Growth inhibition (%) Sub-G1 population (%) Cell cycle distribution (%)
G0/G1 S G2/M 24 h 48 h 24 h 48 h 24 h 48 h 24 h 48 h 24 h 48 h U937 untreated 0 0 1.7 ± 0.2 1.9 ± 0.2 34.9 ± 1.7 41.3 ± 2.6 48.6 ± 1.9 40.5 ± 2.9 15.4 ± 0.5 13.6 ± 1.1 5 μg/mL 46.2 ± 2.1 75.1 ± 3.5 11.3 ± 2.2 16.9 ± 1.3 66.9 ± 1.6 73.3 ± 2.5 22.4 ± 2.0 18.2 ± 2.3 11.2 ± 1.0 6.1 ± 1.3 10 μg/mL 63.5 ± 3.1 91.2 ± 2.5 18.5 ± 2.1 37.4 ± 3.8 87.4 ± 2.8 91.3 ± 1.9 6.2 ± 2.2 4.5 ± 2.6 4.1 ± 0.9 2.7 ± 1.4 HL-60 untreated 0 0 1.0 ± 0.1 1.3 ± 0.2 51.3 ± 4.1 53.3 ± 3.7 32.5 ± 2.8 29.8 ± 2.6 13.5 ± 1.4 11.3 ± 0.8 5 μg/mL 36.2 ± 3.2 68.2 ± 4.1 6.8 ± 1.3 11.2 ± 1.6 76.5 ± 3.0 88.6 ± 3.2 14.7 ± 2.5 18.2 ± 2.3 11.2 ± 1.0 8.2 ± 1.4 10 μg/mL 58.4 ± 2.5 85.6 ± 3.3 10.6 ± 1.8 18.5 ± 2.1 91.9 ± 2.9 94.2 ± 3.7 3.3 ± 0.7 3.1 ± 0.8 3.1 ± 0.3 2.2 ± 1.0 K562 untreated 0 0 2.4 ± 0.5 1.7 ± 0.3 28.6 ± 3.1 32.0 ± 2.1 57.8 ± 3.8 54.9 ± 3.3 13.6 ± 1.9 12.0 ± 1.2 5 μg/mL 39.5 ± 3.9 72.8 ± 1.9 2.8 ± 0.9 3.1 ± 0.7 50.9 ± 2.8 62.6 ± 4.1 42.8 ± 3.2 32.3 ± 3.6 6.2 ± 0.7 5.0 ± 0.4 10 μg/mL 67.7 ± 3.8 92.5 ± 3.1 3.6 ± 0.5 13.4 ± 1.1 53.7 ± 3.8 60.1 ± 3.1 40.5 ± 2.3 34.8 ± 3.7 5.6 ± 0.9 5.0 ± 0.2 NB4 untreated 0 0 5.3 ± 1.3 4.7 ± 0.7 33.1 ± 2.2 43.0 ± 3.1 55.0 ± 4.4 47.1 ± 4.7 11.8 ± 2.3 9.8 ± 1.4 5 μg/mL 51.3 ± 4.5 78.5 ± 3.3 7.8 ± 1.1 10.8 ± 1.6 51.0 ± 4.1 58.7 ± 3.3 42.5 ± 3.8 33.9 ± 4.2 6.4 ± 0.9 7.3 ± 1.3 10 μg/mL 83.5 ± 4.3 90.2 ± 3.9 11.2 ± 1.5 21.7 ± 2.1 56.9 ± 5.0 62.9 ± 2.9 37.0 ± 4.3 30.2 ± 3.5 6.1 ± 1.2 6.7 ± 0.9 THP-1 untreated 0 0 0.9 ± 0.2 1.3 ± 0.5 40.4 ± 1.8 37.4 ± 2.2 48.9 ± 2.5 52.5 ± 2.2 10.6 ± 1.6 10.0 ± 0.9 5 μg/mL 47.8 ± 1.9 76.8 ± 3.1 2.5 ± 0.7 3.7 ± 0.8 64.7 ± 2.8 77.5 ± 3.1 29.1 ± 1.9 19.6 ± 1.0 6.0 ± 1.1 2.8 ± 0.3 10 μg/mL 85.3 ± 2.1 93.0 ± 2.7 5.3 ± 1.1 6.5 ± 1.3 65.2 ± 1.7 78.4 ± 2.6 29.8 ± 2.1 19.5 ± 1.2 4.8 ± 0.3 2.0 ± 0.1 After treatment with platonin (0–10 μg/mL) for 24 or 48 h, cells were harvested and the numbers of cells with intact cytoplasmic membrane were counted by using the trypan blue dye exclusion test and growth inhibition rates were estimated in comparison with untreated controls. Simultaneously, cell cycle distribution was analyzed by measuring the DNA content with propidium iodine staining. Data from 3 separate experiments are expressed as mean ± SEM.
©2009
Landes
Bioscience.
Do
not
distribute.
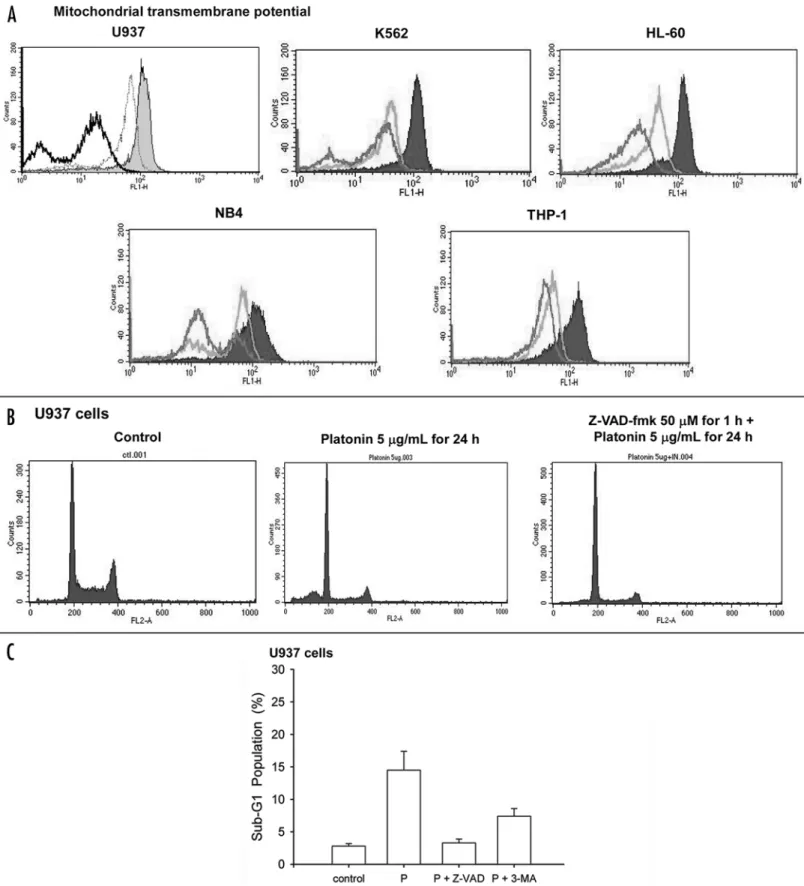
that platonin treatment stimulated abnormal mitochondrial struc-tures. Whether mitochondrial function was compromised by platonin was next examined. Platonin, at the condition inducing autophagy, caused mitochondrial membrane permeabilization characterized by reduction of relative mitochondrial transmembrane potential down to less than 30% of that of untreated control cells in all five tested leukemia cell lines (Fig. 5A). Pretreatment of pancaspase inhibitor Z-VAD-fmk abrogated the platonin-induced hypodiploidity of cells (Fig. 5B and C), but had no effect on cytoplasmic membrane integrity (Fig. 6A) and the formation of acidic vesicular compart-ment (Fig. 6C), indicating a caspase-independent autophagic cell death. Morevoer, 3-methyladenine could inhibit platonin-induced apoptosis to a lesser extent than that of caspase inhibitor zVAD (Fig. 5C).
To evaluate the mitochondrial degradation during platonin-induced autophagy, we further measured CMXRos retention for mitochondrial membrane potential and MitoTracker Green for mitochondrial mass. The results show that cyclosporin A mark-edly increased the mitochondrial membrane potential (122.7% of controls), but not the mitochondrial mass. Platonin reduced both mitochondrial membrane potential (51.3% of controls) and mito-chondrial mass (83.5% of controls). Pretreatment with cyclosporine A partially blocked the platonin-reduced mitochondrial membrane potential (63.2% of controls), but not that of mitochondrial mass (86.1% of controls). It seems that mitochondria might be the targets for autophagic degradation after platonin treatment. The accom-panying decrease in mitochondrial membrane potential might be related to permeability of mitochondrial transition pore.
Autophagy and growth inhibition in platonin-treated cells. To
address the issue of whether induction of autophagy influences cell death caused by platonin, the effect of 3-MA, which inhibits the sequestration of autophagy process,23 was tested. As shown in Figure
6, pretreatment of cells with 3-MA attenuated platonin-mediated reduction of cytoplasmic membrane integrity, suppression of clono-genicity, and the formation of acidic vesicular compartment. Trypan blue exclusion test measures cytoplasmic membrane integrity, not platonin (10 μg/mL for 24 h) showed abundant cytoplasmic vacuoles
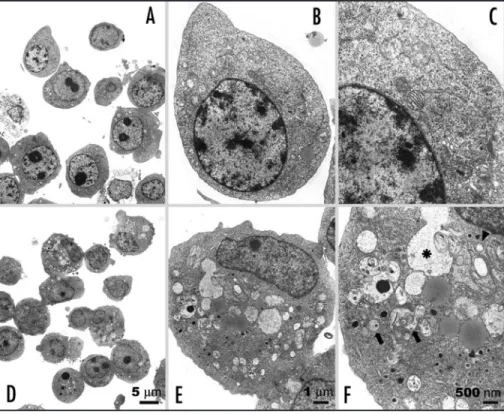
(Fig. 1). As demonstrated in Figure 2, observation under a transmis-sion electron microscope revealed that treatment of monoblastic U937 cells with platonin caused changes characteristic of autophagy, including appearance of multiple cytoplasmic vacuoles with double-layer membrane. Some vacuoles containing remnants of degraded organelles could be designated as autophagosomes. Marked swelling of mitochondria with vacuolization was observed in platonin-treated cells. Autolysosome could also be found. To further analyze this autophagy induction phenomenon, we applied quantitative methods. Formation of acidic vesicular organelles (AVO), stained by aggregated acridine orange in acidic compartments, was examined by flow cytometry to confirm and quantify the development of autophagy in leukemia cells. Intriguingly, platonin induced the percentage of acri-dine orange-accumulated cells up to more than 95% of U937 cells in a dose-dependent manner (Fig. 3A and B). Exposure of HL-60, NB4 and THP-1 cells to platonin also caused formation of AVO in more than 95% of cells (Fig. 3A). Observation under fluorescence microscopy showed accumulation of intense acridine orange puncta in cytoplasm of platonin-treated cells (Fig. 3C). To further provide evidence that autophagosomes, a key feature of autophagy, developed after exposure to platonin, we generated transient transfectants of U937 and K562 cells expressing GFP-LC3. Microtubule-associated protein 1 light chain 3 (LC3) is the mammalian homologue of yeast autophagy protein Atg8, which redistributes to autophagosome membrane when autophagy is induced.22 By examining under
fluo-rescence microscopy, we observed that GFP-LC3 diffusely expressed in untreated cells and relocated to a punctate distribution pattern in platonin-treated cells (Fig. 4A and B), indicating involvement of LC3 and development of autophagosomes during platonin treat-ment. This GFP-LC3 labeling assay was also validated by inducing autophagy by 6-h starvation of K562 cells (Fig. 4B). Figure 4C demonstrates that both platonin and starvation induced a conversion of LC3-I to LC3-II in U937 cells by using western blot analysis.
Platonin induced autophagy via a mitochondria-mediated and caspase-independent pathway. Our electron micrographs revealed
Table 2 Effect of platonin on differentiation of human leukemic cell lines
Differentiated morphology Superoxide producing (%) Phagocytosis (%) Surface antigen expression
CD11b CD14 CD68 U937 untreated none 2.3 ± 0.2 2.3 ± 0.1 5.3 ± 1.2 4.1 ± 1.3 1.2 ± 0.4 5 μg/mL none 4.5 ± 0.2 2.2 ± 0.5 4.5 ± 1.7 6.6 ± 1.5 1.9 ± 0.8 10 μg/mL none 3.7 ± 0.6 1.2 ± 0.2 7.4 ± 0.8 6.1 ± 1.1 2.0 ± 0.5 HL-60 untreated none 1.5 ± 0.6 0.3 ± 0.1 3.2 ± 0.7 2.0 ± 0.7 0.4 ± 0.1 5 μg/mL none 1.3 ± 0.1 1.2 ± 0.5 2.8 ± 0.6 1.2 ± 0.3 0.6 ± 0.1 10 μg/mL none 2.1 ± 0.1 1.2 ± 0.2 6.1 ± 1.4 1.9 ± 0.6 1.3 ± 0.4 K562 untreated none 5.5 ± 1.3 1.1 ± 0.2 1.5 ± 0.1 1.1 ± 0.4 0.5 ± 0.2 5 μg/mL none 6.7 ± 0.9 0.8 ± 0.1 1.7 ± 0.5 5.6 ± 1.2 0.7 ± 0.3 10 μg/mL none 9.1 ± 1.2 1.3 ± 0.5 3.2 ± 1.1 3.0 ± 0.8 2.5 ± 1.0
After treatment with platonin (0–10 μg/mL) for 5 days, cells were harvested and subjected to assessment for morphological changes, superoxide production, phagocytotic ability, and surface antigen expression. Data from 3 separate experiments are expressed as mean ± SEM.
©2009
Landes
Bioscience.
Do
not
distribute.
Figure 1. Morphological changes of leukemic cells. (A) U937; (B) K562; (C) HL-60; (D) NB4; (E) THP-1 cells. Left, untreated cells;
right, cells treated with 10 μg/mL platonin for 24 h. Cells were
collected, stained with toluidine blue, and photographed under a light microscope.
viability, whereas the clonogenic assay is used to determine cell viability. In these experiments, the data of cytoplasmic membrane integrity and clonogenicity are in general agree-ment. These results indicate that autophagy might, at least partly, contribute to platonin-induced growth inhibition and proliferation. By using trypan blue exclusion test and clonogenic assay, 3-MA at 20 mM per se slightly reduced the cytoplasmic membrane integrity (8.6% inhibition) and formation of colony (11.3% inhibition) in U937 cells.
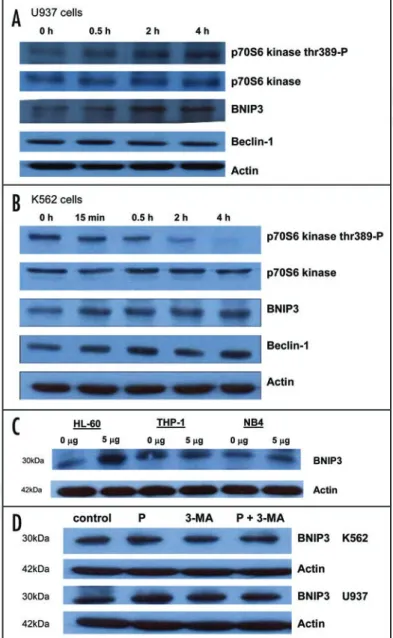
Molecules involved in platonin-induced autophagy.
To get insights into the mechanism of platonin-induced autophagy, we examined the expression of regulatory molecules involved in this type of cell death. As demon-strated in Figure 7A–C, platonin augmented the expression of BNIP3 in U937, K562, HL-60 and NB4 cells, but was unchanged in THP-1 cells. To elucidate the correlation between autophagy development and BNIP3 expression in platonin-treated cells, we performed western blotting with pretreatment with autophagy inhibitor 3-MA. The data demonstrated that pretreatment with 3-MA, at the condition blocking autophagy, reversed the platonin-induced upregulation of BNIP3 expression in both K562 and U937 cells (Fig. 7D). Expression of Beclin 1 remained largely unchanged in U937 and was moderately upregu-lated in K562 cells (Fig. 7A and B). The phosphorylation of mTOR downstream molecule p70S6K was augmented in U937 cells but, in contrast, attenuated in K562 cells (Fig. 7A and B). These opposite effects between U937 and K562 cells suggest that the mTOR pathway may not be critical to regulation of platonin-induced autophagy.
Time sequence for events related to platonin-induced cell death. As demonstrated in Figure 7, the BNIP3 was
upregulated at 30 min upon treatment with platonin (Fig. 7) in U937 cells. Compared with untreated controls, the mitochondrial membrane potential was significantly reduced at 30 min (81.3 ± 3.6%), but not 15 min (95.7 ± 4.1%). With regard to the formation of acidic vesicular organelles, the percentage of acridine orange-accumu-lated cells began to markedly increase at 8 h (27.4 ± 2.9%), but not 15 min, 30 min or 2 h. For estimation of apoptotic amount, the DNA histogram shows an evident hypodiploid change (35.7 ± 4.5% of sub-G1 population) since 48 h of platonin treatment. Collectively, it suggests that the underlying mechanism of platonin-induced autophagy might be upregulation of BNIP3, reduction of mitochondrial membrane potential and then forma-tion of acidic vesicular organelles. The timepoint for development of apoptosis is relatively far from that of autophagy-related events.
Inhibition of viability and induction of cytoplasmic vacuoles in normal human monocytes. To examine the
©2009
Landes
Bioscience.
Do
not
distribute.
prostate cancer cells,26 we examined the effect
of platonin on phosphorylation of the mTOR downstream molecule p70S6K. Treatment with platonin increased phosphorylated p70S6K in U937 cells, while it was decreased in K562 cells. This opposite effect suggests that the mTOR pathway may not be essential to platonin-induced autophagy regulation in leukemic cells.
Current data presented in this study were mainly from measuring the steady state of autophagy. Whether platonin affects autophagic flux remains to be clarified by assessing the delivery of cargo to lysosomes and resultant degradation as well as recycling of cellular components.
Yu et al., demonstrated that exposure of mouse L929 fibroblastic cells and human leukemic U937 cells to caspase inhibitor zVAD can lead to cell death with features of autophagy.27 Our
data showed that zVAD inhibited growth of U937 cells and blocked platonin-induced apop-tosis without affecting growth inhibitory effect of platonin. However, it seems consistent that caspase inhibitor zVAD per se can inhibit growth of U937 cells. To our knowledge, our work is the first report demonstrating that zVAD has no blocking effect on drug-induced autophagy in leukemic cells.
According to several investigations, the devel-opment of apoptosis and autophagy seems to be an interchangeable or interactive process. For example, apoptosis induced by calpain inhibitor decreased oridonin-induced autophagy, Beclin 1 activation, and the conversion from LC3-I to LC3-II, whereas inhibition of autophagy by 3-MA increased oridonin-induced apoptosis in L929 cells.28
In human prostate cancer PC-3 and LNCaP cells, induction of autophagy represents a defense mechanism against sulforaphane-induced apoptosis.29 With regard to the crosstalk between apoptosis
and autophagy, we pretreated cells with either caspase inhibitor zVAD or autophagy inhibitor 3-MA to clarify the interaction between these two modes of cell death induced by platonin.
The mechanism of G0/G1 cell cycle arrest by platonin and its relationship to autophagy induction remains to be elucidated. The known inducers of autophagy have distinct effects on cell cycle distribution. As2O3 and curcumin arrested malignant glioma cells at G2/M phase and induced autophagic cell death.30,31 Onconase
caused G1 phase block and induced caspase-independent autophagic cell death in neuroblastoma cells.32 Autophagy of nonsmall cell lung
cancer NCI-H460 cells induced by nanosized neodymium oxide was accompanied by S-phase cell cycle arrest.33 Collectively,
develop-ment of autophagy by drug treatdevelop-ment may not be a cell cycle-specific event.
In conclusion, platonin is capable of inhibiting growth as well as inducing extensive autophagy-associated cell death in leukemic cells via a BNIP3-associated, mitochondrium-mediated and caspase-independent pathway. Platonin may offer significant promise as a therapeutic agent against leukemia via a unique mechanism of action distinct from apoptosis and differentiation.
these myeloid leukemic cells, we isolated CD14+ monocytes from
human peripheral blood mononuclear cells for evaluation. Platonin, at a concentration toxic to leukemic cells (5 and 10 μg/mL), exhib-ited a slight to moderate inhibitory effect on cytoplasmic membrane integrity (17.7% and 29.8% inhibition to monocytes, respectively). No evident increase in cytoplasmic vacuoles was noted after platonin treatment.
Discussion
The results of this study showed that platonin reduced cytoplasmic membrane integrity, arrested cell cycle at G1 phase, and induced extensive autophagy in human leukemic cells. This autophagic event involved mitochondrial membrane permeation, upregulation of BNIP3, and was independent of caspases. It also indicates that platonin preferentially inhibited the viability of myeloid leukemic cells without marked toxicity to normal counterpart monocytes.
The present study demonstrated that platonin augmented the expression of BNIP3 in monoblastic leukemia U937 and CML K562 cells. BNIP3, a BH3-only BCL-2 family protein, has been reported upregulated in malignant glioma cells that were undergoing As2O3- and ceramide-induced autophagy in accordance with our finding. Since platonin induced mitochondrial membrane permeabilization, a phenomenon correlated to BNIP3-mediated autophagic cell death,24
it suggests that BNIP3 is involved in platonin-induced autophagy. Given that mTOR negatively regulates autophagy via the mTOR/ p70S6K pathway in cancer cells such as malignant glioma25 and
Figure 2. TEM microphotographs showing the ultrastructure of 10 μg/mL platonin-treated U937 leukemic cells. (A–C) controls. Few cytoplasmic vacuoles with monolayer membrane were observed in untreated U937 cells. Mitochondria were intact with normal size in cytoplasm. (D–F) U937 cells treated with 10 μg/mL platonin for 24 h. Numerous autophagical vacuoles with typical double-layer membrane containing organelle remnants were noted (arrows). Enlarged mitochon-dria with vacuolization were observed (arrowheads). An autolysosome was demonstrated (*). Bar, 5 μm in (A and D); 1 μm in (B and E); 500 nm in (C and F).
©2009
Landes
Bioscience.
Do
not
©2009
Landes
Bioscience.
Do
not
distribute.
Co. (Tainan, Taiwan), and dissolved in PBS as a stock solution (0.5 mg/mL). To avoid interference by platonin’s photosensitizing effect, all culture and treatment procedures were performed under light-avoidance conditions.
Isolation of normal human monocytes. Human
peripheral blood mononuclear cells were obtained from healthy donors using Histopaque (Amersham Pharmacia Biotech, Piscataway, New Jersey) density gradient centrifugation. Erythrocytes were removed by lysis with 0.9% ammonium chloride for 3 min at 37°C. Subsequently, CD14+ cells
were purified by high-gradient magnetic sorting using the miniMACS system with anti-CD14 microbeads (Miltenyi Biotec, Bergisch Bladbach, Germany). The purity of monocytes was assessed by over 90% expression of CD14+ on flow
cyto-metric analysis.
Cytoplasmic membrane integrity. The
numbers of viable cells were counted on day 5 using the trypan blue dye exclusion test. Adherent and nonadherent cells in day 5 cultures were collected by gently rubbing the dishes with a rubber policeman (Bellco Glass, Vineland, New Jersey).
Colony formation assay. Viable tumor cells
(103) were plated into each 35-mm culture dish
and allowed to grow in McCoy’s 5A medium containing 20% heat-inactivated FCS and 0.24% agarose at 37°C in a humidified 5% CO2 incu-bator. After 10 to 14 days, the dishes were stained with 0.4% crystal violet and colonies containing ≥50 cells were counted.
Cell cycle analysis by flow cytometry. After
treatment, cells were harvested and fixed with 70% ethanol at 4°C for 1 h. The cells were stained for 30 min with propidium iodide solution (propidium iodide, 0.5 mg/mL; RNAse, 0.1 mg/mL) using the CycleTEST PLUS DNA reagent kit (Becton Dickinson, Lincoln Park, New Jersey). Analysis of the DNA content was performed using a FACScaliber flow cytometer (Becton Dickinson). The data from 104 cells were collected and analyzed using ModFit software (Becton
Dickinson).
Assay for superoxide production. The production of cytoplasmic
superoxide by differentiated myeloid cells was detected by the nitroblue tetrazolium (NBT) reduction test. Cells collected from day 5 cultures were suspended in RPMI 1640 medium at a density of 1 x 10⁶ cells/mL and incubated for 30 minutes at 37°C with an
equal volume of NBT test stock solution, which contained 2 mg/ mL of NBT and 1 μmole of phorbol myristate acetate in phosphate-buffered saline (PBS). Cytospin preparations were counter-stained with 0.5% Safranin O. The percentage of formazan-containing cells (out of 200 cells) was assessed microscopically.
Materials and Methods
Culture of leukemic cells and treatment. The human cell lines,
including monoblastoid leukemic U937, acute myeloid leukemic HL-60, acute promyelocytic leukemic NB4, chronic myeloid leukemic K562, and monocytic leukemic THP-1, were obtained from the American Type Culture Collection (Rockville, Maryland). Cells were cultured in RPMI 1640 medium containing 10% FCS and maintained in an exponential growth state. For assay of cell growth and differentiation, cells were incubated in 35 mm petri dishes at an initial density of 1 x 10⁵ cells/mL in the presence of various
concentrations of platonin (0, 1.25, 2.5, 5 and 10 μg/mL). Platonin, 4,4',4''-trimethyl-3,3',3''-trihepthyl-7-(2''-thiazoyl)-2,2'-trimethine-thiazolocyanine-3,3''-diiodide, was was synthesized by Kankohsha Co. (Osaka, Japan) and purchased from Gwo Chyang Pharmaceutical
Figure 3 (See previous page). Detection of acidic vesicular organelles (AVO) in U937 cells. Cells treated with platonin (1–10 μg/mL for 24 h) were stained with acridine orange (10 ng/mL) for 15 min and subjected to flow cytometry for quantification and fluorescence microscopy for observation. (A) represen-tative flow cytometry data showing the acridine orange fluorescent intersities; (B) plot showing the statistical analysis from three independent experiments. Data from 3 to 5 separate experiments are expressed as mean ± SEM. (C) Micrographs taken under fluorescence microscopy with magnification 400x. Left, control; right, platonin (10 μg/mL for 24 h)-treated.
Figure 4. Visualization of LC3 aggregation and immunoblot analysis in leukemic cells. The GFP-LC3 aggregation of platonin-treated cells was visualized by fluorescence microscopy. (A) U937 cells; (B) K562 cells. Left, control; Right, platonin (10 μg/mL for 24 h)-treated. (C) For immuno-blotting, K562 cells were treated with vehicle (lane 1), platonin 5 μg/mL for 24 h (lane 2) or starvation for 6 h (lane 3), platonin plus zVAD (lane 4) or zVAD (lane 5), and then subjected to immunoblot analysis using antiLC-3 antibody and antiactin antibody.
©2009
Landes
Bioscience.
Do
not
distribute.
Figure 5. Changes in mitochondrial permeation and hypodiploid population in leukemic cells. Cells treated with platonin were stained with DiOC6(3) and propidium iodine for flow cytometric analysis of mitochondria transmembrane potential and DNA content, respectively. (A) representative fluorescent figures for mitochondria transmembrane potential. Grey zone, control. Light line, 5 μg/mL platonin for 24 h. Dark line, 10 μg/mL platonin for 24 h. (B) DNA histograms of U937 cells. (C) plot showing statistical results of hypodiploid population treated with 0.1% PBS (as a vehicle control), 5 μg/mL platonin (P) for 24 h, Z-VAD-fmk 50 μM for 1 h plus 5 μg/mL platonin for 24 h., or 5 μg/mL platonin plus 3-MA 20mM for 24h. *p < 0.05. Data from 3 separate experiments are expressed as mean ± SEM.
©2009
Landes
Bioscience.
Do
not
distribute.
cells were postfixed in osmium tetroxide (1%) and embedded in Epon resine (Energy Beam Science, Agawam, Massachusetts). Semithin sections were cut, stained with 0.5% toluidine blue, and examined under a light microscope (BX51, Olympus, Tokyo, Japan). Ultrathin sections were stained with 2% uranyl acetate and Reynold’s lead citrate, and observed with a transmission electron microscope (JEM-1200EXII, JEOL Co., Tokyo, Japan).
Detection of acidic vesicular organelles with acridine orange staining. To quantify the development of acidic vesicular organelles
(AVO), we stained cells with acridine orange (10 ng/mL) for 15 min and subjected to flow cytometry. In cells stained with acridine orange, the cytoplasm and nucleoli emit green fluorescence while as the acidic compartments emit red fluorescence, which intensity is proportional to the degree of acidity. Green (510–530 nm) and red (650 nm) fluorescence emission from 104 cells illuminated with
blue excitation light (488 nm) was detected and measured by using a FACScalibur flow cytometer (Becton Dickinson) with a CellQuest software. Only a slight red fluorescence (emission at 650 nm) could be detected by platonin-treated cells without acridine orange staining. Thus, the possibility that the fluorescence of platonin could disturb the fluorescence of acridine orange has been excluded.
GFP-LC3 assay. The green fluorescent protein (GFP)-tagged
microtubule-associated protein 1 light chain 3 (LC3) expressing vector was constructed by subcloning LC3 coding sequence from pGST-LC3 plasmid (kindly provided by Dr. Tamotsu Yoshimori) to pEGFP-C1 vector (Clontech). Cells were transiently transfected with GFP-LC3 vector by using an extrapolator (LipofectamineTM2000,
Assays for phagocytosis. The phagocytic activity was measured
according to the previously published methods.18-34 Briefly, a
heat-inactivated yeast suspension was prepared by suspending yeast in PBS at a density of 1 x 10⁸ cells/mL in stock. The cells collected
from day 5 cultures were washed, re-suspended (1 x 10⁶ cells/mL) in
FCS-containing RPMI1640 medium and incubated with the yeast suspension (4 x 10⁶/mL) at 37°C for 30 min. Then the cells were
placed on a glass slide and observed under an inverted microscope (ECLIPSE TS100, Nikon, Tokyo, Japan). The percentage of yeast-containing cells was scored out of 200 cells.
Assay for differentiation antigens. An indirect
immuno-fluorescence method was employed to detect the expression of monocyte-associated antigens on the surface of leukemic cells after treatment. Cells collected from day-5 cultures were treated with primary monoclonal antibodies, washed with PBS, and then exposed to fluorescein isocyanate (FITC)-conjugated secondary antibodies, goat F(ab’)2 anti-mouse IgG (Cappel Laboratories, Cochranville, Pennsylvania). Monoclonal antibodies against human monocytes included anti-CD11b and anti-CD14 (Serotec, Oxford, England), and anti-CD68 (Dakopatts, Golstrup, Denmark). The percentage of positive cells was analyzed using a FACScan flow cytometer (Becton-Dickenson, Franklin Lakes, NJ) and a software Lysis II (Becton-Dickinson). FITC conjugated to goat antimouse IgG was used to set background thresholds.
Transmission electron microscopy. Cells were harvested by
trypsinization, washed and fixed with cold 3% glutaraldehyde in 0.11 M carcodylate buffer for 30 min. After being rinsed in PBS,
Figure 6. Effect of Z-VAD-fmk and 3-MA on cytoplas-mic membrane integrity and formation of AVO in platonin-treated leukemic cells. (A) Cytoplasmic mem-brane integrity assayed by trypan blue exclusion test; (B) Clonogenicity of leukemic cells; (C) AVO positive rates assessed by flow cytometry. Cells were treated with 0.1% PBS (as a vehicle control), 5 μg/ mL platonin (P) for 24 h, 3-MA 20 mM for 1 h plus 5 μg/mL platonin for 24 h, or Z-VAD-fmk 50 μM for 1 h plus 5 μg/mL platonin for 24 h. *p < 0.05. Data from 3 separate experi-ments are expressed as mean ± SEM.
©2009
Landes
Bioscience.
Do
not
distribute.
11. Kondo N, Motoyoshi F, Ozawa T, Orii T. A case report of a 9-year old boy with polyarteritis nodosa in which a combination therapy of corticosteroids and a photosensitive dye platonin was effective. Biotherapy 1991; 3:261-4.
12. Mito K. A needle-type immunotherapeutic system incorporating laser light and platonin in combination with ethanol injection in the treatment of cancer growing in deep organs. Front Med Biol Eng 1999; 9:275-84.
13. Bharti AC, Shishodia S, Reuben JM, Weber D, Alexanian R, Raj-Vadhan S, Estrov Z, Talpaz M, Aggarwal BB. Nuclear factor-kappaB and STAT3 are constitutively active in CD138+ cells derived from multiple myeloma patients, and suppression of these
transcrip-tion factors leads to apoptosis. Blood 2004; 103:3175-84.
14. Guzman ML, Neering SJ, Upchurch D, Grimes B, Howard DS, Rizzieri DA, Luger SM, Jordan CT. Nuclear factor-kappaB is constitutively activated in primitive human acute myelogenous leukemia cells. Blood 2001; 98:2301-7.
15. Frelin C, Imbert V, Griessinger E, Peyron AC, Rochet N, Philip P, Dageville C, Sirvent A, Hummelsberger M, Berard E, Dreano M, Sirvent N, Peyron JF. Targeting NFkappaB acti-vation via pharmacologic inhibition of IKK2-induced apoptosis of human acute myeloid leukemia cells. Blood 2005; 105:804-11.
16. Van Antwerp DJ, Martin SJ, Kafri T, Green DR, Verma IM. Suppression of TNFalpha-induced apoptosis by NFkappaB. Science 1996; 274:787-9.
Invitrogen. Carlsbad, California). After platonin treatment, cells were fixed with 4% paraformaldehyde and examined under a fluo-rescence microscope.
Mitochondrial membrane potential and mitochondrial mass.
PBS-washed U937 cells were incubated with 40 nM 3,3'-dihexy-loxacarbocyanine [DiOC6(3)] (Molecular Probes, Eugene, Oregon) for 15 min at 37°C. By using FACScalibur flow cytometer (Becton Dickinson), intensity of green fluorescence was measured to indicate the change of mitochondrial transmembrane potential with excita-tion and emission settings of 488 and 530 nm, respectively. In some experiments, we further measured CMXRos retention for mitochon-drial membrane potential and MitoTracker Green for mitochonmitochon-drial mass to evaluate the mitochondrial degradation during platonin-induced autophagy. CMXRos and MitoTracker Green were also purchased from Molecular Probes.
Western blotting. Western blot analysis was performed as
previ-ously described. Proteins were isolated from cells after treatment with 5 μg/mL platonin for 2 h. The protein concentration was determined by a bicinchoninic acid (BCA) assay kit (Pierce, Rockford, Illinois). Equal amounts of proteins (50 μg in each lane) were electrophoresed in 10% SDS-polyacrylamide gels. Then, proteins were transferred onto a nylon blotting membrane. The membrane was blocked with 5% de-fatted milk and immunoblotted with primary antibodies against various proteins (Transduction Laboratories, Lexington, Kentucky) at room temperature for 3 h. For LC3-I and LC3-II, the primary antibody was purchased from Cell Signaling Technology, Inc. (Danvers, MA). This was followed by incubation with horseradish peroxidase-labeled second antibodies (Transduction Laboratories) and development using the enhanced chemiluminescence system (Amersham Pharmacia, Piscataway, New Jersey).
Statistical analysis. The results were expressed as mean ±
stan-dard error of mean (SEM). Comparison in each experiment was performed using an unpaired Student’s t-test or one way analysis of variance as indicated, and a p value of less than 0.05 was considered to be statistically significant.
Acknowledgements
This work is supported by 94MMH-TMU-15 from Mackay Memorial Hospital, Taipei, Taiwan.
References
1. Nakagawa Y, Homma S, Yamamoto I, Banno M, Nakazato H, Imanaga H, Yamamoto N. In vivo and in vitro activation of macrophages with a cyanine photosensitizing dye, platonin. Cancer Immunol Immunother 1993; 37:157-62.
2. Kondo N, Ko H, Motoyoshi F, Orii T. B cell suppressing and CD8+ T cell enhancing effects
of photosensitive dye platonin in humans. J Rheumatol 1989; 16:936-9.
3. Nishimura S, Maruyama S, Tajima M, Kim T, Arai T, Mizuno H, Ohhara Y, Hatano M, Sato S. Effect of platonin on bone wound healing in rat calvaria—with special reference to the inter-action of platonin and steroid hormones. Nippon Yakurigaku Zasshi 1987; 89:285-90. 4. Lee JJ, Huang WT, Shao DZ, Liao JF, Lin MT. Blocking NFkappaB activation may be an
effective strategy in the fever therapy. Jpn J Physiol 2003; 53:367-75.
5. Shao DZ, Lee JJ, Huang WT, Liao JF, Lin MT. Inhibition of nuclear factor-kappaB prevents staphylococcal enterotoxin A-induced fever. Mol Cell Biochem 2004; 262:177-85. 6. Hsiao G, Lee JJ, Chou DS, Fong TH, Shen MY, Lin CH, Sheu JR. Platonin, a
photosen-sitizing dye, improves circulatory failure and mortality in rat models of endotoxemia. Biol Pharm Bull 2002; 25:995-9.
7. Lee JJ, Huang WT, Shao DZ, Liao JF, Lin MT. Platonin, a cyanine photosensitizing dye, inhibits pyrogen release and results in antipyresis. J Pharmacol Sci 2003; 93:376-80. 8. Lee JJ, Liao HF, Yang YC, Liu CL, Chen YY, Lin CP, Chen YJ. Platonin modulates
differen-tiation and maturation of human monocyte-derived dendritic cells. Int Immunopharmacol 2006; 6:287-93.
9. Ishihara M, Kadoma Y, Fujisawa S. Kinetic radical-scavenging activity of platonin, a cyanine photosensitizing dye. In Vivo 2006; 20:845-8.
10. Motoyoshi F, Kondo N, Ono H, Orii T. The effect of photosensitive dye platonin on juve-nile rheumatoid arthritis. Biotherapy 1991; 3:241-4.
Figure 7. Expression of autophagy regulatory proteins in leukemic cells. Cells were treated with 5 μg/mL platonin for 2 h and harvested for western blot analysis. (A) U937 cells; (B) K562 cells; (C) BNIP3 expression of HL-60, THP-1 and NB4 cells; (D) regulation of BNIP3 expression by 3-methyladenine (3-MA).
©2009
Landes
Bioscience.
Do
not
distribute.
17. Wang CY, Mayo MW, Baldwin AS Jr. TNF- and cancer therapy-induced apoptosis: poten-tiation by inhibition of NFkappaB. Science 1996; 274:784-7.
18. Djavaheri-Mergny M, Amelotti M, Mathieu J, Besancon F, Bauvy C, Souquere S, Pierron G, Codogno P. NFkappaB activation represses tumor necrosis factor-alpha-induced autophagy. J Biol Chem 2006; 281:30373-82.
19. Cilloni D, Martinelli G, Messa F, Baccarani M, Saglio G. Nuclear factor κB as a target for new drug development in myeloid malignancies. Haematologica 2007; 92:1224-9. 20. Liao HF, Shyu SY, Kuo YH, Yang YC, Chen YJ. Compound 278E, structurally modified
from tanshinone, induces monocytic differentiation and regulates proto-oncogene expres-sion in human leukemic HL-60 cells. Anticancer Drugs 2005; 16:175-83.
21. Liao HF, Chen YY, Yang YC, Wang CS, Chen YJ. Rice (Oryza sativa L.) inhibits growth and induces differentiation of human leukemic U937 cells through activation of peripheral blood mononuclear cells. Food Chem Toxicol 2006; 44:1724-9.
22. Kabeya Y, Mizushima N, Ueno T, Yamamoto A, Kirisako T, Noda T, Kominami E, Ohsumi Y, Yoshimori T. LC3, a mammalian homologue of yeast Apg8p, is localized in autophagosome membranes after processing. EMBO J 2000; 19:5720-8.
23. Seglen PO, Gordon PB. 3-Methyladenine: specific inhibitor of autophagic/lysosomal pro-tein degradation in isolated rat hepatocytes. Proc Natl Acad Sci USA 1982; 79:1889-92. 24. Vande VC, Cizeau J, Dubik D, Alimonti J, Brown T, Israels S, Hakem R, Greenberg AH.
BNIP3 and genetic control of necrosis-like cell death through the mitochondrial perme-ability transition pore. Mol Cell Biol 2000; 20:5454-68.
25. Takeuchi H, Kondo Y, Fujiwara K, Kanzawa T, Aoki H, Mills GB, Kondo S. Synergistic augmentation of rapamycin-induced autophagy in malignant glioma cells by phosphati-dylinositol 3-kinase/protein kinase B inhibitors. Cancer Res 2005; 65:3336-46. 26. Cao C, Subhawong T, Albert JM, Kim KW, Geng L, Sekhar KR, Gi YJ, Lu B. Inhibition
of mammalian target of rapamycin or apoptotic pathway induces autophagy and radiosen-sitizes PTEN null prostate cancer cells. Cancer Res 2006; 66:10040-7.
27. Yu L, Alva A, Su H, Dutt P, Freundt E, Welsh S, Baehrecke EH, Lenardo MJ. Regulation of an ATG7-beclin 1 program of autophagic cell death by caspase-8. Science 2004; 304:1500-2. 28. Cheng Y, Qiu F, Huang J, Tashiro S, Onodera S, Ikejima T. Apoptosis-suppressing and
autophagy-promoting effects of calpain on oridonin-induced L929 cell death. Arch Biochem Biophys 2008; 475:148-55.
29. Herman-Antosiewicz A, Johnson DE, Singh SV. Sulforaphane causes autophagy to inhibit release of cytochrome c and apoptosis in human prostate cancer cells. Cancer Res 2006; 66:5828-35.
30. Kanzawa T, Kondo Y, Ito H, Kondo S, Germano I. Induction of autophagic cell death in malignant glioma cells by arsenic trioxide. Cancer Res 2003; 63:2103-8.
31. Aoki H, Takada Y, Kondo S, Sawaya R, Aggarwal BB, Kondo Y. Evidence that curcumin suppresses the growth of malignant gliomas in vitro and in vivo through induction of autophagy: role of Akt and extracellular signal-regulated kinase signaling pathways. Mol Pharmacol 2007; 72:29-39.
32. Michaelis M, Cinatl J, Anand P, Rothweiler F, Kotchetkov R, Deimling A, Doerr HW, Shogen K, Cinatl J Jr. Onconase induces caspase-independent cell death in chemoresistant neuroblastoma cells. Cancer Lett 2007; 250:107-16.
33. Chen Y, Yang L, Feng C, Wen LP. Nano neodymium oxide induces massive vacuolization and autophagic cell death in non-small cell lung cancer NCI-H460 cells. Biochem Biophys Res Commun 2005; 337:52-60.
34. Chen YJ, Shiao MS, Lee SS, Wang SY. Effect of Cordyceps sinensis on the proliferation and differentiation of human leukemic U937 cells. Life Sci 1997; 60:2349-59.